- Record: found
- Abstract: not found
- Article: not found
Clearance of senescent glial cells prevents tau-dependent pathology and cognitive decline
Tyler J. Bussian ,
Asef Aziz ,
Charlton F. Meyer ,
Barbara L. Swenson ,
Jan M. van Deursen ,
Darren J. Baker
September 19 2018
Read this article at

There is no author summary for this article yet. Authors can add summaries to their articles on ScienceOpen to make them more accessible to a non-specialist audience.
Abstract
Cellular senescence, characterized by an irreversible cell-cycle arrest
1
accompanied by a distinctive secretory phenotype
2
, can be induced through a variety of intracellular and extracellular factors. Senescent
cells expressing the cell cycle inhibitory protein p16INK4A, have been found to actively
drive naturally occurring age-related tissue deterioration
3,4
and contribute to several aging-associated diseases, including atherosclerosis
5
and osteoarthritis
6
. Various markers of senescence have been observed in patients suffering from neurodegenerative
diseases
7-9
, however, a role for senescent cells in the etiology of these pathologies is unknown.
Here we show a causal link between the accumulation of senescent cells and cognition-associated
neuronal loss. We found that the MAPT P301S PS19 mouse model of tau-dependent neurodegenerative
disease
10
accumulates p16Ink4a-positive senescent astrocytes and microglia. Clearance of these
cells as they arise using INK-ATTAC transgenic mice prevented gliosis, hyper-phosphorylation
of both soluble and insoluble tau leading to neurofibrillary tangle (NFT) deposition,
and degeneration of cortical and hippocampal neurons to preserved cognitive function.
Lastly, pharmacological intervention with a first generation senolytic modulated tau
aggregation. Collectively, these results demonstrate that senescent cells play a role
in tau-mediated disease initiation and progression; suggesting that targeting senescent
cells may provide a therapeutic avenue for treating these pathologies.
Senescent cells accumulate with aging and have been shown to contribute to tissue
dysfunction
11
, although their role in neurodegenerative disease has remained elusive. To address
this key open question, we selected the tau MAPT P301S PS19 (hereafter PS19) transgenic
mouse line that expresses high levels of mutant human tau specifically in neurons
under the regulation of the mouse prion promoter
10
. The model is characterized by gliosis, neurofibrillary tangle (NFT) deposition,
neurodegeneration, and loss of cognitive function. Pathology typically initiates in
the hippocampus and radiates outwards to the neocortex
10
. First, we performed RT-qPCR for p16
Ink4a on isolated hippocampi and cortices from Wildtype and PS19 littermates. p16
Ink4a expression was significantly increased beginning at 4 months of age in the hippocampus
and at 6 months in the cortex (Fig. 1a), which precedes the onset of NFT deposition
10
. Importantly, increased p16
Ink4a expression correlated with expression of widely established senescence markers
(Extended Data Fig. 1), indicating that senescent cells accumulate at sites of pathology
in the PS19 model.
To investigate the role of senescent cells in disease development, we crossed the
INK-ATTAC transgene (hereafter ATTAC) to the PS19 strain to eliminate p16
Ink4a-expressing senescent cells through biweekly administration of AP20187 (hereafter
AP)
3,4
from weaning age (Fig. 1b). Hippocampi and cortices isolated from 6-month-old vehicle
administered PS19;ATTAC mice displayed an elevated level of the ATTAC transgene as
measured by Casp8 and GFP (Fig. 1c and Extended Data Fig. 2). Senescence indicators,
including the cell cycle regulators p16
Ink4a, p19
Arf, p21
Cip1/Waf1
and the pro-inflammatory genes Pai1 (also called Serpine1), Il-6, and Il-1β, were
also elevated (Fig. 1c, Extended Data Fig. 2). AP administration in PS19;ATTAC mice
maintained the expression of these genes at a level comparable to control mice (Fig.
1c, Extended Data Fig. 2). Importantly, AP treatment of ATTAC mice lacking the PS19
transgene had no impact on the expression of these markers (Extended Data Fig. 2).
Thus, AP administration effectively and selectively cleared senescent cells in the
hippocampus and cortex of PS19;ATTAC mice.
To understand the mechanistic contribution of senescence to tau–mediated pathology,
we sought to identify the specific cell types that were becoming senescent. Firstly,
we stained cortices and hippocampi from 6-month-old vehicle-treated ATTAC and PS19;ATTAC
and AP-treated PS19;ATTAC mice for senescence-associated-β-galactosidase (SA-β-Gal)
12
and screened for cells that contained X-Gal crystals by transmission electron microscopy
(TEM)
13
. We found that cells that clearly and morphologically resembled astrocytes or microglia
contained X-Gal crystals, irrespectively of the mouse group (Fig. 1d). In contrast,
no crystals were found in any clearly identifiable neurons (Extended Data Fig. 3).
Vehicle-treated PS19;ATTAC mice had nearly double the number of cells containing X-Gal
crystals in both the hippocampus and cortex (Fig. 1e), whereas AP-treated PS19;ATTAC
mice had a similar incidence of X-Gal crystals as control mice (Fig. 1e). To validate
that senescence was impacting astrocytes and microglia, we performed FACS on 6-month-old
Wildtype and PS19 mice (Extended Data Fig. 4a). Isolated astrocytes and microglia
had increased expression of senescence-associated genes, including p16
Ink4a (Extended Data Fig. 4b, c). A similar induction was not observed in oligodendrocytes
or neuron-enriched CD56+ cells (Extended Data Fig. 4d, e and Extended Data Fig. 5),
supporting the conclusion that senescence occurs in astrocytes and microglia of PS19
mice. To verify that AP administration selectively targeted senescent cells, we made
in vitro cultures of primary microglia and astrocytes isolated from ATTAC mice. These
cultures were not sensitive to AP-mediated elimination in the absence of senescence-inducing
stimuli (Extended Data Fig. 6). Furthermore, short-term AP administration did not
promote excessive cellular death (Extended Data Fig. 7a) or increased proliferation
of microglia with extended treatment of ATTAC transgenic mice in vivo (Extended Data
Fig. 7b).
PS19 mice present progressive gliosis with disease progression
10
. To assess if AP administration impacted this process, RT-qPCR was performed on 6-month-old
hippocampi for markers of astrocytes (GFAP and S100β) and microglia (Cd11b). Vehicle-treated
PS19;ATTAC mice had an ~2–3 fold induction in these markers, whereas AP-treated PS19;ATTAC
mice expressed these markers at a similar level to control mice (Extended Data Fig.
8a, b). Immunohistochemistry (IHC) for GFAP and Iba1 confirmed these observations
(Extended Data Fig. 8c, d). Taken together, these results suggest that both gliosis
and glial cell senescence in the PS19 mouse model are effectively eliminated upon
the administration of AP in ATTAC mice.
A distinguishing characteristic of PS19 mice is the development of aggregates consisting
of hyperphosphorylated tau protein by 6 months of age
10
. To assess if tau aggregation was impacted with senescence clearance, we probed for
the levels of soluble total and phosphorylated tau (Ser202/Thr205) in addition to
the level of insoluble phosphorylated tau in vehicle-treated PS19;ATTAC and AP-treated
ATTAC and PS19;ATTAC mice. As expected
10
, vehicle-treated PS19;ATTAC mice displayed increased soluble total and phosphorylated
tau and insoluble phosphorylated tau (Fig. 2a, Extended Data Fig. 9a, b). AP-treated
PS19;ATTAC mice showed identical levels of soluble total tau protein to vehicle-treated
PS19;ATTAC mice (Fig. 2a), indicating that tau over-expression from the transgene
was maintained. Surprisingly, AP treatment of PS19;ATTAC mice significantly reduced
the amount of phosphorylated tau in both the soluble and insoluble fraction (Fig.
2a, Extended Data Fig. 9b). IHC staining for phospho-tau modifications at S202/T205,
T231, and S396 confirmed that senescent cell clearance attenuated tau phosphorylation
at a number of residues relevant for tau aggregation (Fig. 2b, Extended Data Fig.
9c). Furthermore, thioflavin S staining of 8-month-old mice from these same groups
revealed that NFT deposition in the dentate gyrus, the site of neurogenesis in the
hippocampus traditionally associated with memory formation and cognition
14
, was substantially reduced when senescent cells were removed (Fig. 2c). Collectively,
these results indicate that senescent cell accumulation promotes the formation of
hyperphosphorylated tau aggregates.
PS19 mice show neurodegeneration by 8 months of age
10
. As NFT deposition was attenuated with AP treatment in both the cortex and hippocampus
of PS19;ATTAC mice, we performed assessments for degeneration in these areas. Overt
brain size of vehicle-treated PS19;ATTAC mice was reduced compared to both ATTAC and
AP-treated PS19;ATTAC mice (Fig. 3a). In addition, we observed localized neurodegeneration
in the dentate gyrus of the hippocampus through Nissl staining in vehicle-treated
PS19;ATTAC mice (Fig. 3b). AP administration prevented thinning of the dentate gyrus
and increased neuron density. Sequential coronal sectioning and NeuN staining revealed
that the dentate gyrus was significantly reduced in vehicle-treated PS19;ATTAC mice
(Fig. 3c), further demonstrating that senescent cells promote neurodegeneration in
PS19 mice.
To test whether this improved cognitive function, we performed novel scent discrimination
assessments to test for changes in short-term memory (see experimental setup Fig.
3d)
15
. Whereas AP-treated ATTAC mice were more inquisitive to the novel scent during the
testing phase, vehicle-treated PS19;ATTAC mice were not (Fig. 3d). In contrast, AP-treated
PS19;ATTAC mice behaved nearly identically to control mice, indicating that senescent
cell elimination mitigated the short-term memory loss observed in vehicle-treated
PS19;ATTAC mice. Importantly, the overall distance traveled by mice in all groups
was unchanged (data not shown) and similar results were obtained with novel object
discrimination tests using the same setup using visual cues instead of scents (Extended
Data Fig. 10). Thus, these results demonstrate that senescent cells drive neurodegeneration
and loss of cognition in PS19 mice.
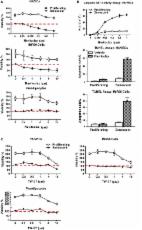
Lastly, we tested whether pharmacological elimination of senescent cells with the
senolytic ABT263 (navitoclax)
5,6,16,17
exhibited similar impacts to our genetic interventions in PS19 mice. Recent work has
demonstrated a therapeutic effect in orthotopically implanted glioblastomas with peripheral
administration pf ABT263
18
. WT and PS19 mice were treated with a repeating schedule of ABT263 beginning at weaning
age until the mice reached 6 months of age. Importantly, this treatment prevented
the upregulation of senescence-associated genes (Fig. 4a) and attenuated tau phosphorylation
in PS19 mice (Fig. 4b), indicating that senolytic interventions can recapitulate key
observations from transgenic mouse models of senescent cell ablation.
The mechanistic contribution of cells with features reminiscent of senescence to the
pathophysiology of neurodegenerative diseases has been a common question in recent
years
7–9,19–21
. Furthermore, recent work has suggested that senescent cells may contribute to Parkinson’s
disease pathology in both mice and humans
22
. Here we show that continuous clearance of p16
Ink4a-expressing senescent cells prior to disease onset in a model of aggressive tauopathy
has a significant impact on various aspects of disease progression including gliosis,
NFT formation, neurodegeneration, and cognitive decline. Remarkably, senescent cell
clearance has a significant impact on the accumulation of phosphorylated tau protein
in both the soluble and insoluble fractions. The amount of total soluble tau was unchanged
in AP-treated PS19;ATTAC mice (Fig. 2a), indicating that the aberrant hyper-phosphorylation
of tau protein and subsequent aggregation into NFTs is mediated by extracellular signaling
from p16
Ink4a-expressing senescent glial cells. The molecular mechanisms that senescent astrocytes
and microglia exploit to promote pathological conversion of tau into NFTs within neurons
require additional investigation. The absence of neurodegeneration in AP-treated mice
(Fig. 3) demonstrates that attenuated disease severity is not due to clearance of
neurons harboring NFTs. However, it is important to leave open the possibility that
other neurodegenerative disease models may exhibit senescence-associated alterations
in cell types not observed in the present study. Regardless, it is likely that intervention
in senescent cell accumulation in these models would also reduce disease severity
based on our observations. As this study was designed to prevent senescent cells from
accumulating to determine how this impacts disease, future studies of senolysis in
established disease models will be necessary to determine the utility of senolytic
strategies to translate into the clinic to stall or perhaps revert disease. As senescent
cells exhibit a unique and identifiable SASP, exploiting this phenotype may serve
as a possible therapeutic avenue to attenuate many tau-dependent pathologies. Our
observation that p16
Ink4a expression increases prior to NFT aggregation further supports the now commonly
held belief that early intervention in these diseases is essential to provide more
favorable impacts to patients.
Methods
Mouse strains and drug treatment
MAPT P301S PS19 (PS19) mice were purchased from The Jackson Laboratory (stock #008169)
and bred to C57BL/6 for three generations. C57BL/6 ATTAC transgenic mice are as described
3,4
. Male PS19 mice were bred to ATTAC females to generate cohorts of ATTAC and PS19;ATTAC
mice. All mice were on a pure C57BL/6 genetic background. Mice from this cohort were
randomly assigned to receive AP20187 (AP; B/B homodimerizer; Clontech) or vehicle
twice a week beginning at weaning age (3 weeks). Dosing of AP was 2.0 mg kg–1 body
weight. 6-month-old short-term AP pulse treated animals (Extended Data Fig. 6a) received
a dose of 10 mg kg–1 body weight for 5 consecutive days prior to tissue collection.
Senolytic intervention was performed in C57BL/6 WT and PS19 animals. At weaning, mice
were assigned to receive either ABT263 (Cayman, 923564–51-6) or vehicle (Phosal 50
PG, Lipoid NC0130871 – 60%; PEG400, Sigma 91893 – 30%, EtOH – 10%). ABT263 was administered
by oral gavage at a dose of 50 mg kg–1 body on a repeating regiment of five consecutive
days of treatment followed by 16 days of rest. Animals were housed in a 12h L/D cycle
environment in pathogen-free barrier conditions as described in detail
3
. Compliance with relevant ethical regulations and all animal procedures were reviewed
and approved by the Mayo Clinic Institutional Animal Care and Use Committee.
Statistical analysis
Prism software was used for all statistical analysis. A student’s two-tailed unpaired
t-test with Welch’s correction was used in Fig. 1a and Extended Data Fig. 4b – e;
two-way ANOVA with Tukey’s multiple comparisons test was used for Fig. 3d and Extended
Data Fig. 10; and one-way ANOVA with Tukey’s multiple comparisons test was used in
all other figures. For consistency in these comparisons, the following denotes significance
in all figures: *P < 0.05, **P < 0.01, ***P < 0.001. We note that no power calculations
were used. Sample sizes are based on previously published experiments where differences
were observed. No samples were excluded. Investigators were blinded to allocation
during experiments and outcomes assessment, except for rare instances where blinding
was not possible. All source data and exact P values (if applicable) for every figure
are included in the supporting information that accompanies the paper.
Senescence-associated β-galactosidase transmission electron microscopy (Gal-TEM)
Detection of X-Gal crystals by transmission electron microscopy (TEM) after senescence-associated
β-galactosidase (SA-β-Gal) staining was performed as described
3,5
with the following alterations to accommodate central nervous tissue. Mice were transcardially
perfused with ice-cold Dulbecco’s phosphate-buffered saline (DPBS; pH 7.4) until fluid
runoff was clear. This was followed by perfusion with 4% paraformaldehyde (PFA) for
10 minutes at a rate of 3 ml per minute, and then ice-cold DPBS was perfused again
for 2 minutes at the same rate to remove the remaining fixative. Brains were then
isolated and the hippocampus and cortex were dissected out. A 1 mm x 1 mm piece from
the CA1 and M1 region, respectively, was then incubated in SA-β-Gal staining solution
(Cell Signaling) at 37°C for 6 h (hippocampus) or 18 h (cortex). The samples were
placed in Trump’s fixative overnight at 4°C before being processed for routine transmission
electron microscopy (dehydration by xylene-alcohol series, osmium tetroxide staining,
and Epon resin embedding). Images were acquired and quantified using a Jeol 1400+
electron microscope with 80 kV acceleration voltage. Two grids from each tissue were
produced, and >100 cells were scanned per grid at a magnification of 20,000x to detect
X-Gal crystal containing cells. On average, half of all cells examined were neurons.
Cells with one or more crystals and the total number of cells were counted. Cells
containing crystals were imaged and independently assessed for distinguishing morphology.
To define cell type, the following criteria were applied: 1) astrocytes – circular
nucleus with spattered electron density pattern; 2) microglia – abnormally shaped
nucleus with a much darker, often phagosome containing cytoplasm; and 3) neuron –
large circular nucleus with less electron density and periodically denoted by an offshooting
axon. Only cells with morphology consistent of astrocytes or microglia were clearly
X-gal crystal positive.
Western blotting for soluble and sarkosyl insoluble proteins
Half brains were weighed and homogenized in 5X volume of Buffer I (50 mM Tris base
[pH 7.4], 50mM NaCl, 1mM EDTA, 1mM PMSF, 1X Halt™ Protease and Phosphatase Inhibitor
Cocktail [Thermo]). 250ul of the homogenate was then added to an equal volume of Buffer
S (50 mM Tris [pH 8.0], 274 mM NaCl, 5 mM KCl, 1 mM PMSF, 1X Halt™ Protease and Phosphatase
Inhibitor Cocktail [Thermo]) and ultracentrifuged at 150,000g for 15 minutes at 4°C.
The supernatant (S1-soluble protein fraction) was transferred to a new tube and the
pellet homogenized in 3x volume of sucrose buffer (10 mM Tris [pH7.4], 0.8M NaCl,
10% sucrose, 1mM EGTA, 1 mM PMSF) before being ultracentrifuged at 150,000g for 15
minutes at 4°C. The pellet was discarded and the supernatant incubated with sarkosyl
(Sodium lauroyl sarcosinate) at a final concentration of 1% for 1 hour at 37°C. Following
incubation, the samples were ultracentrifuged at 150,000g for 30 minutes at 4°C. The
supernatant was discarded and the pellet was re-suspended in 25ul Buffer F (10 mM
Tris [pH8.0], 1mM EDTA) to get the insoluble protein fraction (S2). Equal parts of
2x laemmli buffer (Bio-Rad) containing 5% β-mercaptoethanol was added to each fraction
(S1 and S2) and boiled at 100°C for 15 minutes to prepare the sarkosyl soluble and
insoluble protein lysates. For total protein lysate, 90ul of the homogenate (half
brain in 5X volume Buffer I) was added to 110ul of Buffer T (2% SDS, 50 mM Tris [pH7.4],
274 mM NaCl, 5 mM KCl, 5mM EDTA, 1% Triton-X-100, 1 mM PMSF, X Halt™ Protease and
Phosphatase Inhibitor Cocktail [Thermo]). The samples were then sonicated and centrifuged
at 16,000g for 15 minutes at 4°C to remove debris. The supernatant was removed and
added to equal parts 2x laemmli buffer with 5% β-mercaptoethanol and boiled at 100°C
for 15 minutes to prepare the total protein lysate. Western blotting was performed
as previously described
23
. Blots were probed with antibodies for total tau (ThermoFisher; MN1000, 1:5000) and
phospho-tau S202/T205 (ThermoFisher; MN1020, 1:1000). Ponceau S staining was performed
to normalize lysate loading for the total and S1 fraction lysates. Quantification
was performed using ImageJ as described
3
.
Quantitative RT-PCR
RNA extraction, cDNA synthesis, and RT-qPCR analysis were performed on hippocampi
and cortical samples from mouse brains as previously described
24
. Primers used to amplify Casp8, GFP, p16
Ink4a
, p19
Arf
, p21, Pai1, Il-6, Il-1b and Cd11b were as previously described
3,5,24
. The following additional primers were used: GFAP forward 5’-CCTTCTGACACGGATTTGGT-3’,
reverse 5’-TAAGCTAGCCCTGGACATCG-3’; S100β forward 5’-CCGGAGTACTGGTGGAAGAC-3’, reverse
5’-GGACACTGAAGCCAGAGAGG-3’; Aqp4 forward 5’-TGAGCTCCACATCAGGACAG-3’, reverse 5’-TCCAGCTCGATCTTTTGGAC-3’;
Cx3cr1 forward 5’-GTTCCAAAGGCCACAATGTC-3’, reverse 5’-TGAGTGACTGGCACTTCCTG-3’; Olig
forward 5’-CCCCAGGGATGATCTAAGC-3’, reverse 5’-CAGAGCCAGGTTCTCCTCC-3’; NeFL forward
5’-AGGCCATCTTGACATTGAGG-3’, reverse 5’-GCAGAATGCAGACATTAGCG-3’; TBP forward 5’-GGCCTCTCAGAAGCATCACTA-3’,
reverse 5’-GCCAAGCCCTGAGCATAA-3’. Expression for all experiments was normalized first
to TBP.
Immunohistochemistry and immunofluorescence staining
Mice were transcardially perfused as described above. Brains were stored in 4% PFA
overnight at 4°C and then cryoprotected by incubating in a 30% sucrose solution for
48 hours at 4°C. Samples were sectioned into 30 μM thick coronal sections and stored
in antifreeze solution (300g Sucrose, 300 mL Ethylene Glycol, 500 mL PBS) at −20°C.
Nissl staining (Bregma −2.1 to −2.4 mm), thioflavin S staining (Bregma −1.4 to −1.6
mm), and phospho-tau S202/S205 (ThermoFisher, MN1020; 1:500), phospho-tau T231 (ThermoFisher,
MN1040; 1:500), phospho-tau S396 (Abcam, 109390; 1:500), and Gfap (Dako, Z0334; 1:500)
and Iba1 (Novus, NB100–1028; 1:100) IHC staining (Bregma 1.6 to 1.0 mm and Lateral
2.0 to 2.7 mm) was performed on free-floating sections as described
25–27
. NeuN staining (EMD, MAB377; 1:200) of five sections (between Bregma −1.3 to −2.5)
to measure dentate gyrus area was performed as previously described
28
. For cellular proliferation assays, animals were injected with EdU (Carbosynth, NE08701;
75mg/kg) intraperitoneally 24 hours prior to sacrifice. Imaging of EdU positive cells
(Lateral 0.75 to 1.25 mm) was performed following manufacturer’s instructions (Invitrogen
- Click-iT™ EdU Alexa Fluor™ 488 Imaging Kit, C10337). Iba1 (Wako, 019–19741; 1:500)
immunofluorescent staining and Iba1/EdU colocalization assessments were performed
as previously described
28
. TUNEL staining (Lateral 0.75 to 1.25 mm) was performed according to the manufacturer’s
instructions (Roche In Situ Cell Death Detection Kit, Fluorescein: 11684795910). Thioflavin
S, EdU/Iba1 colocalization, and in vivo TUNEL stained images were acquired on a Zeiss
LSM 780 confocal system using multi-track configuration.
Single cell preparation and FACS
Dissociation of cerebral tissue was performed using the Adult Brain Dissociation kit
from Miltenyi (MACS, 130–107-677) according to the manufacturer’s instructions. Samples
were then incubated with a viability dye, LIVE/DEAD Aqua (Invitrogen, L34966; 1:250)
followed by incubation with Cd11b eFluor 450 (eBioscience, 48–0112-80, 1:100), Cd45
APC eFluor 780 (eBioscience, 47–0451-82; 1:200), Glast1 PE (Miltenyi Biotec, 130–095-821;
1:100), O1 AF 700 (R&D Systems, FAB1327N-100UG; 1:100), and Cd56 APC (R&D Systems,
FAB7820A; 1:100). These samples were then sorted using a FACSAria IIu SORP (BD Biosciences),
with gating parameters created using FACSDiva 8.0.1 (BD Biosciences). A precise gating
strategy was used to maximize the purification of each isolated cell population. Briefly,
populations were isolated first by a negative report of the viability dye indicating
the cell is viable (Extended Data Figure 4), followed by a positive report of the
desired marker, then negative reports of the other labels used. This strategy allowed
for live cells containing only the desired marker to be sorted, while eliminating
dead cells. Cells were sorted directly into lysis buffer and RNA was extracted with
RNeasy Micro kits according to manufacturer’s instruction (Qiagen, cat #: 74004).
cDNA synthesis and RT-qPCR analysis were performed as described above.
Novel object recognition
Novel object recognition testing was performed as previously described
15
. Briefly, mice from each cohort were acclimated to a 50 cm x 50 cm testing environment
for a period of two minutes. After acclimation, the mice were removed, the testing
area was cleaned with 70% EtOH, and two identical scented candles were placed in either
corner of the testing area approximately 5 cm from either wall. Mice were reintroduced,
and the ratio of both the number of visits and time spent at each candle was recorded
for a period of ten minutes. Recording was performed from above (Panasonic WV-CP294)
and all video files were analyzed with TopScan Version 3.00 (Clever Sys Inc.). Afterwards,
the mice were removed, the testing area cleaned with 70% EtOH, and one candle was
replaced with a novel scent. The mice were reintroduced and the number of visits and
total time per candle was recorded as before. Testing also was performed with visual
stimuli by placing identical toy brick towers at either corner and then replacing
with a different toy brick tower in the testing phase using the same experimental
paradigm monitoring for the number of investigations.
In vitro astrocyte and microglia culture
Astrocyte and microglia primary cultures were prepared in tandem from mixed glial
cultures as previously described
29
. C57BL/6 WT and ATTAC pups (p0-p3) were sacrificed, and the cerebellum was discarded.
The remaining tissue had its meninges removed using forceps and a dissection scope.
Cleaned cerebral tissue was placed in chilled Earle’s Balanced Salt Solution with
HEPES (EBSH) (NaCl [120 mM], NaH2PO4 [10 mM], KCl [2.5 mM], C6H12O6 [20 mM], HEPES
[20 mM], NaHCO3 [10 mM], BSA [0.3%], H2O) until the remaining animals were sacrificed,
and then animals were pooled together based on genotype (3–4 brains/group). The tissue
was minced using a razor blade and dissociated by shaking in a 0.025% Trypsin/EBSH
solution at 37°C for 30 minutes. FBS and MgSO4 (3.82%)/ DNAse I (1mg/ml) were added,
and the sample was placed on ice for 5 minutes to halt trypsinization. Samples were
mixed and centrifuged at 200g at 25°C for 5 minutes. The supernatant was discarded,
and the remaining pellet was resuspended in EBSH. Tissue was triturated using a 1
ml pipet to completely dissociate the sample and allowed to settle for 5 minutes to
remove large debris. Samples were then transferred to clean tubes and underlayed with
a 4% BSA/EBSH solution. The tissue was then centrifuged at 100g at 25°C for 8 minutes.
Cells were counted using trypan blue and a hemocytometer and plated on a PDL-coated
T75 dish (7–10 million cells/flask) with glial cell culture media (GCM) consisting
of DMEM with 10% FBS, C3H3NaO3 (1mM), Pen/Strep (500 ug/ml), and InvivoGen Primocin.
Cultures were grown for 14 days (37°C ambient O2) with media changes every 4 days.
Microglia were isolated as previously described
30
using the EasySep Mouse CD11b Positive Selection Kit from Stem Cell (cat #: 18970).
Microglia were collected and plated on 10-well glass slides (5,000 cells/well) and
cultured for 6 days in GCM with LADMAC-conditioned media (20%, generously provided
by the Howe Laboratory) before further experimentation. This conditioned media aids
in the proliferation and maintenance of microglia cultures through the secretion of
M-CSF by the LADMAC cells
31
. Microglia were allowed to proliferate for 6 days prior to experimentation. The mixed
glial culture flow-through from the EasySep CD11b kit was replated in GCM on a PDL-coated
T75 dish (10 million cells/flask). These cultures then underwent purification for
astrocytes as previously described
29
. After 48 hours, flasks were placed on an orbital shaker and agitated at 200 rpm
for two 24-hour periods with media refreshed once during and after the shaking. Flasks
were then exposed to GCM containing liposomal clodronate (Clodrosome, 8909; 100 µg/ml)
for 72 hours to remove any remaining microglia from the culture. The liposomal clodronate
media was then removed and culture plates washed prior to further experimentation.
Microglia activation and TUNEL staining
Microglia samples were exposed to media containing IFNy (R&D Systems, 285-IF; 200ng/ml),
LPS (Sigma, L2654; 100ng/ml) or a combination of both for a period of 24 hours to
induce an inflammatory response
32
. Cells were then processed for immunofluorescence to determine inflammation state
as previously described
33
. Anti-Cd11b antibody (BioRad, MCA711G; 1:500) and goat-anti-rat AlexaFluor 594 (Invitrogen,
A-11007; 1:500) staining was counterstained with DAPI (Invitrogen, D1306; 1:1000).
To assess AP-mediated cell clearance specificity, activated or basal microglia were
exposed to AP20187 (Clontech, 635059; 10nM or 100nM) for a period of 24 hours. TUNEL
staining was then performed according to manufacturer’s instructions (Roche In Situ
Cell Death Detection Kit, Fluorescein: 11684795910). All imaging was performed using
an Olympus BX53 Fluorescence microscope and DP80 digital camera. Analysis was performed
using the Fiji distribution of ImageJ (version 1.51n)
34
. To obtain a TUNEL positive percentage, a region of interest was defined using Li
Auto Thresholding of the DAPI channel, and the colocalization percentage was calculated
using the colocalization threshold plugin bound by that region.
Incucyte tracking of basal and activated astrocytes
To track basal and activated astrocytic response to AP, astrocytes were plated in
a 48 well culture plate (10,000 cells/well) and placed into the IncuCyte S3 Live-Cell
Analysis System. The IncuCyte System is a time-lapse imaging system that records cell
culture changes through photographic capture of the culture well within the incubator.
Cultures were acclimated to the system for a period of 6 hours, then exposed to media
containing IFNy (R&D Systems, 285-IF; 200ng/ml), LPS (Sigma, L2654; 100ng/ml) or a
combination of both for a period of 24 hours to induce an inflammatory response
35
. Cells were also plated on 10-well slides and processed in tandem for immunofluorescence
staining to verify activation status with anti-Gfap (DAKO, Z0334; 1:500) and counterstained
with DAPI (Invitrogen, D1306; 1:1000). After activation, astrocytes were exposed to
AP20187 (Clontech, 635059; 10nM or 100nM) for a period of 24 hours. The IncuCyte captured
phase images of each culture well were taken every 30 minutes over this period using
the following settings: (Segmentation Adjustment: 0.8, Hole Fill: 450, Adjust size
(pixels): −1, Minimum area (uM
2
): 0.1). Phase confluency difference was calculated by subtracting the final phase
confluency of each image from its initial value.
Extended Data
Extended Data Figure 1.
Senescent cells accumulate in PS19 mice.
RT-qPCR analysis for senescence-associated genes in hippocampi (left) and cortices
(right) of 3- and 10-month-old male mice (animal numbers indicated in the legend,
2 independent experiments; normalized to 3 m Wildtype group). Data are mean ± s.e.m.
*P < 0.05; **P < 0.01; ***P < 0.001 (one-way ANOVA with Tukey’s multiple comparisons
test). Exact P values can be found in the accompanying source data file.
Extended Data Figure 2.
AP-mediated clearance selectively removes senescent cells that accumulate in brains
of PS19;ATTAC mice.
Expression of senescence markers from 6-month-old female hippocampus (left) and cortex
(cortex) either vehicle (–AP) or AP20187 (+AP) treated assessed by RT-qPCR (animal
numbers indicated in the legend; normalized to ATTAC –AP group). p21 is also known
as Cdkn1a; Pai1 is also known as Serpine1. Data are mean ± s.e.m. *P < 0.05; **P <
0.01; ***P < 0.001 (one-way ANOVA with Tukey’s multiple comparisons test). Exact P
values can be found in the accompanying source data file.
Extended Data Figure 3.
Neurons do not exhibit X-Gal crystals by Gal-TEM.
Representative electron microscopy image of neurons after SA-β-Gal staining from a
6-month-old vehicle-treated PS19;ATTAC male mouse (n = 3 male mice, 2 independent
experiments). The image has been artificially colored to denote individual cell bodies.
Scale bar: 10 µm.
Extended Data Figure 4.
Increased senescence-associated gene expression is observed in astrocytes and microglia
isolated from PS19 mice.
a–e, Gating strategy (a) for FACS isolation of living astrocytes (b), microglia (c),
oligodendrocytes (d), and neuron-enriched Cd56+ cells (e) from cortices from 6-month-old
WT and PS19 mice. b, Astrocyte (Cd11b–,Cd45–,O1–,GLAST+,Cd56–) fraction (left) and
RT-qPCR analysis (right). c, Microglia (Cd11b+,Cd45+,O1,GLAST+,Cd56–) fraction (left)
and RT-qPCR analysis (right). d, Oligodendrocyte (Cd11b–,Cd45–,O1+,GLAST–,Cd56–) fraction
(left) and RT-qPCR analysis (right). e, Neuron-enriched Cd56+ (Cd11b–,Cd45–,O1–,GLAST–,Cd56+)
fraction (left) and RT-qPCR analysis (right). p21 is also known as Cdkn1a; Pai1 is
also known as Serpine1. Individual numbers of independent animal cell population isolations
are indicated in the parentheses above p16
Ink4a columns (2 independent experiments). Data are mean ± s.e.m. *P < 0.05; **P <
0.01 (unpaired two-sided t-tests with Welch’s correction). Exact P values can be found
in the accompanying source data file.
Extended Data Figure 5.
Cell identity verification of cell populations isolated by FACS.
a–d, RT-qPCR analysis for cell identity markers from cell populations isolated from
6-month-old Wildtype and PS19 mice for Aqp4 expression enriched in astrocytes (a),
Cx3cr1 expression enriched in microglia (b), Olig expression enriched in oligodendrocytes
(c), and Nefl expression enriched in neurons (d). Expression is normalized to intact
cortices of 6-month-old Wildtype mice (n = 4 biologically independent cell isolations
for each group, 2 independent experiments). Data are mean ± s.e.m. ***P < 0.001 (one-way
ANOVA with Tukey’s multiple comparisons test). Exact P values can be found in the
accompanying source data file.
Extended Data Figure 6.
AP administration does not precociously eliminate non-senescent glial cells isolated
from ATTAC mice.
a, Cd11b staining of primary microglia treated with IFNγ (200 ng/ml), LPS (100 ng/ml),
or a combination of both (n = 3 biologically independent samples). b, Quantification
of TUNEL positive bodies in basal or activated microglia (n = 4 WT and 8 ATTAC cultures
for each treatment group, 2 independent experiments). c, GFAP staining of primary
astrocytes treated with IFNγ, LPS, or a combination of both as described in (a) (n
= 3 biologically independent samples). d, Quantification of confluency change over
24 hours in basal or activated astrocytes (n = 4 biologically independent cultures
of each genotype and treatment). Scale Bars, 100 μm (a and c). Data are mean ± s.e.m.
*P < 0.05; ***P < 0.001 (one-way ANOVA with Tukey’s multiple comparisons test (b and
d)). Exact P values can be found in the accompanying source data file.
Extended Data Figure 7.
AP-administration does not broadly eliminate cells or increase proliferation of microglia.
a, Quantification of TUNEL positive bodies (as a percentage of all cells) at the transition
between the CA2 and CA3 within the hippocampus after a short-term AP administration
in 6-month-old mice (n = 3 mice per genotype and treatment group). b, Quantification
of Iba1/EdU double positive cells in hippocampus and cortex from 6-month-old mice
administered AP beginning at weaning age (n = 4 mice per genotype and treatment group).
Data are mean ± s.e.m. We note that no comparison is statistically significant (one-way
ANOVA with Tukey’s multiple comparisons test). Exact P values can be found in the
accompanying source data file.
Extended Data Figure 8.
Senescent cells promote gliosis.
a, RT-qPCR analysis for Gfap, S100β, and Cd11b in hippocampi of 6-month-old male mice
(n = 5 mice per group; normalized to ATTAC –AP group). b, RT-qPCR analysis as in (a)
in hippocampi of 6-month-old female mice (animal number indicated in legend; normalized
to ATTAC –AP group). c, Representative Gfap IHC staining in the hippocampus of 6-month-old
vehicle and AP-treated ATTAC and PS19;ATTAC female mice (n = 4 mice per group, 2 independent
experiments). d, Representative Iba1 staining in the hippocampus of 6-month-old vehicle
and AP-treated ATTAC and PS19;ATTAC female mice (n = 4 mice per group, 2 independent
experiments). Scale bar, 100 µm (c) and 50 µm (d). Data are mean ± s.e.m. *P < 0.05;
**P < 0.01; ***P < 0.001 (one-way ANOVA with Tukey’s multiple comparisons test). Exact
P values can be found in the accompanying source data file.
Extended Data Figure 9.
AP treatment attenuates tau phosphorylation.
a, Ponceau S loading controls for western blot lysates of 6-month-old whole brain
total-tau (left) and phosphorylated tau (S202/T205; right) shown in Figure 3a. b,
Quantification of westerns blot analysis from 6-month-old whole brain for soluble
tau (left), soluble phosphorylated tau (S202/T205; middle), and insoluble phosphorylated
tau (S202/T205; right). Biologically independent animal numbers are indicated, data
are from ≥ 3 independent experiments. c, Immunostaining of 6-month-old cortex for
phosphorylated tau protein at T231 (top) and S396 (bottom; n = 4 mice per group, 2
independent experiments). Scale bar, 100µm. Data are mean ± s.e.m. ***P < 0.001 (one-way
ANOVA with Tukey’s multiple comparisons test). Exact P values can be found in the
accompanying source data file.
Extended Data Figure 10.
Vision-based novel object discrimination remains intact in AP-treated PS19;ATTAC mice.
Objects used for novel object recognition during the training and testing phase for
visual discrimination (left) and the average ratio for the number of investigations
(right, n = 8 female mice per group). Data are mean ± s.e.m. **P < 0.01; ***P < 0.001
(two-way ANOVA with Tukey’s multiple comparisons test). Exact P values can be found
in the accompanying source data file.
Supplementary Material
1
2
Related collections
Most cited references22
- Record: found
- Abstract: found
- Article: not found
Senescent cells: an emerging target for diseases of ageing
Dan Marquess, Jamie Dananberg, Jan van Deursen … (2017)
- Record: found
- Abstract: found
- Article: found
Identification of a novel senolytic agent, navitoclax, targeting the Bcl‐2 family of anti‐apoptotic factors
Yi Zhu, Tamara Tchkonia, Heike Fuhrmann-Stroissnigg … (2016)

- Record: found
- Abstract: found
- Article: found
Astrocyte Senescence as a Component of Alzheimer’s Disease
Rekha Bhat, Elizabeth Crowe, Alessandro Bitto … (2012)