- Record: found
- Abstract: found
- Article: found
Mental Health and Substance Use Among Adults with Disabilities During the COVID-19 Pandemic — United States, February–March 2021
research-article

Mark É. Czeisler
1
,
2
,
3
,
4 ,
Amy Board , DrPH
5
,
6
,
7
,
,
JoAnn M. Thierry , PhD
5 ,
Charles A. Czeisler , PhD, MD
1
,
3
,
4 ,
Shantha M.W. Rajaratnam , PhD
1
,
2
,
3
,
4 ,
Mark E. Howard , MBBS, PhD
1
,
2
,
8 ,
Kristie E.N. Clarke , MD
5
27 August 2021
Read this article at
There is no author summary for this article yet. Authors can add summaries to their articles on ScienceOpen to make them more accessible to a non-specialist audience.
Abstract
Adults with disabilities, a group including >25% of U.S. adults (
1
), experience higher levels of mental health and substance use conditions and lower
treatment rates than do adults without disabilities* (
2
,
3
). Survey data collected during April–September 2020 revealed elevated adverse mental
health symptoms among adults with disabilities (
4
) compared with the general adult population (
5
). Despite disproportionate risk for infection with SARS-CoV-2, the virus that causes
COVID-19, and COVID-19–associated hospitalization and mortality among some adults
with disabilities (
6
), information about mental health and substance use in this population during the
pandemic is limited. To identify factors associated with adverse mental health symptoms
and substance use among adults with disabilities, the COVID-19 Outbreak Public Evaluation
(COPE) Initiative
†
administered nonprobability–based Internet surveys to 5,256 U.S. adults during February–March
2021 (response rate = 62.1%). Among 5,119 respondents who completed a two-item disability
screener, nearly one third (1,648; 32.2%) screened as adults with disabilities. These
adults more frequently experienced symptoms of anxiety or depression (56.6% versus
28.7%, respectively), new or increased substance use (38.8% versus 17.5%), and suicidal
ideation (30.6% versus 8.3%) than did adults without disabilities. Among all adults
who had received a diagnosis of mental health or substance use conditions, adults
with disabilities more frequently (42.6% versus 35.3%; p <0.001) reported that the
pandemic made it harder for them to access related care or medication. Enhanced mental
health and substance use screening among adults with disabilities and improved access
to medical services are critical during public health emergencies such as the COVID-19
pandemic.
During February 16–March 8, 2021, among 8,475 eligible invited respondents aged ≥18
years, 5,261 (62.1%) completed nonprobability based, English-language, Internet-based
Qualtrics surveys for COPE.
§
Participants provided informed consent electronically. Quota sampling and survey weighting
were used to match U.S. Census Bureau’s 2019 American Community Survey adult U.S.
population estimates for sex, age, and race/ethnicity to enhance the representativeness
of this nonrandom sample.
Among 5,256 respondents who answered questions for weighting variables, 5,119 (97.4%)
completed a two-question disability screener.
¶
Respondents completed clinically validated self-screening instruments for symptoms
of anxiety and depression** and reported past-month new or increased substance use
to cope with stress or emotions and serious suicidal ideation.
††
Respondents also indicated prepandemic and past-month use of seven classes
§§
of substances to cope with stress or emotions. Adults with diagnosed anxiety, depression,
posttraumatic stress disorder, or substance use disorders indicated whether their
ability to access care or medications for these conditions was easier, harder, or
unaffected because of the pandemic. Prevalence estimates for adverse mental health
symptoms and substance use were compared among adults with and without disabilities
using chi-square tests. Multivariable Poisson regression models with robust standard
error estimators were used to estimate adjusted prevalence ratios (aPRs) by symptom
type among adults with and without disabilities. To calculate associations between
disability status and adverse mental health symptoms or substance use over time, aPRs
were estimated for symptoms among unique participants in previous COPE survey waves
(June, September, and December 2020). Covariates
¶¶
included sex, age group, race/ethnicity, income, U.S. Census region, urbanicity, and
parental or unpaid caregiving roles.*** McNemar’s test assessed prepandemic and past-month
substance use among adults with and without disabilities. Analyses were conducted
using Python software (version 3.7.8; Python Software Foundation) and R statistical
software (version 4.0.2; R Foundation) using the R survey package (version 3.29; R
Foundation). The Monash University Human Research Ethics Committee reviewed and approved
the study. This activity was reviewed by CDC and conducted consistent with applicable
federal law and CDC policy.
†††
Among a total of 5,119 respondents, 1,648 (32.2%) respondents reported living with
disabilities (778 [47.2%] with limiting physical, mental, or emotional conditions
only; 171 [10.4%] with health conditions requiring special equipment only; and 669
[42.4%] with both types of conditions) (Table). Overall, 64.1% of adults with disabilities
reported adverse mental health symptoms or substance use compared with 36.0% of adults
without disabilities; past-month substance use was higher among adults with disabilities
(40.6%) than among adults without disabilities (24.5%). Prevalence estimates of each
of the following were higher among adults with disabilities than among adults without
disabilities: symptoms of anxiety or depression (56.6% versus 28.7%, respectively),
new or increased substance use (38.8% versus 17.5%), and serious suicidal ideation
(30.6% versus 8.3%) (Supplementary Table, https://stacks.cdc.gov/view/cdc/108999).
At all timepoints, aPRs for all symptom types were significantly higher among adults
with disabilities than among adults without disabilities (Figure 1). During February
16–March 8, 2021, among adults with disabilities, aPRs for symptoms of anxiety or
depression and new or increased substance use were approximately 1.5 times as high,
and the aPR for serious suicidal ideation was approximately 2.5 times as high as in
adults without disabilities. Comparing subgroups of adults with and without disabilities,
symptoms of anxiety or depression were approximately twice as prevalent among adults
with disabilities who were aged ≥50 years (aPR = 2.4; 95% confidence interval [CI] = 1.7–3.2),
those of non-Hispanic Asian race/ethnicity (2.4; 95% CI = 1.3–4.8), those of Hispanic
or Latino (Hispanic) ethnicity (2.1; 95% CI = 1.4–3.0), and those who were not in
parental or caregiver roles (2.1; 95% CI = 1.7–2.6). New or increased substance use
was approximately twice as prevalent among adults with disabilities in parental roles
only (2.4; 95% CI = 1.5–3.9) and among essential workers (2.3; 95% CI = 2.0–2.7).
Suicidal ideation was also more prevalent among adults with disabilities aged ≥50
years (4.0; 95% CI = 2.1–7.8), those of Hispanic ethnicity (3.4; 95% CI = 1.9–6.0),
adults in unpaid caregiving roles (3.4; 95% CI = 1.5–7.7), and essential (3.5; 95%
CI = 2.8–4.4) or nonessential (5.3; 95% CI = 2.8–10.1) workers.
TABLE
Prevalence of symptoms of anxiety or depression, substance use, and suicidal ideation
among adults with disabilities, by disability status and other characteristics — United
States, February 16–March 8, 2021
Characteristic
No. (%)
Adults with disabilities, No. (%)*
All respondents
Adults with disabilities
Symptoms of anxiety or depression†
New or increased substance use to cope§
Seriously considered suicide¶
One or more of these symptoms
Total
5,119 (100)
1,648 (32.2)
932 (56.6)
640 (38.8)
504 (30.6)
1,057 (64.1)
Disability screener**
Limited by a physical, mental, or emotional condition
778 (15.2)
778 (47.2)
417 (53.7)
218 (28.0)
148 (19.0)
465 (59.8)
Limited by a health condition that requires special equipment
171 (3.3)
171 (10.4)
104 (60.5)
88 (51.5)
65 (38.2)
123 (71.8)
Both of above
699 (13.7)
669 (42.4)
411 (58.8)
334 (47.8)
291 (41.5)
469 (67.1)
Neither of above
3,471 (67.8)
0 (—)
N/A
N/A
N/A
N/A
Sex
††
Female
2,499 (48.8)
789 (47.9)
445 (56.5)
260 (32.9)
178 (22.6)
501 (63.5)
Male
2,583 (50.5)
838 (50.8)
469 (55.9)
369 (44.0)
314 (37.4)
537 (64.1)
Age group, yrs
18–29
938 (18.3)
314 (19.0)
250 (79.8)
185 (59.1)
136 (43.3)
276 (87.8)
30–39
967 (18.9)
325 (19.7)
259 (79.8)
198 (60.9)
166 (51.1)
281 (86.6)
40–49
818 (16.0)
253 (15.4)
180 (70.9)
137 (54.0)
125 (49.5)
202 (79.6)
50–59
972 (19.0)
309 (18.8)
132 (42.6)
80 (25.9)
54 (17.5)
158 (51.2)
60–69
790 (15.4)
235 (14.2)
59 (25.2)
21 (8.9)
4 (1.8)
72 (30.7)
≥70
634 (12.4)
213 (12.9)
52 (24.7)
19 (8.8)
19 (8.8)
68 (31.9)
Race/Ethnicity
White, non-Hispanic
3,103 (60.6)
975 (59.2)
522 (53.6)
327 (33.5)
266 (27.3)
585 (60.0)
Black, non-Hispanic
638 (12.5)
181 (11.0)
99 (54.6)
68 (37.9)
35 (19.3)
110 (60.9)
Asian, non-Hispanic
289 (5.6)
65 (3.9)
39 (61.1)
18 (27.8)
14 (21.0)
47 (72.1)
Multiple/other race, non-Hispanic§§
188 (3.7)
70 (4.3)
32 (45.2)
16 (23.3)
13 (18.3)
32 (45.8)
Hispanic or Latino, any race
902 (17.6)
357 (21.7)
240 (67.2)
210 (58.8)
177 (49.5)
283 (79.3)
2020 Household income, USD
¶¶
<25,000
1,182 (23.1)
544 (33.0)
286 (52.6)
151 (27.8)
107 (19.7)
327 (60.0)
25,000–49,999
1,203 (23.5)
355 (21.5)
179 (50.4)
110 (30.9)
82 (23.2)
202 (56.9)
50,000–99,999
1,306 (25.5)
350 (21.2)
191 (54.6)
134 (38.2)
103 (29.5)
218 (62.1)
≥100,000
1,204 (23.5)
341 (20.7)
253 (74.1)
232 (68.1)
205 (60.1)
286 (83.8)
Education
High school diploma or less
1,379 (26.9)
485 (29.4)
264 (54.4)
155 (31.8)
135 (27.9)
309 (63.7)
College or some college
2,876 (56.2)
865 (52.5)
463 (53.5)
312 (36.0)
213 (24.6)
520 (60.1)
After bachelor's degree
865 (16.9)
298 (18.1)
206 (69.0)
174 (58.2)
156 (52.3)
228 (76.4)
Employment status
Employed (essential employee)
1,797 (35.1)
605 (36.7)
475 (78.6)
448 (74.2)
371 (61.4)
542 (89.6)
Employed (nonessential employee)
941 (18.4)
151 (9.1)
87 (57.9)
53 (35.2)
38 (25.4)
103 (68.3)
Unemployed
936 (18.3)
349 (21.2)
190 (54.5)
77 (22.2)
55 (15.9)
207 (59.3)
Retired
1,263 (24.7)
493 (29.9)
142 (28.8)
45 (9.1)
24 (4.8)
167 (33.8)
Student
182 (3.6)
51 (3.1)
38 (73.7)
16 (31.9)
15 (29.8)
38 (74.5)
Parental role and unpaid caregiving status***
Neither parent nor caregiver
2,882 (56.3)
741 (44.9)
294 (39.7)
90 (12.2)
70 (9.4)
323 (43.6)
Parent only
611 (11.9)
189 (11.5)
97 (51.3)
48 (25.1)
21 (11.3)
110 (58.0)
Caregiver role of adults only
426 (8.3)
117 (7.1)
57 (48.6)
39 (33.1)
24 (20.9)
71 (60.5)
Parental and caregiver roles
1,201 (23.5)
602 (36.5)
485 (80.5)
463 (77.0)
389 (64.6)
553 (92.0)
U.S. Census region
†††
Northeast
899 (17.6)
267 (16.2)
177 (66.0)
119 (44.7)
109 (40.6)
188 (70.5)
Midwest
1,069 (20.9)
349 (21.1)
208 (59.8)
126 (36.0)
94 (27.1)
222 (63.6)
South
2,074 (40.5)
700 (42.5)
367 (52.4)
262 (37.4)
195 (27.9)
442 (63.1)
West
1,077 (21.0)
333 (20.2)
180 (54.2)
133 (40.1)
106 (31.8)
205 (61.7)
Urbanicity (n = 5,091)§§§
Urban
4,241 (83.3)
1,313 (79.6)
761 (58.0)
544 (41.4)
440 (33.5)
866 (66.0)
Rural
850 (16.7)
322 (19.5)
158 (49.1)
87 (27.1)
56 (17.4)
178 (55.2)
Abbreviations: N/A = not applicable; USD = U.S. dollars.
* Weighted rounded counts and percentages might not sum to expected values.
† Symptoms of anxiety and depression were assessed via the four-item Patient Health
Questionnaire (PHQ-4). Respondents who scored ≥3 out of 6 on the Generalized Anxiety
Disorder (GAD-2) and Patient Health Questionnaire (PHQ-2) subscales were considered
symptomatic for these respective conditions.
§ New or increased substance use was assessed by using the question, “Have you started
or increased using substances to help you cope with stress or emotions during the
COVID-19 pandemic? Substance use includes alcohol, legal or illegal drugs, or prescription
drug use in any way not directed by a doctor.”
¶ Suicidal ideation was assessed by using an item from the National Survey on Drug
Use and Health (https://nsduhweb.rti.org/respweb/homepage.cfm) adapted to refer to
the previous 30 days, “At any time in the past 30 days, did you seriously think about
trying to kill yourself?”
** Adults who had a disability were defined as such based on a qualifying response
to either one of two questions: “Are you limited in any way in any activities because
of physical, mental, or emotional condition?” and “Do you have any health conditions
that require you to use special equipment, such as a cane, wheelchair, special bed,
or special telephone?” Respondents who completed only one of the two disability screening
questions (limited by a physical, mental, or emotional condition: 17); limited by
a health condition that requires special equipment: 12) were classified as living
with only that disability. https://www.cdc.gov/brfss/questionnaires/pdf-ques/2015-brfss-questionnaire-12-29-14.pdf
†† Gender responses of “Transgender” (22; 0.4%) and “None of these” (15; 0.3%) are
not shown because of small counts.
§§ The non-Hispanic, multiple/other race or multiple races category includes respondents
who identified as not Hispanic and as more than one race or as American Indian or
Alaska Native, Native Hawaiian or Other Pacific Islander, or any other race.
¶¶ Household income responses of “Prefer not to say” (225) are not shown because of
an inability to sufficiently characterize these responses.
*** Adults who were in parental or unpaid caregiving roles were self-identified. For
this analysis, the definition of unpaid caregivers of adults was having provided unpaid
care to a relative or friend ≥18 years to help them take care of themselves at any
time during the 3 months before the survey. The definition of someone in a parental
role was having provided unpaid care to a relative or friend <18 years. Respondents
answered these questions separately. During analysis, all respondents were categorized
as being in a parental role only, caregivers of adults only, having both parental
and caregiving roles, or having neither parental nor caregiving roles. Adults in parenting
roles might not have been natural or legal parents of children in their care.
†††
https://www2.census.gov/geo/pdfs/maps-data/maps/reference/us_regdiv.pdf
§§§ Invalid postcodes were provided by 28 respondents, for whom urbanicity was not
categorized. https://www.hrsa.gov/rural-health/about-us/definition/datafiles.html
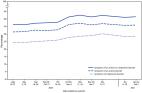
FIGURE 1
Adjusted prevalence ratios* and 95% confidence intervals
†
for ≥1 symptoms of adverse mental health or substance use (A), symptoms of anxiety
or depression (B), new or increased substance use (C), and suicidal ideation (D) among
adults with disabilities, compared with adults without disabilities (referent group)
§
— United States, February 16–March 8, 2021¶
Abbreviations: aPR = adjusted prevalence ratio; CI = confidence interval.
* With 95% CIs indicated by error bars. Multivariable Poisson regression models included
sex, age group in years, race/ethnicity, income, U.S. Census region, urbanicity, and
parental or unpaid caregiving roles (parental roles were not assessed in June 2020;
only unpaid caregiving roles were considered for this variable in the June 2020 models).
Separate, additional models were run to estimate aPRs for the following employment
statuses: essential worker, nonessential worker, and unemployed. Estimates were not
made for retired or student employment statuses because of collinearity between these
employment statuses and age.
† For panels A, B, and C, the y-axis range for aPR estimates is 0–5, which contains
all aPRs and 95% CIs for these panels with maximal view of differences in model estimates.
For panel D, given the relative rarity of suicidal ideation among some demographic
subgroups that results in wide CIs for aPR estimates, the y-axis range is 0–10.
§ Within each subgroup, adults without disabilities are the reference group used to
estimate aPRs for outcomes among adults with disabilities.
¶ Estimated aPRs are during February 16–March 8, 2021, except for the “over time”
estimates, which also include estimates based on data collected during June 24–30,
2020, August 28–September 6, 2020, and December 6–27, 2020.
Figure consists of four bar graphs that show adjusted prevalence ratios and 95% confidence
intervals for mental health and substance use among adults with disabilities versus
adults without disabilities, United States, February 16 through March 8, 2021.
The prevalence of substance use to cope with stress or emotions among adults with
disabilities was higher than that among adults without disabilities, both prepandemic
(39.7% versus 25.3%, respectively) and in the past month (40.6% versus 24.5%; both
p<0.001) (Figure 2). Among adults with disabilities, the past-month prevalence of
methamphetamine use (8.4%), nonopioid prescription drug misuse (4.9%), and polysubstance
use (16.9%) was approximately twice as high, and the prevalence of cocaine use (6.4%)
and prescription or illicit opioid use (9.1%) were nearly three times as high compared
with those among adults without disabilities (methamphetamine use 3.4%; nonopioid
prescription drug misuse 2.0%; polysubstance use 7.9%; cocaine use 2.2%; prescription
or illicit opioid use 3.2%). Past-month methamphetamine use prevalence increased significantly
compared with prepandemic use prevalence among all respondents (with disabilities,
45.6% increase, p<0.001; without disabilities, 40.6% increase, p = 0.003). Among respondents
who reported a diagnosed mental health or substance use condition, a higher percentage
of adults with (versus without) disabilities reported that accessing care or medication
was harder because of the COVID-19 pandemic (42.6% versus 35.3%, respectively, p<0.001).
FIGURE 2
Prevalence of prepandemic and past-month substance use to cope with stress or emotions
among adults, by disability status and type of substance — United States, February
16–March 8, 2021*
,
†
,
§
* Overall, prepandemic and past-month use of any of these substances were reported
by 39.7% and 40.6%, respectively, of adults with disabilities, and by 25.3% and 24.5%,
respectively, of adults without disabilities.
† All differences between adults with disabilities and adults without disabilities
were significant (chi-square p-value <0.05).
§ Circles for use of marijuana (among adults with disabilities), use of prescription
drugs (among adults without disabilities), and polysubstance use (among adults with
disabilities) might appear overlapping because of very small changes in reported prevalence
(<1% in all cases).
Figure shows the prevalence of prepandemic and past-month substance use to cope with
stress or emotions among adults by disability and substance type, United States, February
16–March 8, 2021.
Discussion
Nearly two thirds of surveyed adults with disabilities (who represented approximately
32% of the sample) reported adverse mental health symptoms or substance use in early
2021, compared with approximately one third of adults without disabilities. Serious
suicidal ideation was approximately 2.5 times as high among adults with disabilities,
and methamphetamine use, opioid use, nonopioid prescription drug misuse, and polysubstance
use were at least twice as prevalent among adults with disabilities. These findings
suggest value in enhanced mental health screening among adults with disabilities and
in ensuring accessibility of routine and crisis services, particularly given that
many adults reported that the COVID-19 pandemic had reduced mental health and substance
use care or medication accessibility. Mental health disparities among adults with
disabilities were observed across demographic groups, highlighting the importance
of ensuring access to disaster distress
§§§
and suicide prevention
¶¶¶
resources in this population. Important strategies to prevent persons from becoming
suicidal include strengthening economic supports, promoting connectedness, and teaching
coping skills.**** Health care providers could incorporate trauma-informed care, because
adults with disabilities might have encountered stigma and trauma in previous health
care interactions. Adults with disabilities more frequently reported prepandemic and
past-month substance use to cope with stress or emotions compared with adults without
disabilities. The substance with the largest increase in use was methamphetamine,
which is particularly concerning given the increase in amphetamine overdoses
††††
(
7
). Drug overdose deaths rose in 2020, driven by synthetic opioids.
§§§§
Consistent with previous research, adults with disabilities disproportionately reported
opioid use and nonopioid prescription drug misuse (
8
), highlighting the importance of educating patients and ensuring clinician access
to prescription drug monitoring programs.
¶¶¶¶
Nearly one in ten adults with disabilities reported past-month opioid use, and opioid
use among adults without disabilities increased. Policies that reduce barriers to
evidence-based treatment, including recently updated buprenorphine practice guidelines,*****
might improve access.
The findings in this report are subject to at least four limitations. First, self-reported
mental health and substance use might be subject to social desirability biases and
stigma, which could lead to underreporting. Second, because the surveys were English-language
only and data were obtained using nonprobability–based sampling, despite quota sampling
and survey weighting, the findings from this nonrandom sample might not be generalizable.
However, the proportion and demographics of surveyed adults with disabilities were
similar to those of recent samples from other sources with the same or similar screening
questions (
1
,
2
,
4
), and prevalence estimates of symptoms of anxiety and depression were largely consistent
with those from other sources for the U.S. adult population (
9
) and adults with disabilities (
4
) including the U.S. Census Bureau’s probability-based Household Pulse Survey (64.3%
among adults with disabilities compared with 27.4% among adults without disabilities
in April 2021).
†††††
Third, the respondents with disabilities might not be representative of all adults
with disabilities, some of whom might lack access to hardware or assistive technologies
required to independently complete the survey. Finally, adverse mental health symptoms
might, in some cases, represent respondents’ disabling mental health conditions, which
could confound associations with other comorbid disabling conditions (e.g., physical,
cognitive, sensory); however, sensitivity analyses excluding adults with disabilities
who had mental health or substance use diagnoses yielded consistent findings.
Adults with disabilities have been disproportionately affected by adverse mental health
symptoms and substance use during the COVID-19 pandemic, highlighting the importance
of improved access to treatment for this population. Clinicians might consider screening
all patients for mental health and substance use conditions during and after the pandemic.
§§§§§
Behavioral health care providers might also consider facility, policy, and procedural
pathway analyses to ensure accessibility for clients with physical, sensory, or cognitive
disabilities.¶¶¶¶¶ Strategies designed to increase access to care and medication during
public health emergencies, such as telehealth, might consider telemedicine platform
and system accessibility for adults with disabilities (
10
); further research to identify and address health disparities among adults with disabilities
could help guide additional evidence-based strategies.
Summary
What is already known about this topic?
Adults with disabilities experience higher levels of mental health conditions and
substance use than do adults without disabilities.
What is added by this report?
During February–March 2021, 64.1% of surveyed U.S. adults with disabilities reported
adverse mental health symptoms or substance use; past-month substance use was higher
than that among adults without disabilities (40.6% versus 24.5%, respectively). Among
adults with a diagnosis of mental health or substance use conditions, adults with
disabilities more frequently (43% versus 35%) reported pandemic-related difficulty
accessing related care and medications.
What are the implications for public health practice?
During public health emergencies, including the COVID-19 pandemic, enhanced mental
health and substance use screening among adults with disabilities and improved access
to related health care services are critical.
Related collections
Most cited references9

- Record: found
- Abstract: found
- Article: found
Prevalence of Disabilities and Health Care Access by Disability Status and Type Among Adults — United States, 2016
Catherine A Okoro, NaTasha D. Hollis, Alissa Cyrus … (2018)
- Record: found
- Abstract: found
- Article: found