- Record: found
- Abstract: found
- Article: found
Epidemiological and virological characteristics of seasonal influenza in the Western Pacific Region of the World Health Organization, 2011–2015
other
Members of the WHO Western Pacific Region Global Influenza Surveillance and Response System
a
28 March 2017
Read this article at
There is no author summary for this article yet. Authors can add summaries to their articles on ScienceOpen to make them more accessible to a non-specialist audience.
Abstract
Introduction
Seasonal influenza is an acute viral infection that causes annual epidemics. The World
Health Organization (WHO) estimates that the global disease burden of seasonal influenza
is approximately one billion cases annually resulting in up to 500 000 deaths. (
1
) Epidemics are well defined as seasonal in northern and southern temperate climates
with annual epidemics occurring in late winter or early spring. (
2
) In contrast, seasonal patterns in tropical and subtropical regions are less clear
and tend to show more consistent levels of transmission year-round. (
3
,
4
)
The Western Pacific Region (WPR) of WHO comprises 37 diverse countries and areas with
temperate and tropical climates inhabited by approximately 1.8 billion people in 2016.
(
5
) Therefore, influenza is consistently circulating in variable locations in the Region.
Collection and analysis of influenza surveillance data in WPR is particularly important
due to evidence that novel influenza may emerge from persistent influenza reservoirs
in the tropics and then spread to temperate regions. (
4
) A more comprehensive understanding of virological characteristics of influenza in
this Region will contribute to improved predictions of emerging global influenza trends.
For example, there is evidence that between 2002 and 2007 influenza viruses originating
in several tropical WPR nations seeded seasonal A(H3N2) epidemics in temperate zones.
(
6
)
The Global Influenza Surveillance and Response System (GISRS) is a WHO network that
monitors global impact of influenza and evaluates potential pandemic risk of emerging
strains. (
7
) GISRS also provides recommendations regarding viral strains in seasonal influenza
vaccines, laboratory diagnostics and antiviral susceptibility. GISRS comprises 143
National Influenza Centres (NICs), six WHO collaborating centres (CCs), four Essential
Regulatory Laboratories and other ad hoc laboratories. The WHO WPR has 21 NICs, three
WHO CCs and two Essential Regulatory Laboratories. The NICs process thousands of specimens
yearly of which a subset is sent to WHO CCs. (
8
) FluNet is a global platform that allows NICs and other GISRS-affiliated laboratories
to upload virological information regarding number of specimens tested and resulting
type, subtype and lineage. (
9
) It has been used in WPR since 1996. FluID, currently in a pilot phase, is a platform
for sharing country epidemiological data that includes influenza-like illness (ILI)
consultations by age group, total number of outpatients and total number of surveillance
sites. (
10
)
Embedding influenza surveillance strategies within the Asia Pacific Strategy for Emerging
Diseases (APSED) framework has supported significant advances in WPR influenza capacity.
(
11
) Advances include improved surveillance systems, increased laboratory capacity and
greater rates of reporting to FluNet. (
12
) An evaluation of the Region between 2006 and 2010 indicated increased sample submission
and reporting through regional systems, particularly in response to the 2009 A(H1N1)pandemic.
(
12
) In light of continued efforts to enhance influenza surveillance in the Region, this
review provides an updated description of regional influenza surveillance systems
focused on the epidemiological and virological characteristics of seasonal influenza.
This review updates the results from the previous 2012 review, (
12
) considers how recommendations regarding surveillance strategy improvements have
been implemented in the Region and discusses suggested future steps.
Methods
Data collection
Influenza surveillance data for 2011 to 2015 were collected from the 15 countries
and areas with NICs in the WPR: Australia, Cambodia, China (including Hong Kong Special
Administrative Region SAR), Fiji, Japan, the Lao People's Democratic Republic, Malaysia,
Mongolia, New Caledonia (France), New Zealand, Papua New Guinea, the Philippines,
the Republic of Korea, Singapore and Viet Nam.
Virological surveillance data included number of specimens collected, tested and influenza
positive subtypes and lineages. These data were extracted from FluNet and confirmed
by NIC focal points.
Descriptive and epidemiological data were collected from NICs via questionnaires developed
in Microsoft Excel®. Questionnaires of descriptive surveillance system data and epidemiological
data were collected from December 2015 through August 2016. The data collected included
descriptive surveillance system information such as ILI case definitions and the numbers
and descriptions of active surveillance sites as of 31 December 2015. Epidemiological
data, including number of ILI cases by age group and geographic location of surveillance
sites, were collected.
Data analysis
Country-specific information on ILI surveillance systems, site numbers and case definitions
were extracted from submitted questionnaires and compiled.
Virological and epidemiological data reported by epidemiologic week were combined
into data per month. Data were graphed and grouped into four regions according to
location and similarities in influenza patterns and to allow comparison with previously
reported trends. (
12
) The groups were: (A) Northern temperate (Mongolia and the Republic of Korea); (B)
China (including Hong Kong Special Administrative Region SAR); (C) Tropical (Cambodia,
the Lao People's Democratic Republic, Malaysia, the Philippines, Singapore and Viet
Nam); and (D) Southern (Australia, Fiji, New Caledonia (France), New Zealand and Papua
New Guinea). When data were available, per cent ILI consultations were determined
by taking monthly ILI consultations divided by total monthly consultations. Proportions
for each group were calculated by adding ILI consultations or positive cases and dividing
by total consultations or total specimens tested, respectively. Per cent positive
data and total positive samples were also analysed by subtype and lineage, that is,
A(H1), A(H3), A(other) and influenza B by year. Positive specimens from Japan were
included in regional number of influenza positive cases.
Results
Surveillance systems
All 15 countries and areas reported data to FluNet during the reporting period. All
countries and areas had ILI surveillance systems with variations in ILI case definition,
type of surveillance systems and number of reporting sites (
Table 1
). At the time of reporting, Mongolia used the 2014 WHO case definition of acute respiratory
infection with measured fever of ≥ 38 °C and cough with onset within the last 10 days.
(
13
) Hong Kong Special Administrative Region SAR, Malaysia, Papua New Guinea, the Philippines
and Viet Nam used the previous WHO ILI case definition of sudden onset of fever of
> 38 °C and cough or sore throat in the absence of other diagnosis. (
13
) The others reported case definitions that required additional respiratory symptoms
or a modified time frame of symptom onset. Minor case definition differences were
reported among various ILI surveillance sites within Australia, Cambodia, Hong Kong
Special Administrative Region SAR and New Zealand.
Table 1
Outpatient surveillance systems and case definitions, 2011–2015
Country
Surveillance system
ILI case definition
Australia
242 GPs and 69 EDs
Fever (≥ 38 °C), cough and fatigue (some within four days of presentation)
Community online data collection and national call centre network
Cough and fever
Cambodia
7 hospitals
Sudden onset of fever ≥ 38 °C axillary within 5 days of presentation and fever at
time of presentation, cough and/or sore throat in absence of other diagnosis
3 health facilities
Sudden onset of fever ≥ 38 °C axillary and fever at time of presentation, cough and/or
sore throat in absence of other diagnosis
China
562 hospitals and 408 network laboratories
Sudden onset of fever of > 38 °C and cough or sore throat
China, Hong Kong Special Administrative Region SAR
17 EDs
Cases with clinical diagnosis related to influenza, upper respiratory tract infection,
fever, cough, sore throat or pneumonia
64 outpatient clinics, about 50 GPs, 30 TCM clinics
Prior WHO definition*
Fiji
5 sentinel sites
Sudden onset of fever of > 38 °C plus cough and/or sore throat
Japan
Approximately 5 000 sentinel health facilities (approximately 3 000 paediatric and
2000 internal medicine health-care facility sites)
1) All of the following: sudden onset, high fever, upper respiratory tract inflammation,
general malaise or other systemic symptoms, OR: 2) confirmation based on rapid diagnostic
kit (regardless of symptoms).
Lao People's Democratic Republic
8 hospitals
Acute respiratory infection with fever of ≥ 38 °C and cough, with onset within last
7 days
Malaysia
239 sentinel outpatient sites
Prior WHO definition*
Mongolia
115 sentinel sites
2014 WHO definition**
New Zealand
Approximately 200 GPs
An acute respiratory tract infection with abrupt onset of at least two of the following:
fever, chills, headache and myalgia
Call centre network
One of 18 symptoms
Papua New Guinea
2 hospitals
Prior WHO definition*
Philippines
18 sites
Prior WHO definition*
Republic of Korea
200 sentinel clinics
Sudden onset of fever of > 38 °C and cough or sore throat
Singapore
18 polyclinics, 99 GPs
An acute respiratory infection with measured fever of ≥ 38 °C and cough or sore throat;
with onset within the last 10 days
Viet Nam
Hanoi
15 sentinel hospitals
Prior WHO definition*
Ho Chi Minh City
5 sentinel hospitals
Prior WHO definition*
*Prior WHO definition: a person with sudden onset of fever of > 38 °C and cough or
sore throat in the absence of other diagnosis
**2014 WHO definition: acute respiratory infection with measured fever of ≥ 38 °C
and cough; with onset within the last 10 days
ED: emergency department; GP: general practitioner; TCM: traditional Chinese medicine
Note: no data provided for New Caledonia (France)
Virological and epidemiological characteristics
For ILI patients that met the country case definition, the method for selecting cases
for specimen collection varied among countries. Most commonly a set number of cases
per week were selected for testing. All countries and areas also used various laboratory
testing methodologies for influenza and subtype confirmation, including rapid test,
reverse transcription polymerase chain reaction (RT–PCR), serology and virus culture.
The number of reported specimens tested for influenza between 2011 and 2015 tripled
(
Table 2
), with over two million specimens reported to FluNet from WPR. Of positive specimens
reported to FluNet from WPR, over 70% of the specimens were from China followed by
Japan (11%) and Australia (5%). During this time period, 13% (n = 293 501) of processed
specimens from countries and areas that submitted data on number of specimens tested
were positive for influenza virus, with a yearly variation from 9% to 17% positive.
Table 2
Specimens tested and specimens positive for influenza by type/subtype/lineage in Western
Pacific Region countries, 2011–2015
-
2011*
2012**
2013**
2014**
2015***
Number of specimens tested
217 975
339 229
456 918
583 004
652 124
Number of influenza positive specimens
24 382 (11.2%)
58 430 (17.2%)
42 251 (9.2%)
86 884 (14.9%)
81 554 (12.5%)
Seasonal influenza-positive specimens by type/subtype/lineage
Influenza A total
14 994
31 617
33 921
63 301
55 471
A(H1)
10 487
963
15 855
22 909
4598
A(H3)
3460
28 542
17 064
38 519
50 588
A(other)
1039
2101
975
1862
1710
Influenza B total
9387
26 813
8309
23 556
26 136
B(Victoria)
728
8911
451
704
1368
B(Yamagata)
468
3837
1867
8641
16 593
B(lineage not determined)
8191
14 065
5991
14 211
8476
Note: total number of influenza positive specimens includes seasonal and non-seasonal
influenza subtypes while influenza positive specimens by type/subtype/lineage includes
only seasonal influenza
* 2011: Data from Australia, Cambodia, China, Fiji, the Lao People's Democratic Republic,
Mongolia, Malaysia, New Caledonia (France), New Zealand, the Philippines, the Republic
of Korea, Singapore and Viet Nam
** 2012–2014: Data from 2011 countries plus Hong Kong Special Administrative Region
SAR
*** 2015: Data from 2012–2014 countries plus Papua New Guinea
Epidemiologic data were provided by 12 countries and areas. Fiji, New Caledonia, New
Zealand and Papua New Guinea provided total number of weekly ILI consultations. Hong
Kong Special Administrative Region SAR provided weekly ILI consultation rates per
1000 consultations by type of surveillance system (for example, general practitioners
or traditional Chinese medicine practitioners). Australia, Cambodia, China, the Lao
People's Democratic Republic, Malaysia, Mongolia, Singapore and Viet Nam provided
data on number of ILI cases and total consultations.
Between 2011 and 2015, peaks in per cent ILI were generally consistent with per cent
positive trends, particularly in the northern temperate and southern zones (
Fig. 1
). In Mongolia and the Republic of Korea, per cent ILI and per cent positive followed
a northern temperate trend with yearly seasonal peaks occurring in the winter between
January and March (Panel A,
Fig. 1
). Japan also exhibited the temperate northern hemisphere seasonality with distinct
peaks in number of positive specimens seen at the beginning of each year (January
or February). China (including Hong Kong Special Administrative Region SAR) demonstrated
a bimodal influenza season with peak influenza activity between January and March
consistent with the northern temperate season and secondary peaks occurring in June
or July in some years (Panel B,
Fig. 1
). Seasonal trends were less evident for countries in the tropical region with occasional
peaks several times a year. In 2014–2015, a peak around July appears to correspond
with the secondary peak seen in China (including Hong Kong Special Administrative
Region SAR) (Panels B and C,
Fig. 1
). The southern zone showed evidence of seasonal influenza transmission with highest
levels of positive specimens and per cent ILI consultations reported between July
and September each year (Panel D,
Fig. 1
).
Fig. 1
Proportion of specimens positive for influenza virus and proportion of consultations
meeting influenza-like-illness (ILI) case definition by subregion within the Western
Pacific Region, 2011–2015
Panel A: Northern temperate (% positive from Mongolia and the Republic of Korea and%
ILI from Mongolia (2011–2014)); Panel B: China and Hong Kong Special Administrative
Region SAR (% positive from China and Hong Kong Special Administrative Region SAR
and% ILI from China); Panel C: Tropics (% positive from Cambodia, the Lao People's
Democratic Republic, Malaysia, the Philippines, Singapore and Viet Nam and% ILI from
Cambodia (2011–October 2015), the Lao People's Democratic Republic (2011–September
2015), Malaysia (2011–November 2015), Singapore (2011–2015) and Viet Nam (January–November
2015)); Panel D: Southern zone (% positive from Australia, Fiji, New Caledonia (France),
New Zealand, Papua New Guinea and% ILI from Australia)
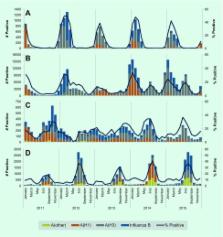
Influenza A was the predominant influenza type reported across all five years, for
the entire WPR and by zone (
Table 2
and
Fig. 2
). In 2011, influenza virus A(H1) predominantly circulated during the first half of
the year followed by B (lineage not determined) later in the year (
Table 2
and
Fig. 2
). In 2012, influenza B continued to circulate into the beginning of 2012 until influenza
A(H3) began to predominate for the remainder of the year. From 2012 to 2015, the subtype
A(H3) accounted for the largest proportion of the total influenza samples – ranging
from 40% to 62%. From 2012 to 2015, A(H3) was the most frequently reported influenza
subtype while secondary influenza subtypes and lineages varied during this time.
Fig. 2
Number of influenza viruses by type/subtype and proportion of specimens positive for
influenza virus in Western Pacific Region, 2011–2015
Panel A: Northern temperate (Mongolia and Republic of Korea); Panel B: China and Hong
Kong Special Administrative Region SAR; Panel C: Tropics (Cambodia, Lao People's Democratic
Republic, Malaysia, the Philippines, Singapore and Viet Nam); Panel D: Southern zone
(Australia, Fiji, New Caledonia (France), New Zealand, and Papua New Guinea)
Discussion
All countries and areas with NICs in WPR exhibited expected seasonal influenza prevalence
and trends from 2011 to 2015. Advances in surveillance systems and laboratory capacity
have been well documented over the past 10 years. There was a 10-fold increase in
the number of ILI specimens tested between 2006 and 2015, driven predominately by
increases in data submissions from China (including Hong Kong Special Administrative
Region SAR). (
12
) This increase was likely due in part to increased awareness of the importance of
specimen collection and submission following the A(H1N1) 2009 pandemic. (
12
) These data improve regional understanding of circulating viral subtype seasonal
trends despite variations in laboratory and surveillance systems, case definitions
and number of surveillance sites.
All 15 countries and areas surveyed have sentinel influenza surveillance systems in
place. Since the last regional overview, ILI case definitions and number of surveillance
sites have changed within many countries included in this review (see
Table 3
). The previous regional overview (2006–2010) reported that eight countries and areas
used the WHO case definition. (
12
) In 2014, the official WHO case definition for ILI changed from sudden onset of fever
of > 38 °C and cough or sore throat to a new case definition that removed sore throat
from the definition and required symptom onset within 10 days of presentation. (
13
) In 2015, one country used the 2014 WHO case definition, five countries and areas
reported the use of the previous WHO case definition, and the other countries reported
use of alternatives (see
Table 1
). As changes in case definition have been shown to impact the sensitivity and positive
predictive value of ILI sentinel surveillance, this should be taken into consideration
when interpreting these results. (
13
)
Table 3
ILI case definitions and surveillance systems in the Western Pacific Region, 2006–2010
compared to 2011–2015
Year
Country
Surveillance system
ILI case definition
2006–2010
Australia
Approximately 25 GP clinics
Fever (≥ 38 °C), cough and fatigue
69 EDs
Fever (≥ 38 °C) or feverish plus at least one of the following symptoms: cough or
sore throat
Community online data collection
Cough and fever
2011–2015
242 GPs and 69 EDs
Fever (≥ 38 °C), cough and fatigue (some within four days of presentation)
Community online data collection and national call centre network
Cough and fever
2006–2010
Cambodia
8 hospitals
Sudden onset of fever of > 38 °C and cough or sore throat within 5 days
2011–2015
7 outpatient department hospitals
Sudden onset of fever ≥ 38 °C axillary within 5 days of presentation and fever at
time of presentation, cough and/or sore throat in absence of other diagnosis
3 health facilities
Sudden onset of fever ≥ 38 °C axillary and fever at time of presentation, cough and/or
sore throat in absence of other diagnosis
2006–2010
China
2010: 556 sentinel hospitals and 411 network laboratories
Sudden onset of fever of > 38 °C and cough or sore throat
2011–2015
562 hospitals and 408 network laboratories
As above
2006–2010
Hong KongSAR
114 public and private outpatient clinics
Prior WHO definition*
2011–2015
17 EDs
Cases with clinical diagnosis related to influenza, upper respiratory tract infection,
fever, cough, sore throat or pneumonia
64 outpatient clinics, 50 GPs, 30 TCM clinics
Prior WHO definition*
2006–2010
Fiji
13 sentinel hospitals
Prior WHO definition*
2011–2015
5 sentinel sites
Sudden onset of fever of > 38 °C plus cough and/or sore throat
2006–2010
Japan
3000 paediatric and 2000 internal medicine sites
Sudden onset of fever of > 38 °C, upper respiratory infection and feeling tired
2011–2015
Approximately 5 000 sentinel health facilities (approximately 3 000 paediatric and
2000 internal medicine health care facility sites)
1) All of the following: sudden onset, high fever, upper respiratory tract inflammation,
general malaise or other systemic symptoms, OR: 2) confirmation based on rapid diagnostic
kit (regardless of symptoms).
2006–2010
Lao People's Democratic Republic
8 hospitals
Prior WHO definition*
2011–2015
8 hospitals
Acute respiratory infection with fever of ≥ 38 °C and cough, with onset within last
7 days
2006–2010
Malaysia
Approximately 600 government health clinics
Prior WHO definition*
2011–2015
239 sentinel outpatient sites
Prior WHO definition*
2006–2010
Mongolia
37 hospitals and 121 health centres
Prior WHO definition*
2011–2015
115 sentinel sites
New WHO definition**
2006–2010
New Caledonia (France)
2 hospitals and 7 health centres
Sudden onset of fever ≥ 38 °C (or shiver if temperature not available) and cough (or
sore throat)
2006–2010
New Zealand
Approximately 101 sentinel GPs operating May–September
An acute respiratory tract infection with abrupt onset of at least two of the following:
fever, chills, headache and myalgia
2011–2015
Approximately 200 GPs
As above
Call centre network
One of 18 symptoms
2011–2015
Papua New Guinea
2 hospitals
Prior WHO definition*
2006–2010
Philippines
59 health centres and hospitals
Fever of > 38 °C and cough or sore throat. For children ≤ 3 years, fever of > 38 °C
and cough, sore throat or runny nose
18 sites
Prior WHO definition*
2006–2010
Republic of Korea
Approximately 800 sentinel sites
Sudden onset of fever of > 38 °C and cough or sore throat
2011–2015
200 sentinel clinics (since 2013)
Sudden onset of fever of > 38 °C and cough or sore throat
2006–2010
Singapore
18 government clinics, 98 GP clinics
Prior WHO definition*
2011–2015
18 polyclinics, 99 GPs
An acute respiratory infection with measured fever of ≥ 38 °C and cough or sore throat;
with onset within the last 10 days
2006–2010
Viet Nam
Hanoi
15 sentinel hospitals
Prior WHO definition*
Ho Chi Minh City
5 sentinel hospitals
Prior WHO definition*
2011–2015
Hanoi
15 sentinel hospitals
Prior WHO definition*
Ho Chi Minh City
5 sentinel hospitals
Prior WHO definition*
* Prior WHO definition: a person with sudden onset of fever of > 38 °C and cough or
sore throat in the absence of other diagnosis
**New WHO definition: acute respiratory infection with measured fever of > 38 °C and
cough; with onset within the last 10 days
ED: emergency department; GP: general practitioner; TCM: traditional Chinese medicine
Note: no data provided for New Caledonia (France) 2011–2015
The proportion of outpatient visits for ILI followed expected trends in the northern
temperate zone, China (including Hong Kong Special Administrative Region SAR) and
the southern zone, with peak consultations occurring during the same months as peak
per cent positive specimens (
Fig. 1
). Per cent ILI in the tropical zone was low and consistent throughout the year. Seasonal
trends in circulating virus identified predictable temperate zone peaks and consistent
tropical circulation similar to the previous regional overview. (
12
) However, in 2014 and 2015, both China (including Hong Kong Special Administrative
Region SAR) and the tropics appear to exhibit more distinct seasonal patterns with
a bimodal distribution in China (including Hong Kong Special Administrative Region
SAR) and occasional sharp peaks in the tropics (Panels B and C,
Fig. 2
).
Improvements in tropical indicator-based surveillance for ILI over recent years indicate
that more definitive determination of tropical seasonality may be possible in the
near future. For example, in the American tropics a recent study has shown that 13
out of 16 countries in that region experience peak influenza transmission between
April and September with smaller secondary epidemics. (
14
) The observed peaks were not as distinct as those found in temperate regions; however,
initial patterns of predictable seasonality emerged. This evidence of influenza seasonality
illustrates the importance of strong outpatient indicator-based surveillance systems
and reporting for determining seasonality which may impact vaccine policy.
The 2012 report recommended advancement of the following three areas of influenza
surveillance: (a) improving virological testing capacity, (b) improving communication
through regional and global networks, and (c) defining regional burden of disease.
(
12
) Advances were documented in all three areas. Virological testing capacity continues
to be strengthened. The number of reported virological tests conducted on influenza
specimens has steadily increased from 65 103 specimens in 2006 to 307 584 in 2010
(
12
) and 652 124 in 2015; some countries showed slight decreases in the amount of data
submitted as they continue to optimize their surveillance systems. Although the increase
in number of samples over time does not necessarily constitute system improvement,
consistent specimen submission does indicate both improved capacity and continued
viability of the system itself. Evidence from the WHO external quality assessment
programme shows an increase in the number of laboratories in the Region participating
in the programme and consistently good results from participating laboratories (personal
communication). Continued efforts placed on quality laboratory testing will ensure
an accurate understanding of influenza in the Region.
Communication in the Region and globally continues to improve with increased reporting
by NICs to FluNet. Other platforms such as the biweekly influenza situation updates
published by the WHO Western Pacific Regional Office and periodic journal articles
illustrate how communication and collaboration within the Region is prioritized. Using
data visualization technologies, an online regional influenza dashboard is under way
to integrate laboratory and epidemiological data in near real-time and provide a more
complete picture of regional influenza activity. Finally, significant progress in
regional risk communication capacity in response to recent emerging events (for example
influenza A(H7N9) in China, 2013 and Zika, 2016) also benefits influenza surveillance
and response efforts. (
15
)
Influenza surveillance in the Region continues to advance, and efforts to determine
burden of disease are ongoing. WHO guidelines recommend assessing burden from acute
lower respiratory infection and/or severe acute respiratory infection surveillance.
(
16
) Several WPR countries, including Cambodia, the Lao People's Democratic Republic,
Mongolia and Viet Nam, have begun burden of disease estimates including sentinel site
catchment population determination. These estimates will contribute to national, regional
and global burden estimates and may support consideration of vaccination in high-risk
populations.
Conclusions and way forward
Successful collaborative efforts between 2011 and 2015 continue to outline influenza
epidemiological and virological characteristics in WPR and improve data to support
ongoing public health action. A geographically wide range of influenza circulation
patterns, covered by an extensive outpatient surveillance network, indicated temperate
and tropical trends similar to those reported previously. Moving forward, WPR countries
and areas are encouraged to focus on continued virus sharing through global networks
while strengthening event-based surveillance, risk assessment and decision-making
capacities. In addition, prioritization of high-quality, representative surveillance
data of both outpatient and hospitalized respiratory disease will allow, respectively,
improved appreciation of seasonality and economic burden of disease estimates. Finally,
such estimates will support national influenza vaccination policies in high-risk groups.
Advances in these areas will allow the Region to remain vigilant in the face of the
continued, unpredictable influenza threat and further support the critical use of
influenza vaccines in vulnerable populations.
Related collections
Most cited references6
- Record: found
- Abstract: found
- Article: not found
Global Patterns in Seasonal Activity of Influenza A/H3N2, A/H1N1, and B from 1997 to 2005: Viral Coexistence and Latitudinal Gradients
Brian Finkelman, Cecile Viboud, Katia Koelle … (2007)
- Record: found
- Abstract: found
- Article: not found
Epidemiological, antigenic and genetic characteristics of seasonal influenza A(H1N1), A(H3N2) and B influenza viruses: basis for the WHO recommendation on the composition of influenza vaccines for use in the 2009-2010 northern hemisphere season.
Ian Barr, John F. McCauley, Nancy Cox … (2010)

- Record: found
- Abstract: found
- Article: found