- Record: found
- Abstract: found
- Article: not found
Not all nuclear pores created equal
news

Publication date (Print):
4 October 2010
Journal:
The Journal of Cell Biology
Publisher:
The Rockefeller University Press
Read this article at

There is no author summary for this article yet. Authors can add summaries to their articles on ScienceOpen to make them more accessible to a non-specialist audience.
Abstract
Pore-making process isn't identical in interphase and mitosis.
Abstract
Pore-making process isn't identical in interphase and mitosis.
Related collections
Most cited references4
- Record: found
- Abstract: found
- Article: not found
Cell cycle-dependent differences in nuclear pore complex assembly in metazoa.
In metazoa, nuclear pore complexes (NPCs) assemble from disassembled precursors into a reforming nuclear envelope (NE) at the end of mitosis and into growing intact NEs during interphase. Here, we show via RNAi-mediated knockdown that ELYS, a nucleoporin critical for the recruitment of the essential Nup107/160 complex to chromatin, is required for NPC assembly at the end of mitosis but not during interphase. Conversely, the transmembrane nucleoporin POM121 is critical for the incorporation of the Nup107/160 complex into new assembly sites specifically during interphase. Strikingly, recruitment of the Nup107/160 complex to an intact NE involves a membrane curvature-sensing domain of its constituent Nup133, which is not required for postmitotic NPC formation. Our results suggest that in organisms with open mitosis, NPCs assemble via two distinct mechanisms to accommodate cell cycle-dependent differences in NE topology. Copyright 2010 Elsevier Inc. All rights reserved.
- Record: found
- Abstract: found
- Article: found
Live imaging of single nuclear pores reveals unique assembly kinetics and mechanism in interphase
Elisa Dultz, Jan Ellenberg (2010)
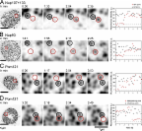
Introduction Nuclear pore complexes (NPCs) are multiprotein channels that span the two membranes of the nuclear envelope of eukaryotic cells. The assembly of these large protein complexes requires coordination of several hundred individual proteins and the stabilization of highly curved membranes. In metazoa, new NPCs form at two different cell cycle stages: at the end of mitosis concomitant with the reformation of the nuclear envelope and during interphase (Antonin et al., 2008). Postmitotic NPC assembly is thought to be regulated by the phosphorylation of several nucleoporins by mitotic kinases (Onischenko et al., 2005; Glavy et al., 2007) as well as by the small GTPase Ran and its counterplayer importin-β. Importin-β binds to several nucleoporins during mitosis, and their release by RanGTP in the vicinity of chromatin is crucial for postmitotic NPC assembly (Walther et al., 2003b). Assembly is initiated by the Nup107–160 complex in early anaphase, when it binds to chromatin via its DNA-binding subunit embryonic large molecule derived from yolk sac (ELYS)/Mel28 (Franz et al., 2007). This complex is essential for pore formation, and pore-free nuclei form in its absence in Xenopus laevis egg extract (Harel et al., 2003; Walther et al., 2003a; Franz et al., 2007; Gillespie et al., 2007). The association of membrane nucleoporins (Pom121) with the newly forming pores is the second phase of NPC assembly, followed by addition of the Nup93 and Nup62 complexes and finally more peripheral nucleoporins (Bodoor et al., 1999; Haraguchi et al., 2000; Dultz et al., 2008). Although many of the mechanistic interactions remain to be understood, the order and timeline of events that lead to the formation of NPCs after mitosis are thus rather well defined. By comparison, the process of NPC assembly in interphase in metazoan cells is poorly characterized and has only recently become the focus of research (D’Angelo et al., 2006; Doucet et al., 2010; Iino et al., 2010). Although assembly during both phases of the cell cycle is thought to produce indistinguishable pores, and some of the regulatory requirements such as activity of the small GTPase Ran are conserved between interphase and mitosis (Walther et al., 2003b; D’Angelo et al., 2006; Iino et al., 2010), the assembly takes place under fundamentally different conditions. At the end of mitosis, a large number of NPCs assemble simultaneously. NPC assembly is initiated on naked chromatin and occurs concomitant with the reformation of the nuclear envelope, and the cytoplasm is in the biochemical state of mitotic exit with significant remaining mitotic kinase activity. In contrast, interphase assembly events are singular and rare. NPC insertion into the closed nuclear envelope requires fusion between inner and outer nuclear membranes, and there is no mitotic kinase activity in the cytoplasm. A very recent study has also reported molecular differences in the requirements of some nucleoporins for the two assembly processes (Doucet et al., 2010). ELYS, which mediates the interaction of the Nup107–Nup133 complex with chromatin, appears dispensable for interphase assembly. On the other hand, the membrane nucleoporin Pom121 as well as a membrane association domain of Nup133 were found to be required. Here, we have, for the first time, analyzed the dynamics of NPCs throughout the entire interphase of mammalian cells by live cell microscopy. We show that nuclear growth and NPC assembly are correlated and occur continuously throughout interphase, leading to an almost constant overall NPC density throughout the cell cycle. In addition, we define the kinetics of individual NPC assembly events in interphase. We demonstrate that NPC assembly in interphase is considerably slower than during postmitotic assembly and that the nucleoporin subcomplexes are added in a different order. These findings support the conclusion that NPC assembly at the end of mitosis and in interphase occurs via distinct mechanisms. Results and discussion We first asked when during interphase new NPCs are assembled in mammalian cells. Individual normal rat kidney (NRK) cells stably expressing the membrane nucleoporin Pom121 tagged with EGFP (previously characterized in Rabut et al., 2004; Dultz et al., 2008) were tracked from mitosis to mitosis, and high resolution confocal images of the bottom surface of their nuclei were acquired every 1–2 h (Fig. 1 A). Low sampling frequency ensured that the cells were not disturbed in their cell cycle progression and minimized photobleaching. NPC densities measured on the bottom and top surfaces of individual nuclei were indistinguishable (P = 0.4 for paired t test), and the bottom surface of the nucleus was therefore assumed to be representative for the entire nucleus. NPC density was ∼6–7 NPCs/µm2 throughout interphase with a slight but significant decrease of the mean density from 6.9 ± 0.7 NPCs/µm2 in early G1 to 6.4 ± 0.8 NPCs/µm2 in late G2 (n = 11 and P = 0.02 for paired t test; Fig. 1 C). This observation is in contrast to a previous study in HeLa cells in which the NPC density increases from G1 to G2 (Maul et al., 1972). Figure 1. NPC density and nuclear growth during interphase. (A) An NRK cell stably expressing Pom121-3EGFP was tracked throughout the entire cell cycle. The signal from NPCs on the bottom surface of the nucleus is shown in inverted grayscale. Times relative to the first observed mitosis are indicated. (B) Individual landmark NPCs were tracked, and the area between them was measured as indicated. Overlay of the measured areas (right) illustrates the overall increase in area during the observation time. (C) NPC density through the cell cycle of individual cells (black). Each curve was fitted with a linear function using the least squares method, and the mean fit is shown in red (gray shading, SD of fit parameters). (D) Growth of nuclear surface area between tracked NPCs (n = 8). The area was normalized to the first time point, and each curve was fitted with a single exponential to derive the mean growth (red; gray shading, 95% confidence interval). To estimate at what rate new NPCs form during the cell cycle, we next measured the growth of the nuclear surface during interphase. Because NPCs are anchored in the nuclear lamina and do not move relative to each other in the plane of the nuclear envelope (Daigle et al., 2001), individual NPCs can be tracked over long intervals. Measuring the area between tracked NPCs (Fig. 1, B and D), we determined the growth rate of the nuclear surface to be 3.9 ± 0.7% per hour (24 cells from four independent experiments). We also independently determined the growth rate of the entire nucleus by imaging NRK cells expressing fluorescent nuclear markers and reconstructing the nuclear volume (Fig. S1). The growth rate of the nuclear surface area determined in this manner was 4.1 ± 1.4% per hour (24 cells from four independent experiments), which is indistinguishable from the growth rate of the bottom surface measured by pore tracking (P = 0.7 for unpaired t test). This indicates that nuclear growth occurs homogenously over the entire surface of the nucleus. Interestingly and in agreement with previous observations (Maul et al., 1973), nuclear growth was independent of DNA replication because treatment with aphidicolin to inhibit DNA polymerase did not affect nuclear growth rates while effectively blocking cells at the G1/S boundary (Fig. S1). The NPC density and nuclear surface area measurements allowed us to calculate the number of NPCs on the nucleus during the cell cycle. Our data predict a continuous increase in the number of NPCs throughout interphase with 60–80 new NPCs forming per nucleus in 1 h. Nuclei of NRK cells had 1,960 ± 390 NPCs in early G1 and 2,830 ± 740 NPCs in late G2. We did not detect a phase of higher NPC formation rate during early S phase as reported for HeLa S3 cells (Maul et al., 1972). Our data indicate that the total number of NPCs at the end of G2 does not account for all NPCs formed in both daughter nuclei by early G1. Postmitotic NPC assembly therefore either has to rely on preexisting nucleoporin pools that were not assembled into NPCs in the preceding interphase or nucleoporins newly synthesized immediately after mitosis. Previous work in fixed cells showed an approximate doubling of NPC numbers from ∼2,000 in G1 to ∼4,000 in G2 in HeLa cells (Maul et al., 1972). The differences in our findings are likely a result of variations between different cell lines in NPC assembly during interphase, which may be related to cell cycle length and metabolic rates. In our long-term high resolution observations of NPCs on the nuclei of individual cells (Fig. 1 A), new NPCs appearing between preexisting ones could be identified. We next wanted to determine whether interphase assembly occurred with the same kinetics as postmitotic assembly. Our recent characterization of the kinetics of postmitotic NPC assembly in the same cell type (Dultz et al., 2008) provided a quantitative basis for a direct comparison. To determine the kinetics with which individual new NPCs are assembled from their subcomplexes in interphase, NPCs of cells expressing GFP-tagged nucleoporins were imaged on the bottom surface of the nucleus. In agreement with previous work (D’Angelo et al., 2006), we observed new NPC assembly events at previously pore-free sites independent of the position of preexisting NPCs (Fig. 2) and could not find any evidence for “pore-splitting” events in our analysis of a total of ∼150 single NPC assembly events. Figure 2. Assembly of individual new NPCs in interphase. (A–C) Time series showing the assembly of individual NPCs labeled by members of different NPC subcomplexes: (A) Nup107–160 complex labeled by 3EGFP-Nup107 and 3EGFP-Nup133; (B) Nup93 complex labeled by Nup93-3EGFP; and (C) Pom121-3EGFP. (D) Time series showing the disappearance of an NPC labeled with Pom121-3EGFP. Red boxes on overview image indicate region of magnification. Circles highlight measured NPCs (red, new/disappearing NPC; black, old/reference NPC). Plots show background-subtracted and bleaching-corrected fluorescence intensities. For presentation purposes, images were smoothed with a Gaussian blur filter, kernel 1.5. We first analyzed the assembly kinetics of two major soluble NPC subcomplexes, the Nup107–160 complex (represented by GFP fusions of Nup107 and Nup133) and the Nup93 complex (represented by GFP fusion of Nup93). The Nup107–160 complex is essential for NPC formation both after mitosis and in interphase (Walther et al., 2003a; D’Angelo et al., 2006). We observed that the accumulation of the Nup107–160 complex at sites of new NPC assembly from background nuclear envelope levels to levels comparable to neighboring preexisting pores was completed within ∼15 min (Fig. 2 A). Similar results were found for the Nup93 complex (Fig. 2 B), which is also essential for correct NPC assembly and provides interaction between soluble and transmembrane components of the NPC (Mansfeld et al., 2006; Hawryluk-Gara et al., 2008). Fitting of the assembly kinetics with a sigmoid function allowed us to determine characteristic assembly times. These were not significantly different for the Nup107–160 complex and Nup93 with 12 ± 8 min (n = 21) and 9 ± 10 min (n = 14), respectively (P = 0.2 for unpaired t test; Fig. 3, A and B), indicating that these two essential soluble NPC subcomplexes assemble into NPCs with similar kinetics. Figure 3. Kinetics of NPC assembly in interphase. (A) Plots of NPC assembly kinetics. Curves were aligned after fitting with the sigmoid function along the half-maximal intensity. All measured data points are displayed in gray. Colored lines show a sigmoid curve with the mean characteristic time. Inset boxes represent individual fits for the examples shown in Fig. 2. (B) Boxplot of characteristic times for sigmoid fit. Boxes indicate 25% and 75% quartiles, red lines show median, and outliers are indicated by crosses. Blue lines show the median of corresponding mitotic fits (compare with C). The data in A and B were derived from seven, four, and seven cells for Pom121, Nup107, and Nup93, respectively. (C) Assembly curves for postmitotic NPC assembly (Dultz et al., 2008) were fitted with sigmoid curves for comparison (Fig. S2). P-values are for unpaired t tests. We then measured the assembly kinetics of the integral membrane nucleoporin Pom121, which is also essential for NPC assembly (Antonin et al., 2005). In contrast to the relatively rapidly assembling soluble components, the majority of NPC assembly events observed for Pom121 were characterized by a gradual accumulation process that could last several hours before the newly forming NPCs reached similar intensities as neighboring preexisting NPCs (Fig. 2 C). The characteristic assembly time determined for Pom121 was 29 ± 15 min (n = 28). Interestingly, a high variability in the assembly kinetics of Pom121 between individual newly assembling NPCs was apparent (range of characteristic assembly time from first to third quartile was 15–44 min; Fig. 3, A and B). We occasionally observed fast events also for Pom121 consistent with an individual rapid NPC formation event reported previously for this nucleoporin (D’Angelo et al., 2006). Overall, the NPC assembly process during interphase is thus significantly slower than after mitosis, in which all NPCs of the daughter nucleus form within ∼10 min (Dultz et al., 2008). We were able to directly compare the kinetics between interphase and postmitotic assembly by fitting our previously published quantitative data for the assembly kinetics of Nup133 (representing the Nup107–160 complex), Nup93, and Pom121 at the end of mitosis (Dultz et al., 2008) with the same sigmoid function. This yielded mean characteristic postmitotic assembly times of 1.9 ± 0.5 min for Nup133, 0.75 ± 0.17 min for Nup93, and 1.5 ± 0.2 min for Pom121 (n = 5 for all nucleoporins; Fig. 3 C and Fig. S2). Although the precision of the comparison is somewhat hampered by the lower time resolution necessary to capture the slow and rare single NPC assembly events in interphase, the difference in the overall duration of the assembly process between interphase and mitosis by about one order of magnitude is striking (Fig. 3, B and C). This longer time frame of NPC assembly in interphase might be, for example, a result of the requirement for fusion between inner and outer nuclear membranes. In addition to NPC assembly events, we occasionally observed events of apparent NPC disassembly in which a fluorescent signal of indistinguishable appearance from neighboring NPCs disappeared (Fig. 2 D and Fig. S3). Disappearance of the signal in all observed cases occurred very rapidly, but the events were too rare to characterize their kinetics in detail. Such “disassembling” pores were also observed in cells coexpressing Nup107 and Pom121 tagged with different fluorescent proteins, indicating that they indeed represent NPCs (Fig. S3 B). In these double-labeled events, both signals decreased simultaneously (at a 15-min time resolution), indicating that disassembly is more rapid than assembly also in interphase, similar to our previous observations in mitosis (Dultz et al., 2008). Previous analysis in live cells indicated that NPCs are extremely stable in interphase (Daigle et al., 2001; Rabut et al., 2004) and can remain assembled and functional for the entire lifetime of differentiated cells in Caenorhabditis elegans (D’Angelo et al., 2009). Our observations suggest that NPCs may be able to disassemble spontaneously during interphase at low frequency. It will be interesting to study this process further in the future when advances in imaging technology will allow capturing these rare and transient events reliably. To gain insight into not only the kinetics but also the order of interphase NPC assembly, we next asked whether the slow accumulation of the integral membrane protein Pom121 at the assembly site is an early or late step of assembly. At the end of mitosis, NPCs assemble in a stereotypic and highly ordered process in which the different nucleoporin subcomplexes are sequentially recruited to the reforming nuclear envelope (Bodoor et al., 1999; Dultz et al., 2008). Assembly is initiated by the binding of the Nup107–160 complex to chromatin upon anaphase onset, where it provides the assembly seeds for NPCs that then recruit transmembrane nucleoporins like Pom121 (Dultz et al., 2008; Rasala et al., 2008). By analyzing cells expressing Pom121 and Nup107 tagged with GFP and mCherry, respectively, resulting in double-labeled pores, we found that this order is inverted in interphase. Of 34 double-labeled NPC assembly events, 28 (82%) started with the signal of Pom121 appearing before the signal of Nup107, 5 showed simultaneous appearance of both nucleoporins (at a time resolution of 15 min), and only once was the signal of Nup107 above the significance threshold (see Materials and methods section Measurements of pore formation kinetics) before Pom121 (Fig. 4 C). There was no difference in this assembly order after swapping the colors between Pom121 and Nup107, excluding an influence of the different fluorescent proteins on the detection of the tagged proteins. Fitting of the assembly kinetics and temporal alignment using the half-maximal intensity of Nup107 as a reference clearly shows the assembly of the transmembrane protein Pom121 before Nup107 with a mean delay of 45 ± 36 min between the half-maximal intensities of Pom121 and Nup107 (Fig. 4 B). Our data thus provide direct evidence that during interphase, Pom121 assembles into newly forming NPCs before Nup107, as proposed by Doucet et al. (2010) based on indirect immunofluorescence data. Surprisingly, the order of recruitment of these two essential subcomplexes for NPC assembly is thus the opposite of postmitotic assembly, demonstrating fundamental mechanistic differences between NPC assembly in the two different cell cycle states. After mitosis, NPC assembly is initiated by the large, soluble Nup107–160 subcomplex by binding to chromatin via ELYS, thus defining the assembly position and acting as a platform for NPC assembly. Our data show that, in interphase, this role is taken over by other NPC components, likely by the transmembrane nucleoporin Pom121. Interestingly, both Nup107–160 and Pom121 have been implicated in providing a checkpoint for nuclear envelope closure of in vitro assembled nuclei (Antonin et al., 2005). They might play a similar role, but in reverse order, during interphase assembly and are then followed by the assembly of peripheral and central channel nucleoporins. Figure 4. Order of NPC assembly. (A) A cell expressing Pom121-3EGFP and 3mCherry-Nup107 was imaged at a time resolution of 15 min. A newly appearing NPC is circled. Black data points represent the mean of 10 preexisting pores. Red boxes on overview image indicate region of magnification. (B) Kinetic traces of individual newly forming NPCs were fitted with sigmoid functions and aligned along the half-maximal intensity of Nup107. Data points for all series are shown as diamonds, and solid lines indicate the mean fit for each nucleoporin. (C) Order of appearance of the signals for Pom121 and Nup107 according to quantitative and unbiased criteria (compare with Materials and methods section Measurements of pore formation kinetics). Data are pooled from experiments with swapped fluorescent protein tags. Conclusion Our findings provide direct evidence for different kinetics and mechanisms of NPC assembly during mitosis and interphase. We show that NPC assembly in interphase is an order of magnitude slower than in mitosis and that essential components of the NPC are recruited to the assembly site in a different order. To our knowledge, the NPC is thus the first example of a multiprotein complex, which is assembled by distinct mechanisms in two different phases of the cell cycle. These different mechanisms have likely evolved to cope with the fundamentally different cellular conditions between interphase and mitosis. Most importantly, the membrane fusion between inner and outer nuclear membranes may be the rate-limiting step of NPC assembly in interphase. This is supported by recent data showing that not only Pom121 but also the membrane binding domain of Nup133 play important roles, specifically during interphase NPC assembly (Doucet et al., 2010). Because postmitotic NPC assembly occurs on open chromatin concomitant with nuclear envelope formation, no direct fusion event may be required in this process (Antonin et al., 2008). The two distinct mechanisms of NPC assembly could also reflect the fundamentally different functional requirements of the nucleus after mitosis and in interphase. After mitosis, nuclear import has to be established quickly to allow DNA decondensation and the onset of gene transcription. Therefore, rapidly building prepores on the surface of chromosomes that can immediately start nuclear import as soon as the new nuclear membrane barrier is laterally attached to them are an ideally suited mechanism. By contrast, in interphase, nuclei already have fully established transport capacity and a tightly controlled permeability barrier toward the cytoplasm. The main function of NPC assembly during interphase presumably is to maintain nuclear envelope homeostasis during nuclear growth in order to provide enough material for the two daughter cells in the next cell cycle. In this situation, a more gradual assembly process that initiates with the crucial step of a controlled membrane fusion would preserve the nucleo-cytoplasmic diffusion barrier and maintain controlled transport. Materials and methods DNA constructs and cell culture pPom121-3mCherry and p3mCherry-Nup107 were created by replacing the three copies of EGFP in pPom121-3EGFP (Daigle et al., 2001) and p3EGFP-Nup107 (Belgareh et al., 2001) with three copies of mCherry. NRK cells were maintained in standard DME medium. An NRK cell line stably expressing Pom121-3EGFP (Daigle et al., 2001) was generated by selection with 0.5 mg/ml Geneticin (Invitrogen) and maintained in the presence of the antibiotic. The NRK cell line stably expressing IBB-DiHcRed was described previously in Dultz et al. (2009). Both cell lines had mean cell cycle durations of 12.5 h, similar to wild-type NRK cells. All imaging of Pom121 alone was performed in the stable cell line. For experiments with other nucleoporins, the plasmids p3EGFP-Nup107, p3EGFP-Nup133 (Belgareh et al., 2001), pNup93-3EGFP (Rabut et al., 2004), p3mCherry-Nup107, pPom121-3EGFP, and pPom121-3mCherry were expressed transiently as indicated in the figure legends. 3EGFP-Nup107 and 3EGFP-Nup133 were always cotransfected for enhanced signal. Transfections with plasmid DNA were performed with FuGene (Roche) or jetPRIME (PEQLAB Biotechnologie GmbH) according to the instructions of the manufacturer 50–80 h before imaging. All used nucleoporin fusion proteins are stably bound at the NPC (Rabut et al., 2004) and are therefore expected to correctly reflect the structure and assembly of the endogenous proteins. Nevertheless, we cannot exclude subtle changes in the transport properties of the assembled NPCs containing GFPs as has been suggested by single-molecule transport experiments (Yang and Musser, 2006). Live cell microscopy For live cell microscopy, cells were seeded into chambered coverglasses (LabTek; Thermo Fisher Scientific), and the culture medium was exchanged for prewarmed imaging medium (CO2-independent medium without phenol red [Invitrogen] supplemented with 20% FCS, 2 mM glutamine, 100 mg/ml penicillin, and streptomycin) at least 30 min before imaging. The chambers were sealed with silicon grease. Live cell microscopy was performed at 37°C on an LSM 510 Meta microscope using the LSM software or an LSM 710 microscope using the Zen software (all microscopes and objectives were obtained from Carl Zeiss, Inc.). High resolution NPC data for a single color were acquired on a microscope (LSM 510 Meta) with a 100× Plan-α Fluar objective, NA 1.45. Nuclear volume measurements were performed with a 63× Plan-Apochromat objective, NA 1.4. NPC data in two colors were acquired on the LSM 510 using a 100× Plan-Apochromat objective, NA 1.4 or on the LSM 710 with a 63× Plan-Apochromat objective, NA 1.4. The AutoTimeSeries Macro (Rabut and Ellenberg, 2004) was used to automatically track cells during time-lapse experiments whenever possible on the LSM software–run microscopes. Imaging for single NPC assembly events was performed with a time resolution of 3–15 min. Three optical sections at a distance of 0.4–0.5 µm were acquired to cover the entire nuclear envelope and thus exclude that appearance or disappearance of individual NPCs might be caused by local folding or focus fluctuations. For all single-pore analysis, cells were chosen among the 10% highest expressing cells that exhibited no aberrant aggregates or NPC clusters in order to provide sufficient signal for this high resolution time-lapse assay. Image analysis Image processing was performed in ImageJ (National Institutes of Health). Calculations and fitting were performed in Excel (Microsoft) unless otherwise stated. Pore density measurements The density of pores was measured using the ITCN plugin for ImageJ to find the peak fluorescence of individual pores in a manually selected in-focus region of the nuclear surface. Images were first filtered with a Gaussian blur filter in ImageJ with kernel size 2.5 and then were analyzed with the ITCN plugin using the following parameters: a width of 7 pixels, distance of 6 pixels, and threshold of 0.3–0.5. Errors in this peak detection method were estimated to be <5% by comparison to manual identification of pores on 10 randomly chosen images. Time courses of NPC density of individual cells were fitted by linear regression, and the slopes were tested to significantly deviate from 0 with a p-value of 0.02 (one sample z test). Measurements of pore formation kinetics Time-lapse series for the analysis of pore formation kinetics were z projected and registered according to two manually selected landmarks. Newly forming pores were identified visually, and intensities were measured on the best in-focus slice for single-color data and on the mean intensity projection for two-color data. For each individual newly forming pore, a preexisting pore of representative intensity was chosen as a reference pore. The best in-focus slice was identified individually for each frame by the highest signal intensity of this reference pore. Background intensities were measured on the same slice and subtracted. Only newly forming pores that reached an intensity at least half the intensity of the reference pore and for which the intensity increase from background intensity to final plateau was at least twice the SD of the intensity fluctuations of the reference pore were considered for analysis. For comparison of the kinetics of different nucleoporin subcomplexes, background-subtracted intensity data normalized to the upper plateau were fitted with a sigmoid function of the form y = 1 − 1/(1 + exp((t − t0)/τ), where t0 is the time of the half-maximum and τ is the characteristic time. Fitting was performed with the Curve Fitting Toolbox of Matlab (MathWorks, Inc.). Because of the lower photostability and quantum yield of mCherry relative to EGFP, it was not possible to obtain movies of comparable quality in two colors. Therefore, for the data shown in Fig. 4 C, the first time point of appearance of a new NPC in each color was judged to be the time point when the signal first reached an intensity of at least three SDs above the background of 10 randomly chosen pore-free regions and no more than two SDs below the intensity of 10 well-defined preexisting NPCs. In addition, the dynamic range between background and preexisting NPCs was required to be at least twice the sum of the SDs of background and preexisting NPCs. Online supplemental material Fig. S1 shows nuclear growth during interphase. Fig. S2 shows sigmoid fits for postmitotic NPC assembly. Fig. S3 shows evidence for disassembly of NPCs. Online supplemental material is available at http://www.jcb.org/cgi/content/full/jcb.201007076/DC1.
- Record: found
- Abstract: found
- Article: not found
Nuclear pore complex assembly through the cell cycle: regulation and membrane organization.
Wolfram Antonin, Jan Ellenberg, Elisa Dultz (2008)
In eukaryotes, all macromolecules traffic between the nucleus and the cytoplasm through nuclear pore complexes (NPCs), which are among the largest supramolecular assemblies in cells. Although their composition in yeast and metazoa is well characterized, understanding how NPCs are assembled and form the pore through the double membrane of the nuclear envelope and how both processes are controlled still remains a challenge. Here, we summarize what is known about the biogenesis of NPCs throughout the cell cycle with special focus on the membrane reorganization and the regulation that go along with NPC assembly.
Author and article information
Journal
Journal ID (nlm-ta): J Cell Biol
Journal ID (hwp): jcb
Title:
The Journal of Cell Biology
Publisher:
The Rockefeller University Press
ISSN
(Print):
0021-9525
ISSN
(Electronic):
1540-8140
Publication date
(Print):
4
October
2010
Volume: 191
Issue: 1
Page: 3
Author notes
Article
Publisher ID: 1911ifDOI: 10.1083/jcb.1911if
PMC ID: 2953434
SO-VID: 246cf2c9-82e0-45a2-bae5-b4e77252df59
Copyright © © 2010 The Rockefeller University Press
History
Categories
Subject:
News
Subject:
In Focus
ScienceOpen disciplines: Cell biology
Data availability:
ScienceOpen disciplines: Cell biology