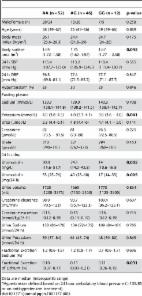
Introduction Hypertension is a major cardiovascular risk factor with a global prevalence of 26.4% in 2000, projected to increase to 29.2% by 2025, and is the leading contributor to global mortality[1], [2]. While epidemiologically BP is a trait continuously associated with an increased risk of cardiovascular mortality and morbidity, clinical risk assessment is necessarily based on a predefined threshold at which the quantitative BP phenotype is converted into a binary trait (hypertension) [3]–[6]. The main justification for large scale efforts to determine the genetic underpinnings of BP regulation is to identify new pharmacological targets for BP reduction while advancing our understanding of blood pressure regulation. This in turn could lead to novel prevention strategies to reduce the growing public health burden of hypertension-related cardiovascular disease [2], [7]. Systemic blood pressure (BP) is determined primarily by cardiac output and total peripheral resistance, which are controlled by a complex network of interacting pathways involving renal, neural, endocrine, vascular and environmental factors. So far, the search for common variants affecting BP has identified thirteen loci from two large meta-analyses consortia, with each association explaining only a very small proportion of the total variation in systolic or diastolic blood pressure (SBP or DBP; ∼0.05–0.10%, approximately 1 mmHg per allele SBP or 0.5 mmHg per allele DBP)[8], [9]. The sum of rare and common genetic variants robustly identified so far through linkage and genome wide association studies explain only 1–2% of the population variation in BP and hypertension. These data suggest the existence of more undiscovered blood pressure related common variants. Cross-sectional studies of the general population have required extremely large sample sizes to detect such small effect sizes [10]. In this paper we explored an alternative strategy to increase power, using cases and controls drawn from the extremes of the BP distribution, and detected a novel locus associated with hypertension. We then validated this association using large-scale population and case-control studies, where similar extreme criteria for selection of cases and controls have been used. As the locus was related to uromodulin, a protein exclusively expressed intrarenally, we tested for dependency of the association on renal function (eGFR) and urinary excretion of uromodulin. Finally, we tested associations with cardiovascular outcomes. Results Genome-wide association, replication, and meta-analysis The demographic characteristics of the discovery and validation cohorts are presented in Table 1 and Table S1 respectively. The results of the GWAS in the discovery sample are presented in Figure 1. The observed versus expected p-value distributions (quantile-quantile plots) are shown in Figure 2. The top hit was rs13333226 with the minor G allele associated with a lower risk of hypertension (OR [95%CI]: 0.6 [0.5–0.73]; p = 1.14×10⁻⁷; Figure 3) and we selected this for validation in two stages (Figure S1, Table 2 and Table 3). In the first stage we genotyped rs13333226 in the MONICA/PAMELA population samples (in which we also genotyped an additional top 88 SNPs – Table S2) and in the larger MDC and MPP validation case-control populations. For the stage 1 validation, we had 9,827 cases and 8,694 controls and the combined analysis showed the minor G allele to be associated with a lower risk of hypertension (0.87 [0.82–0.92]; p = 3.6×10⁻⁶) after adjustment for age, age2 and BMI. Combined analysis of the 89 SNPs genotyped in the MONICA/PAMELA with the discovery cohort showed rs13333226 (p = 3.86×10⁻⁷) and rs4293393 (p = 3.30×10⁻⁷, r2 = 0.996) were the top SNPs. In stage 2 analysis which included 10,018 cases and 7,847 controls, the results were similar with the G allele associated with a lower risk of hypertension (0.86 [0.81–0.92]; p = 1.0×10⁻⁵). Combining stage 1 and stage 2 cohorts increased the strength of association (0.86 [0.83–0.90]; p = 1.61×10⁻¹⁰). There was no evidence of heterogeneity across the stage 1 or stage 2 samples or the combined stage 1 and 2 samples as tested by the Q statistic (p>0.05). Merging stages 1 and 2 with the discovery samples yielded the strongest association signal for rs13333226 (0.85 [0.81–0.89]; p = 1.5×10⁻¹³) with some evidence of heterogeneity (Q statistic p value = 0.04) introduced by the discovery cohort (Table 2, Figure 4A and 4B, Figure S2). This is probably due to the fact that the discovery cohort was ascertained using more extreme criteria than the replication cohorts. In the 13,446 individuals with eGFR measurements available, the strength of association of rs13333226 with hypertension was identical after correcting for eGFR and the effect sizes remained unchanged (unadjusted for eGFR: OR [95%CI] = 0.90[0.83;0.96], p = 0.004; after eGFR adjustment: OR [95%CI] = 0.89[0.83;0.96], p = 0.003) and there was no evidence of heterogeneity across the study samples (Table 3, Figure 4C and 4D). 10.1371/journal.pgen.1001177.g001 Figure 1 Manhattan plot of genomewide –log10(p-value) from association analysis of BP extremes in the discovery sample. 10.1371/journal.pgen.1001177.g002 Figure 2 Quantile-Quantile plot of observed versus expected p-value distributions in the discovery sample. 10.1371/journal.pgen.1001177.g003 Figure 3 Association plot of the genomic region around rs13333226 showing both typed and imputed SNPs with location of genes and recombination rate. 10.1371/journal.pgen.1001177.g004 Figure 4 Forest Plots of association with rs13333226 and hypertension (adjustment for population stratification was applied using principal components as appropriate for each cohort). A: Forest plot of association analysis unadjusted for any covariates −21,466 cases and 18,240 controls. B: Forest plot of association analysis adjusted age, age2, sex and BMI −21,466 cases and 18,240 controls. C: Forest plot of association analysis in the cohorts where eGFR was available and adjusted for age, age2, sex, BMI −7427 controls and 5739 cases. D: Forest plot of association analysis in the cohorts where eGFR was available and adjusted for age, age2, sex, BMI and eGFR −7427 controls and 5739 cases. 10.1371/journal.pgen.1001177.t001 Table 1 Demographic characteristics of the discovery case control population. Controls(n = 1699) Cases(n = 1621) p Age at enrolment, years 57.4 (5.9) 55.4 (7.1) 135/85 or on antihypertensive treatment). In BRIGHT, GG carriers were found to have a significantly lower fractional excretion of sodium (p = 0.032). In the smaller HERCULES sample this also occurred, though short of statistical significance. However, in HERCULES urinary uromodulin was positively associated with urinary sodium excretion (p = 0.025) and fractional excretion of endogenous lithium (r2 = 0.19, p = 0.045). Overall, BRIGHT and HERCULES data suggest that low urinary uromodulin is associated with higher sodium reabsorption, and that this occurs at the proximal tubular level. In the small GRECO cohort, urinary uromodulin concentration (p = 0.004) and 24 hour uromodulin excretion (p = 0.002; Wilcoxon′s signed ranks test) were found to be significantly increased after a high sodium intake (Table 6). The G allele was associated with lower uromodulin excretion only on low sodium diet (p = 0.002). 10.1371/journal.pgen.1001177.t006 Table 6 Univariate association analysis of urinary uromodulin in relation to rs13333226 polymorphism and response to high and low sodium intake (GRECO Study). AA (n = 40) AG and GG (n = 24) p-value Male:Female (n) 40/0 24/0 1.0 Age (years) 26 (8) 23 (6) 0.105 Body mass index (Kg/m2) 23.4 (2.7) 23.4 (2.1) 1.0 Body surface area (m2) 2.05 (0.14) 2.03 (0.15) 0.590 SBP LS (mm Hg) 120 (10) 121 (10) 0.670 DBP LS (mm Hg) 68 (9) 70 (6) 0.453 SBP HS (mm Hg) 123 (10) 124 (10) 0.805 DPB HS (mm Hg) 69 (8) 70 (7) 0.661 GFR LS (mL/min/1.73 m2) 109 (13) 103 (14) 0.127 GFR HS (mL/min/1.73 m2) 114 (14) 116 (15) 0.719 ERPF LS (mL/min/1.73 m2) 472 (74) 449 (68) 0.209 ERPF HS (mL/min/1.73 m2) 502 (90) 489 (68) 0.529 ECV LS (L/1.73 m2) 16.5 (1.9) 16.3 (1.6) 0.657 ECV HS (L/1.73 m2) 17.2 (1.7) 18.0 (1.9) 0.093 Fractional Excretion Sodium LS (%) 0.19 (0.18) 0.22 (0.25) 0.342 Fractional Excretion Sodium HS (%) 0.99 (0.35) 0.82 (0.31) 0.001 Plasma Renin Activity LS (nmol/L/h) 6.3 (3.7) 6.6 (3.1) 0.723 Plasma Renin Activity HS (nmol/L/h) 2.5 (1.5) 2.0 (0.9) 0.155 Uromodulin LS median (IQR) (mg/L) 10.3 (6.9–15.6) 9.0 (6.3–14.2) 0.002 Uromodulin HS median (IQR) (mg/L) 11.9 (7.5–27.9) 12.2 (7.2–21.3) 0.513 LS: Low sodium diet, HS: High sodium diet; Data are presented as mean (SD). P-value comparing AA versus AG+GG. Cardiovascular outcomes and rs13333226 Finally, we evaluated the clinical significance of our findings by testing whether the low BP associated allele may protect against development of cardiovascular events during long-term follow-up at the population level. Among 26,654 subjects from the entire population based MDC study [11] who were free from prior cardiovascular events at baseline, 2,750 individuals developed cardiovascular events (CVD) during 12 years of follow-up. We found each copy of the G allele to be associated with a 7.7% reduction in risk of CVD events after adjusting for age, sex, BMI and smoking status (H.R. = 0.923, 95% CI 0.860–0.991; p = 0.027). When SBP (H.R. = 0.936, 95% CI 0.872–1.005; p = 0.067) or SBP and DBP (H.R. = 0.937, 95% CI 0.873–1.005; p = 0.069) were added to the Cox regression model, the directionality and risk remained almost identical. Discussion We have identified and validated a SNP upstream of the uromodulin (UMOD) gene whose minor allele is associated with a lower risk of hypertension. The associated SNP (rs13333226) is in close proximity to the uromodulin transcription start site at −1617 base pairs. There is only one previous candidate gene study of UMOD and hypertension. This study tested rs6497476, located in the 5′ region of the UMOD gene (−744 bp from UMOD transcriptional start point) and showed the minor allele with a lower risk of hypertension in a Japanese population, but it did not reach statistical significance [12]. This SNP is correlated with rs13333226 in the Japanese HapMap population (r2 = 0.91) and shows the same directionality of effect. A recent genome scan for chronic kidney disease (CKD) [13] has found the minor T allele at rs12917707, −3653 bp upstream from the UMOD transcription start site to be associated with a 20% reduction in risk of CKD. This association was consistent after adjusting for major CKD risk factors including SBP and hypertension. This SNP -rs12917707 is perfectly correlated (r2 = 1 in HapMap CEU) with rs13333226. Our data show the minor allele of rs13333226 is associated with increased eGFR (beta = 3.6, p = 0.012), but adjustment for eGFR in our meta-analyses did not alter its association with lower risk for hypertension. This suggests that the UMOD locus is independently associated with hypertension. We also show an association of rs13333226 with long term cardiovascular outcomes with a relatively small attenuation of the relationship after SBP/DBP adjustment. This suggests UMOD may have an influence on cardiovascular disease at least partly independent of BP. However, our conditional analyses are limited by the fact that single point measures of BP and eGFR may not truly represent the lifetime effect of the genetic variant on these traits. Therefore, we cannot exclude that rs13333226 may exert its effects on hypertension and cardiovascular disease, at least partly through its effects on renal function and blood pressure, respectively. The UMOD gene encodes the Tamm Horsfall protein (THP)/uromodulin, a glycosylphosphatidylinositol (GPI) anchored glycoprotein. It is the most abundant tubular protein in the urine, which is expressed primarily in the thick ascending limb of the loop of Henle (TAL) with negligible expression elsewhere [14], [15]. We show in the BRIGHT, HERCULES and GRECO (low sodium diet) that the minor allele of rs13333226 (associated with a lower risk of hypertension) is consistently associated with lower urinary uromodulin excretion. This effect was lost when GRECO subjects were given a high sodium diet. We also show in BRIGHT and HERCULES that the G allele and lower urinary uromodulin are associated with lower fractional excretion of sodium and lower fractional excretion of endogenous lithium, indicating increased sodium reabsorption at the proximal tubular level. While the association of lower blood pressure and increased sodium reabsorption may appear counterintuitive, an increased sodium reabsorption by the proximal tubule may simply be the consequence of an increased sodium load because of increased GFR, or a compensatory reaction to a primary decrease in distal reabsorption. In absence of information on sodium intake in individuals in BRIGHT and HERCULES, we cannot exclude that the lower fractional sodium excretion in carriers of the G allele simply reflects a low dietary sodium intake. The exclusive expression of uromodulin in TAL, where physiologically crucial mechanisms of sodium handling are located, suggests that alterations of some of these mechanisms in G allele carriers may underlie their lower risk of hypertension. However, functional studies are needed to clarify the renal mechanisms by which the UMOD gene may affect hypertension and renal sodium handling. In the context of our findings it is of interest to note that UMOD mutations (in exons 4 and 5) are implicated in monogenic syndromes such as familial juvenile hyperuricemic nephropathy, autosomal-dominant medullary cystic kidney disease [MCKD2] and glomerulocystic kidney disease (GCKD) (MIM603860, MIM162000, MIM609886) [16]–[18]. In previous small studies, urinary uromodulin levels were found to be decreased in older subjects and in subjects with renal impairment [19], [20]. In renal disease patients, uromodulin excretion was reduced in proportion to the extent of renal damage, and was a marker of distal tubular sodium reabsorption, but in these studies, the effects of BP on uromodulin were inconsistent [21], [22]. The TAL, where UMOD is selectively expressed is also the site where mutations of tubular transporters have resulted in rare Mendelian high or low BP syndromes [23]. Furthermore, recent data from Lifton's group demonstrated that heterozygous mutations in SLC12A3 (encoding the thiazide-sensitive Na-Cl cotransporter), SLC12A1 (encoding the Na-K-Cl cotransporter NKCC2), and KCNJ1 (encoding the K+ channel ROMK) discovered in the general population have been associated with lower BP and a 60% reduction in the development of hypertension [24]. Our strategy of using extremes of BP distribution has led to the discovery of a gene variant that could not be discovered when a less stringent case-control definition was used [10]. For example, in stage 1 Global BPgen samples (n = 34,433), the p values for association of rs13333226 with SBP and DBP were 0.0077 and 0.0099 respectively indicating that rs13333226 would not have been selected for validation as the p-value threshold for follow-up genotyping in that study was p 150/100 mmHg) prior to 50 years of age. Exclusion criteria included BMI>35, diabetes, secondary hypertension or co-existing illness. 24-hour urine collection was available for all the cases with measurements of urinary sodium, potassium, creatinine and microalbuminuria. We measured urinary uromodulin in 256 hypertensive subjects. Groningen Renal Hemodynamic Cohort Study Group (GRECO): The GRECO protocol comprises integrated measurement of renal hemodynamics and extracellular volume as applied in an ongoing series of studies in healthy subjects [33], [34]. For the current analysis 64 healthy adult males were included (mean age = 23 years), who had been studied after two seven-day periods: the first 7 days on a low sodium diet (LS, 50 mmol Na+ per day, balance verified by repeated 24 h urine), the second 7 days on a high-sodium diet (HS, 200 mmol Na+ per day). Hypertension Evaluation by Remler and CalciUria LEvel Study (HERCULES) is a substudy of the population-based CoLaus study (www.colaus.ch) from Lausanne Switzerland [35], [36]. A random sample of 411 CoLaus participants, aged 38–78 years, underwent ambulatory BP monitoring and 24 hour urine collection. The phenotypes available include 24-hour urine collection with measurement of creatinine clearance, endogenous lithium clearance, urinary sodium, potassium and uric acid excretion and microalbuminuria. We measured urinary uromodulin in 110 participants of this study. Urinary uromodulin measurements Urinary uromodulin was measured in duplicate in 24 hour urine samples using a commercially available ELISA (MD Biosciences, Zürich, Switzerland) as recommended by the manufacturer. The range of assay is 9.375–150 ng/mL and sensitivity <5.50 ng/mL. The inter-assay coefficient of variation was 11.9%. Urinary uromodulin levels were corrected for urine creatinine before analysis. Genotyping and quality control The genomewide association study (GWAS) samples were genotyped using Illumina 550K Single and Illumina 610 Quad V1 BeadChip (Illumina, Inc., San Diego, CA, USA). We included 551,629 SNPs common to both the Single and Quad chips, for analysis. SNPs with a minor allele frequency (MAF) <1% or in significant Hardy-Weinberg disequilibrium (P<1×10⁻⁷) in pooled samples were removed leaving 521,220 SNPs for analysis. We assessed population structure within the data using principal components analysis as implemented in EIGENSTRAT [37] to infer continuous axes of genetic variation. After data quality control for unspecified sex (5 subjects removed), relatedness/duplicates (68 individuals removed), multidimensional scaling plot outliers (33 individuals removed), genetic outliers - which are defined as individuals whose ancestry is at least 6 s.d. from the mean on one of the top ten axes of variation on principal component analysis (388 individuals removed) and genotyping success of <95% (92 individuals removed), genotype information from 1,621 cases and 1,699 controls (1,510 males and 1,810 females) was available for analysis. Untyped SNPs were imputed using IMPUTE v1 [38] with data from the August 2009 release of CEU phased haplotypes from Pilot 1 of the 1000 Genomes Project NCBI Build 36 (dbSNP b126) as the reference panel (from https://mathgen.stats.ox.ac.uk/impute/impute_v1.html). The probability threshold used for calling an imputed genotype was 0.9. Association analysis was performed using SNPTEST [38] taking into account uncertainty in imputation. Statistical analysis In the GWAS samples, we tested each SNP for association using an additive genetic model and logistic regression with adjustment for significant ancestry principal components [37] to correct for population stratification. There was still a slight overall inflation of test statistics, with a genomic control inflation factor (λ) of 1.07 (Figure 2). All results are presented after application of genomic control to correct for this residual inflation [39]. Additionally two logistic regression analyses were performed, with adjustment for age, age2, sex and BMI and with adjustment for age, age2, sex, BMI and eGFR. Multiple linear regression was used to test association between genotype and urinary uromodulin levels, functional parameters like GFR, extracellular volume etc. with relevant covariates. In the GRECO study, as the numbers of GG genotypes were small, AG and GG were combined for analysis. Non-normally distributed traits were tested using the non-parametric Kruskal Wallis test. Validation analysis In validation samples, SNPs were tested for association using logistic regression, with adjustment for ancestry principal components where available to correct for population stratification. Meta-analysis of the combined discovery and validation results was conducted using an inverse-variance weighted (fixed-effects) meta-analysis. In the meta-analysis, a genomewide significance threshold of 5×10⁻⁸ corresponding to a P value of 0.05 with a Bonferroni correction for 1 million independent tests was considered a priori as genomewide significant [40]. Continuous BP trait modeling The associations between the validated SNP and SBP and DBP were analysed separately in the Stage 1 samples of the Global BPgen consortium (n = 34,433) and in the overall MDC (n = 27,000) and MPP (n = 17,700) cohorts [9],[26],[29]. The results were combined using fixed-effect inverse variance weighted meta-analysis. Continuous SBP and DBP were adjusted for age, age2, body mass index and any study-specific geographic covariates in sex-specific linear regression models. In individuals taking antihypertensive therapies, blood pressure was imputed by adding 15 mm Hg and 10 mm Hg for SBP and DBP, respectively [9], [41]. Survival analysis We performed multivariable Cox proportional hazards models to examine the association between biomarkers and incident events. (myocardial infarction, stroke, coronary death). Two models, one adjusted for age, sex, BMI , SBP and smoking status and another adjusting for age, sex, BMI , SBP, DBP and smoking status were analysed. We confirmed that the proportionality of hazards assumption was met. The results are presented as hazard ratios and 95% confidence intervals per copy of the G allele. Survival analysis was performed using SPSS version 13.0 for Windows (SPSS Inc). Supporting Information Figure S1 Study design showing the discovery and two validation stages with the SNPs genotyped in each cohort along with sample sizes. (0.32 MB TIF) Click here for additional data file. Figure S2 A: Funnel Plot of all cohorts including discovery samples. Test of heterogeneity: p = 0.02. B: Funnel Plot of all cohorts excluding discovery samples. Test of heterogeneity: p = 0.52. (0.11 MB TIF) Click here for additional data file. Table S1 Summary demographics of the validation cohorts. (0.04 MB DOC) Click here for additional data file. Table S2 Replication analysis in the Italian MONICA/PAMELA population. Results presented are the discovery, replication and combined analysis using inverse variance fixed effect meta-analysis. (0.15 MB DOC) Click here for additional data file. Text S1 Acknowledgments. (0.06 MB DOC) Click here for additional data file.