- Record: found
- Abstract: found
- Article: not found
Imaging Publications in the COVID-19 Pandemic: Applying New Research Results to Clinical Practice
research-article
23 April 2020

There is no author summary for this article yet. Authors can add summaries to their articles on ScienceOpen to make them more accessible to a non-specialist audience.
Abstract
Introduction
Scientific data and its dissemination are essential elements of an effective response
to the current pandemic. As the global outbreak of coronavirus disease 2019 (COVID-19)
has unfolded, biomedical journals including Radiology have been working to publish
results of clinical experience and research in a timely manner (1). New imaging research
aims to help radiologists around the world to be prepared for the arrival of patients
with COVID-19 in their practices.
In the last months, clinicians have seen hundreds of research headlines on all aspects
of diagnosis, monitoring, and treatment of COVID-19. The plethora of new research
challenges our ability to interpret and apply new research results. Inevitably, we
attempt to intuitively extrapolate new research results to my patient and my hospital,
perhaps without having time to discern critical features in the research study population
and study design. In this article, we review principles clinical study design and
clinical epidemiology as applied to examples from the imaging literature concerning
CT diagnosis of COVID-19. Our goal is to assist the clinician in their critical appraisal
of the rapidly growing COVID-19 imaging literature and to illustrate how these new
research results may apply to daily practice.
Moving beyond sensitivity and specificity to predictive value
Most articles examining CT’s diagnostic performance focus on its sensitivity for diagnosing
COVID-19 pneumonia against the reference standard, reverse transcriptase polymerase
chain reaction (RT-PCR) for severe acute respiratory syndrome coronavirus 2 (SARS-CoV-2)
(2). A few articles also consider CT’s specificity. Although a logical starting point,
sensitivity and specificity, by definition, indicate CT’s diagnostic performance when
the true COVID-19 status is already known. Since a patient’s COVID-19 status is typically
unknown at time of presentation, sensitivity and specificity are not the most clinically
useful indicators of diagnostic test performance. Instead, we need to know the converse:
how likely is the patient to have COVID-19 given a positive or negative CT?
This last question defines the concept of predictive value. In the current pandemic,
positive predictive value (PPV) is the probability of having COVID-19 when a radiologist
determines the CT is positive and has findings that are consistent with COVID-19.
The negative predictive value (NPV) is the probability of not having the disease when
the CT is negative (or normal). PPV and NPV can be calculated by well-known formulas
(Fig 1) (3,4), but the calculations are not easy to perform in your head.
Figure 1:
Calculation of positive and negative predictive values.
To obtain a better intuitive understanding of the PPV and NPV formulas, we consider
the example of diagnosing COVID-19 pneumonia with CT. Consider an example of CT having
sensitivity of 97% (5) and an (optimistic) specificity of 80% for COVID-19. In addition,
assume a COVID-19 prevalence of 15%, (the approximate percentage of positive results
found in RT-PCR tests being performed at Johns Hopkins Medicine hospitals at the present
time). Inserting these assumptions into the formulas in Figure 1, the calculated PPV
is only 46%, but the NPV is 99% (Fig 2).
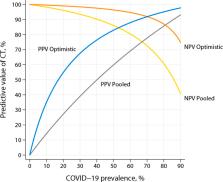
Figure 2:
Plot of positive and negative predictive values under two different assumptions of
sensitivity and specificity. For the “optimistic” assumption, sensitivity is 97% and
specificity is 80%. For the “pooled” assumption, sensitivity is 94% and specificity
is 37%, which are the pooled estimates from the meta-analysis by Kim et al. (2). Abbreviations:
PPV = positive predictive value, NPV = negative predictive value, COVID-19 = coronavirus
disease 2019, CT = computed tomography.
Both predictive values, especially the PPV, are numerically different from the assumed
sensitivity and specificity. Why? First, the PPV and NPV formulas include an additional
component—the prevalence of COVID-19—and the PPV and NPV are heavily influenced by
the prevalence of illness in a given population (6). Second, intuition may naturally
associate PPV with sensitivity and NPV with specificity. However, this intuition is
not correct: unless the disease prevalence is much greater than 50%, the PPV calculation
is mathematically dominated by specificity, rather than sensitivity (7). Because CT
is not a specific test for COVID-19 pneumonia, there will be many cases (46%, or about
1 out of every 2 cases) falsely diagnosed as COVID-19 by radiologists who note lung
opacities as “diagnostic” of COVID-19 pneumonia. Therefore, in our first example,
there is only about a 50-50 chance that the positive CT findings are actually due
to COVID-19 pneumonia.
On the other hand, our example case with NPV of 99% suggests that a negative CT could
rule out COVID-19 infection. This is because the NPV calculation is mathematically
dominated by sensitivity, which is high, rather than specificity (see also the callout
box in Fig 3). If CT is very sensitive for detecting COVID-19 pneumonia, very few
cases will be missed, so a patient with a negative CT will be unlikely to be a missed
case (7).
Figure 3:
Determinants of the predictive value of a diagnostic test.
Although the preceding example was meant to be illustrative, the calculation demonstrates
similar results—relatively low PPV and high NPV for CT—across plausible ranges of
sensitivity, specificity, and prevalence (Fig 2). Note further that the example has
no mention of “quality” of the research publication or how many patients were studied.
Rather, it focuses on the effect of the clinical environment on predictive value.
A community hospital in the midwestern portion of the United States may have a community
prevalence of COVID-19 of 1– 2%; a single nursing home in the same community may have
a prevalence of 40%, approaching that reported in Wuhan (2). CT at these two sites
in the same community would have vastly different predictive values for COVID-19 pneumonia.
A supplement to this article includes a spreadsheet with which the reader can try
their own calculations (online). For example, if specificity is lowered to a less
optimistic value of 50%, which is the upper limit of the confidence interval reported
by Kim et al. (2), the calculated PPV in our example case would be a lowly 26%.
Pay close attention to characteristics of the study population
Sensitivity, specificity, PPV, and NPV are strictly valid only for the population
from which they are obtained. Study populations in COVID-19 publications may be vastly
different not only between each other but also when compared to your hospital’s clinical
population. This section discusses the impact of the study population to our individual
hospital circumstances. (See also callout box in Fig 4).
Figure 4:
Key study population characteristics to assess when evaluating COVID-19 publications.
We start by comparing the distinctly different study populations reported by Ai et
al. (5) and Bai et al. (8) in Radiology. Both are studies of CT to identify COVID-19
pneumonia but with apparently opposite results concerning CT performance. Nevertheless,
both study results are valid in the context of their individual study populations.
Ai et al. reported their experience with 1014 cases of suspected SARS-CoV-2 infection,
finding CT to have a sensitivity of 97% and specificity of 25%. But the prevalence
of COVID-19 was 59%, which is far higher than is being reported in the United States
at the present time. In theory, sensitivity and specificity are inherent properties
of a diagnostic test that are independent of disease prevalence (4). However, in practice,
a difference in disease prevalence is often a surrogate marker for underlying population
differences that can affect the results of testing and treatment. For example, one
possible explanation for the unexpectedly low specificity reported by Ai et al. is
that radiologists were employing a low interpretation threshold for diagnosing COVID-19
on CT—perhaps including pneumonia patterns that are seen with COVID-19 but are less
typical. A low threshold involves a tradeoff between sensitivity and specificity that
favors sensitivity. Such a tradeoff might be justified in an epidemic area with an
extremely high COVID-19 prevalence. Other possible explanations for an unexpectedly
low specificity—not necessarily applicable to Ai et al.—include an imperfect reference
standard (e.g., RT-PCR tests with variable performance due to varying stages of viral
shedding) or high local prevalence of infections that mimic COVID-19 pneumonia.
Bai et al. reported a sensitivity range of 73-93% and a specificity range of 93-100%
among the American radiologists in their study. But their study was a reader study
and, by design, not population-based. In their study, the prevalence of COVID-19 approximated
50%, which is customary for well-designed reader studies. More importantly, the study
“population” was contrived, again by design. All CT cases, both positive and negative,
were abnormal. Furthermore, all the COVID-19 “negative” cases were patients with confirmed
viral pneumonia of another type. Obviously, this study “population” is nothing like
clinical practice. In real practice, the expected COVID-19 negative cases would include
patients with thoracic conditions other than viral pneumonia or even patients with
no thoracic disease at all.
Because COVID-19 is a new disease, no data from prospective, randomly sampled populations
can exist at the beginning of the outbreak. Initial studies must rely on retrospective
data collected from patients who happened to have both CT and RT-PCR, the reference
test. These studies are subject to substantial selection bias, a common problem with
retrospective studies. These biases are well-recognized and discussed elsewhere (9,10).
Given all of the preceding caveats, one might wonder whether such studies are of any
value to clinical practice. They do indeed have value, if appropriate attention is
paid to the characteristics of each study population. Even if it involved a population
with high COVID-19 prevalence, the study from Ai et al. provided a preliminary estimate
of CT’s sensitivity and specificity early in the pandemic—at a time when CT’s diagnostic
performance was unknown in any type of population. The results from Bai et al. suggest
that non-COVID-19 viral pneumonias do not resemble COVID-19, because their study's
high specificity meant few non-COVID-19 viral pneumonias were mistakenly classified
as COVID-19. In addition, COVID-19 pneumonia can resemble other viral pneumonias,
because their study's moderate sensitivity meant some COVID-19 pneumonias were mistakenly
classified as another type.
Where do we go from here?
To see how results reported in the COVID-19 literature fit into our clinical practice,
it is critical to understand the relationship between each study population and that
encountered in our own clinical environment. Marked differences are likely to exist
between your practice versus research study populations. As illustrated by the preceding
examples, population differences can result in apparently conflicting research results,
which can lead to the conclusion that the “true” sensitivity and specificity are yet
unknown (11). In reality, there is probably no single “true” sensitivity, specificity,
or predictive value that would apply to all clinical practice settings.
Meta-analyses are “studies of studies” that attempt to provide, e.g., sensitivity
and specificity, across all published research on the topic. A traditional meta-analysis
of a diagnostic test begins by assuming the existence of underlying “true” values
of sensitivity and specificity. A meta-analysis then attempts to estimate these values
by pooling the results statistically from multiple studies. For CT diagnosis of COVID-19,
the assumption of a single set of true values is, unfortunately, not a good assumption.
A high degree of “heterogeneity” for CT has been reported (2). For example, Kim et
al. provide statistical confidence intervals for sensitivity and specificity instead
of a single number (a so-called “point estimate”) (2). It is left to the reader to
determine the most applicable location within the confidence interval. For CT diagnosis
of COVID-19, statistical averaging of prevalence and predictive value are not meaningful
because of marked heterogeneity of the study populations of the existing literature.
When judging a study population, COVID-19 prevalence is a major indicator of similarity
of those populations. However, readers must also consider other important characteristics
such as age, other demographic factors, co-morbid diseases, COVID-19 stage at time
of imaging, and spectrum of disease severity, including the proportion of critically
ill patients and those with no symptoms at time of diagnosis. Research studies usually
assume equal access to medical care, but logistical, political, educational and socioeconomic
factors have affected access to COVID19 testing. Current estimates of COVID-19 prevalence
are based on the prevalence among those who have been tested, which is distinct from
the prevalence in the entire population, so apparent COVID-19 prevalence may change
as testing becomes more widespread. Clinical practice factors are also important to
consider, such as how patients suspected of SARS-CoV-2 infection are selected for
CT or RT-PCR testing and the CT interpretation criteria employed. The proportion of
infected patients who are asymptomatic is especially important because these patients
are associated with a different spectrum of CT findings (12) and may be selected differently
for RT-PCR testing. All of these differences can affect the apparent performance and
clinical role of CT in diagnosis and management of COVID-19 both in research populations
and clinical practice.
Differences in patient populations are acknowledged in the COVID-19 consensus statements
from the Fleischner Society, whose guidelines are stratified according to disease
risk and severity (13). COVID-19 reporting guidelines (11) represent an initial effort
to standardize CT interpretation thresholds, which would otherwise be a source of
hidden variability in the clinical population.
Rapid dissemination of clinical evidence will continue to be an important component
in responding to the COVID-19 pandemic. As the disease’s newness fades, opportunities
may arise to conduct prospective studies on randomly sampled populations. Even with
these more rigorously designed studies, attention will still be necessary to compare
study populations with those encountered in clinical practice. Attention will also
be required if COVID-19 prevalence or severity shifts in clinical populations. Thoughtful
application of clinical epidemiology principles is necessary in order to place new
COVID-19 evidence in a proper clinical context that continues to evolve.
APPENDIX
Predictive value calculation (spreadsheet)
Related collections
Most cited references7
- Record: found
- Abstract: found
- Article: not found
Correlation of Chest CT and RT-PCR Testing in Coronavirus Disease 2019 (COVID-19) in China: A Report of 1014 Cases
Tao Ai, Zhenlu Yang, Hongyan Hou … (2020)
- Record: found
- Abstract: found
- Article: not found
CT Imaging of the 2019 Novel Coronavirus (2019-nCoV) Pneumonia
Junqiang Lei, Junfeng Li, Xun Li … (2020)
- Record: found
- Abstract: found
- Article: not found