
Introduction
Consumers are increasingly aware of the relationships between diet and well-being and this has resulted in a growing preference for foods which are perceived as being healthier (Flowers et al., 2019). While beef is considered to have a high proportion of saturated fatty acids (SFA), it is also a source of polyunsaturated fatty acids (PUFA), particularly omega-3 PUFA, and conjugated linoleic acid (CLA), which are considered to be beneficial to human health (Palmquist, 2009; den Hartigh, 2019). When compared to concentrates, feeding fresh grass generally results in higher concentrations of omega-3 PUFA in muscle lipids, beneficially contributing to an increase in the PUFA:SFA ratio, a decrease in the omega-6:omega-3 PUFA ratio and an increase in the deposition of CLA (Scollan et al., 2014). These supposed health benefits contribute to animal products labelled as “Grass-Based or Grass-Fed”, commanding a premium price from consumers (Stampa et al., 2020). Where climatic conditions permit, there is an opportunity therefore to modify traditional beef production systems to access this growing market.
In Ireland, male cattle of dairy origin make a major contribution to national beef production. A grass-based production system has evolved whereby dairy calves are Spring-born and slaughtered as steers at 24 mo of age after two grazing seasons with a pre-slaughter indoor ration consisting of grass silage and varying amounts of concentrates. Elimination of this expensive indoor finishing phase by slaughtering cattle at the end of the grazing season would provide an opportunity to market beef from this production system as “Grass Finished”. Of the dairy-origin animals entering beef production systems, approximately 52% are the progeny of Holstein-Friesian (HF) sires with the remainder being the progeny of early-maturing beef breeds such as Aberdeen Angus (AA) and late-maturing sires including Belgian Blue (BB) (Prendiville et al., 2018).
Keane & Moloney (2010) reported production and carcass characteristics of the male progeny of these sire breeds when slaughtered at 21 mo of age (end of the grazing season) from either pasture or having been housed and offered concentrates for 3 mo previously. Male progeny of these sire breeds were also slaughtered at 24 mo of age after receiving concentrates for 3 mo subsequent to the end of the grazing season. An important current market requirement for beef in Europe is that carcasses have a sufficient amount of fat based on the EUROP carcass classification scheme (EC, 2006). Of the cattle slaughtered from pasture, only the carcasses from the AA-sired cattle achieved the current market requirement for fat score (2+). However, an improvement of the fatty acid profile of beef due to pasture finishing could provide an opportunity to develop a new market for this beef. Previous studies in which the fatty acid composition of pasture- and concentrate-finished beef has been compared have tended to be relatively short-term and/or not considered the pre-experimental diet. The long grazing periods in the production system described earlier for dairy-origin steers would be expected to enhance the fatty acid composition to a greater extent than in these studies. While it is recognised that concentrate finishing of previously grazed cattle will dilute the beneficial effect of grazing (Moloney et al., 2008), increasing the grazing period before concentrate finishing may ameliorate this effect. Our first objective was to determine the effect of the sire breed/finishing system combinations described by Keane & Moloney (2010) on the fatty acid composition of beef.
Furthermore, premium products such as those labelled as “Grass-Based”, or from a particular breed such as Angus, require methods to validate the system of production and make it less likely that counterfeit products are fraudulently sold under such labels. Several approaches have been examined in this regard (Monahan et al., 2018). Beef and milk from cattle offered pasture or concentrates have been distinguished based on their fatty acid composition (Alfaia et al., 2009; O’Callaghan et al., 2016). Our second objective was to confirm the potential of using the fatty acid profile to discriminate between grass- and concentrate-finished beef, between different sources of concentrate-finished beef and between beef from different sire breeds.
Materials and methods
Animal management and sampling procedures
This study was licensed by the Irish Government Department of Health and Children (B100/2483). All procedures complied with national regulations concerning experimentation on farm animals.
Spring-born calves of HF, AA and BB sires (mean birth date February 10, February 13 and February 27, respectively) were individually purchased on dairy farms following identification from artificial insemination records and were the progeny of at least five sires per breed. The calves were transferred from their farms of origin to Teagasc, Grange, County Meath, Ireland at 3 to 4 wk of age and reared according to standard methods (Fallon & Harte, 1987). The calves were turned out to pasture on May 17, castrated on September 20 and housed on October 7, when they were offered grass silage (206 g/kg dry matter [DM], 132 g/kg crude protein in the DM, 708 g/kg in vitro DM digestibility [DMD], pH 3.9) ad libitum plus 1 kg concentrates (875 g/kg rolled barley (Hordeum vulgare), 65 g/kg soya bean meal (Glycine max), 45 g/kg sugar cane (Saccharum officinarum L.) molasses and 15 g/kg mineral/vitamin premix) per head daily until January 19 when the concentrates were withdrawn. The animals were turned out to a predominantly perennial ryegrass (Lolium perenne) pasture for a second grazing season on March 23. More details are provided in Keane & Moloney (2010). On August 1 and 2, the cattle were weighed and based on the mean of these live weights were assigned to blocks of six within breed type. From within blocks they were assigned to three finishing strategies in a 3 (breed types) × 3 (finishing strategies) factorial arrangement of treatments. The finishing strategies were (i) pasture only for 94 d prior to slaughter (November 7), (Grass: pasture and early slaughter), (ii) concentrates ad libitum indoors for 94 d prior to slaughter (November 7) (EC; early concentrates) and (iii) pasture only for 94 d followed by concentrates ad libitum indoors for 98 d prior to slaughter (February 13) (LC; pasture and late concentrates). Indoor accommodation was in a slatted floor shed. The housed animals were initially offered grass silage ad libitum and the concentrate allowance was increased gradually to ad libitum intake over a 3-wk period. The concentrate composition was 585 g/kg rolled barley (Hordeum vulgare), 390 g/kg extruded full fat soya bean meal (Glycine max) and 25 g/kg mineral/vitamin premix (David Taylor, Animal Nutrition Ltd, Co. Westmeath, Ireland). While on ad libitum concentrates the animals were also offered 5 kg (1 kg DM approximately) grass silage per head daily to maintain normal rumen function. The grass silage offered was from a predominantly perennial ryegrass (Lolium perenne) sward, cut using a rotary mower, wilted for 24 h, harvested using a precision-chop harvester and ensiled in a bunker silo without an additive.
The animals finished on pasture were managed in a 7-paddock grazing rotation. They were offered an estimated daily herbage allowance of 14 kg DM above 4.5 cm sward stubble height. Samples of grass were collected prior to the cattle being moved to a new paddock and stored at −20 °C. Samples of concentrates and silage were collected weekly and stored at −20 °C. For chemical analysis, samples were composited on a 3-wk basis, that is, four samples of grass and eight samples each of concentrates and silage.
Post-slaughter carcass measurements and sampling
The animals were slaughtered in a commercial meat plant. After slaughter, cold carcass weight (hot weight × 0.98) was recorded. Carcass conformation and fat classes (EC, 2006) were measured using a Video Imaging Analysis carcass classification machine (VBS 2000, E + V Technology GmbH & Co. KG, Oranienburg, Germany). Carcasses were then chilled for 48 h and one sample of the longissimus muscle at the 10th–12th rib was collected, vacuum packed and stored at −20 °C for subsequent analysis.
Chemical analysis
Fat was extracted from 2 g homogenised longissimus muscle, separated into the neutral lipid (NL) and polar lipid (PL) fractions and fatty acids methylated as described by Moreno et al. (2008). Fatty acid methyl esters (FAME) were analysed using a Varian 3500 GLC (Varian, Harbor City, CA, USA) and a 100-m CP-Sil 88 column (100 m × 0.25 mm i.d., 0.2 μm film thickness, Supelco, Bellefonte, PA, USA). Hydrogen was the carrier gas and GC conditions were as described previously by Shingfield et al. (2003). Individual FAME were identified by retention time with reference to the external standards (Supelco 37 component FAME Mix, Supelco Inc., Bellefonte, PA, USA). Individual standards from Matreya (Matreya Inc., Pleasant Gap, PA, USA) were used for identification of FAME not contained in the mix. Fatty acids for which no commercial standards were available had been identified in identical chromatographic conditions as in the present study, by Shingfield et al. (2006) using 4,4-dimethyloxazoline derivatives and analysed by GC-MS. Appropriate retention times were used to identify these fatty acids in the present analysis. Individual FAME were quantified by using C23:0 as the internal standard. Selected nutritionally relevant indexes were calculated, according to Ulbricht & Southgate (1991).
The general composition of feeds was determined as previously described by Moloney & O’Kiely (1995). The fatty acid composition of feeds was determined using the procedure described by Sukhija & Palmquist (1988) with the minor modification that toluene was used instead of benzene (Moloney et al., 2020a).
Statistical analyses
Data were subjected to analysis of variance using Genstat (16th edition) using a model that had terms for block, breed type, finishing strategy and the breed type × finishing strategy interaction. Multivariate analysis of the fatty acid profile (proportional data) was also performed using Metaboanalyst (www.metaboanalyst.ca) (Chong et al., 2018). Supervised multivariate models were built using partial least squares – discriminant analysis (PLS-DA). As an initial analysis indicated a strong correlation between individual fatty acids and fatty acid classes (SFA, monounsaturated fatty acids [MUFA], PUFA) or ratios (PUFA:SFA, omega-3 PUFA:omega-6 PUFA) only individual fatty acids after data normalisation, were considered in the final analysis. To validate the models, a permutation test with 2000 repetitions was performed to check that the model differed from a random model. Also, the R2 (coefficient of determination) and Q2 (coefficient of prediction) parameters were obtained to assess the performance of the model using a 10-fold cross-validation approach. Scores plots are presented to show the discrimination between groups. Variable importance plots are also presented to show which variables have a larger influence on the latent variables of the built models. Differences, where stated, are statistically significant (P < 0.05, at least).
Results
Feed composition and carcass characteristics
The composition of the grass, grass silage and concentrate used is shown in Table 1. The main fatty acid in the grass and grass silage was C18:3. The concentrate tended to have a higher lipid concentration and proportions (of total fatty acids) of C16:0, C18:1 and C18:2 but a lower proportion of C18:3 than the forages.
The chemical composition (mean, sd) of the dietary ingredients
| Composition | Grass silage | Grass | Concentrate |
|---|---|---|---|
| Dry matter (DM, g/kg) | 206 (12.9) | 184 (34.8) | 860 (7.14) |
| pH | 3.9 (0.21) | − | − |
| Crude protein (g/kg DM) | 133 (12.0) | 153 (28.8) | 164 (11.5) |
| Ash (g/kg DM) | 98 (29.2) | 91 (11.2) | 64 (8.1) |
| DM digestibility (g/kg) | 738 (24.3) | 816 (23.6) | 863 (7.0) |
| Fatty acids (g/kg DM) | 20 (1.4) | 22 (5.2) | 32 (3.1) |
| g/kg fatty acids | |||
| C12:0 | 4.1 (0.35) | 3.6 (0.43) | 2.6 (4.0) |
| C14:0 | 5.8 (3.50) | 2.4 (1.26) | 3.8 (1.51) |
| C16:0 | 178.8 (3.57) | 159.1 (15.37) | 272.0 (11.70) |
| C16:1 | 6.3 (2.62) | 4.4 (2.23) | 1.7 (0.17) |
| C18:0 | 18.1 (2.19) | 16.1 (3.11) | 50.0 (4.76) |
| C18:1 | 35.2 (11.49) | 29.2 (6.25) | 287.7 (20.60) |
| C18:2 | 166.2 (3.00) | 127.2 (9.11) | 246.4 (33.48) |
| C18:3 | 429.3 (5.65) | 479.6 (4.76) | 16.2 (2.75) |
| C20:0 | 3.8 (0.24) | 2.4 (1.03) | 2.4 (0.32) |
| C22:0 | 11.1 (0.60) | 7.6 (0.93) | 10.4 (1.51) |
| SFA | 246.3 (5.66) | 215.8 (21.2) | 346.6 (14.81) |
| MUFA | 52.7 (16.74) | 43.3 (10.52) | 299.8 (27.14) |
| PUFA | 606.1 (5.26) | 615.1 (48.72) | 271.4 (31.73) |
MUFA = monounsaturated fatty acids; PUFA = polyunsaturated fatty acids; SFA = saturated fatty acids.
Animal performance is reported in detail by Keane & Moloney (2010). Carcass weight and fat classification are summarised here for reference. For HF, AA and BB, the carcass weight for Grass was 235, 240 and 257 kg, for EC 276, 289 and 298 kg and for LC 313, 324 and 350 kg, respectively. The corresponding values for fat classification were 1.67, 2.50 and 1.33 for Grass, 2.95, 2.83 and 2.33 for EC and 2.83, 3.35 and 2.83 for LC (where 5 = very fat and 1 = very little fat), respectively.
The fatty acid composition of muscle lipids
Total lipids
The total fatty acid concentration was lower for Grass compared to EC and for EC compared to LC (Table 2). Of the main fatty acids listed in Table 2 (>1 mg/100 g muscle for at least one treatment mean), the concentrations of C14:0, C14:1, C16:0, C16:1cis9, C18:0, C18:1cis11, C18:1cis13, C18:1cis9, C18:2cis9, cis12 (linoleic acid, LA), SFA, MUFA, PUFA and omega-6 PUFA were lower for Grass compared to EC whereas the concentrations of C15:1, C16:1trans7+C16:1trans8, C18:1trans11, C18:3cis9, cis12, cis 15 (linolenic acid, LNA), C20:5cis5,cis8,cis11,cis14,cis17 (eicosapentaenoic acid, EPA) C22:5cis7,cis10,cis13,cis16,cis19 (docosapentaenoic acid, DPA) and omega-3 PUFA were higher. The concentrations of C14:1, C15:1, C16:0, C16:1cis9, C16:1trans7+C16:1trans8, C18:1cis9, LA, LNA, DPA, SFA, MUFA, PUFA, omega-6 PUFA and omega-3 PUFA were higher for LC compared to EC.
Effect of sire breed type (Holstein-Friesian [HF], Angus [AA] or Belgian Blue [BB]) and finishing strategy (Grass, concentrates [EC] or concentrates after extended grazing [LC]) on the concentration of fatty acids (mg/100 g muscle) in longissimus muscle of steers
|
| HF | AA | BB |
| Significance | ||||||||
|---|---|---|---|---|---|---|---|---|---|---|---|---|---|
| Grass | EC | LC | Grass | EC | LC | Grass | EC | LC | s.e.d | Diet (D) | Breed (B) | D × B | |
| C14:0 | 26 | 62 | 67 | 32 | 84 | 89 | 20 | 33 | 46 | 11.0 | *** | *** | |
| C14:1 | 6 | 14 | 21 | 7 | 18 | 22 | 4 | 10 | 13 | 3.4 | *** | ** | |
| C15:0 | 12 | 13 | 14 | 12 | 17 | 17 | 10 | 7 | 10 | 2.1 | *** | ||
| C15:0anteiso | 6 | 4 | 5 | 5 | 5 | 5 | 5 | 3 | 3 | 1.0 | * | * | |
| C15:0iso | 5 | 3 | 4 | 5 | 4 | 4 | 5 | 1 | 2 | 0.8 | *** | ** | |
| C15:1 | 26 | 22 | 29 | 27 | 22 | 30 | 34 | 28 | 32 | 3.0 | ** | ** | |
| C16:1trans12 | 5 | 4 | 5 | 4 | 5 | 5 | 4 | 2 | 3 | 0.6 | *** | ||
| C16:0 | 511 | 818 | 931 | 556 | 1,035 | 1,164 | 381 | 473 | 661 | 102.9 | *** | *** | |
| C16:0iso | 5 | 4 | 5 | 5 | 4 | 5 | 3 | 2 | 4 | 0.7 | *** | *** | |
| C16:1cis91 | 54 | 101 | 122 | 62 | 132 | 145 | 36 | 61 | 85 | 14.0 | *** | *** | |
| C16:1trans7+trans8 | 11 | 8 | 11 | 10 | 11 | 11 | 9 | 5 | 7 | 1.4 | * | *** | |
| C16:2cis9,cis12 | 16 | 31 | 32 | 15 | 40 | 38 | 11 | 16 | 23 | 3.6 | *** | *** | * |
| C16:1cis13 | 1 | 3 | 4 | 1 | 4 | 4 | 0 | 5 | 3 | 1.6 | ** | ||
| C17:0 | 29 | 43 | 40 | 26 | 54 | 49 | 22 | 19 | 28 | 5.5 | *** | *** | ** |
| C17:0 iso+C16:1trans9 | 3 | 1 | 2 | 3 | 1 | 1 | 3 | 2 | 2 | 0.5 | *** | ||
| C17:1cis9 | 5 | 4 | 5 | 5 | 4 | 4 | 7 | 3 | 4 | 0.6 | *** | *** | |
| C18:0 | 479 | 550 | 622 | 475 | 692 | 735 | 350 | 338 | 422 | 75.4 | ** | *** | |
| C18:1trans11 | 69 | 30 | 48 | 59 | 43 | 43 | 54 | 18 | 27 | 9.5 | *** | ** | |
| C18:1cis152 | 3 | 6 | 6 | 2 | 7 | 6 | 2 | 3 | 4 | 0.9 | *** | *** | |
| C18:1cis16 | 4 | 5 | 4 | 2 | 5 | 3 | 4 | 3 | 3 | 1.0 | |||
| C18:1cis11 | 12 | 32 | 29 | 13 | 35 | 33 | 10 | 24 | 24 | 4.6 | *** | * | |
| C18:1cis12 | 1 | 6 | 4 | 1 | 7 | 5 | 0 | 4 | 4 | 1.4 | *** | ||
| C18:1cis13 | 3 | 10 | 12 | 3 | 11 | 12 | 2 | 6 | 9 | 2.1 | *** | * | |
| C18:1cis9 | 819 | 1,364 | 1,573 | 801 | 1,612 | 1,854 | 529 | 710 | 1,072 | 168.8 | *** | *** | |
| C18:1trans10 | 5 | 71 | 51 | 4 | 120 | 63 | 3 | 42 | 39 | 13.3 | *** | *** | * |
| C18:1trans12 | 2 | 1 | 0 | 1 | 1 | 0 | 2 | 2 | 0 | 1.0 | * | ||
| C18:1trans13 | 8 | 6 | 7 | 5 | 6 | 7 | 10 | 7 | 5 | 2.1 | |||
| C18:1trans16 | 5 | 4 | 4 | 5 | 5 | 5 | 4 | 3 | 3 | 1.0 | * | ||
| C18:1trans9 | 2 | 8 | 8 | 2 | 9 | 7 | 2 | 5 | 6 | 1.6 | *** | * | |
| C18:2,10,133 | 5 | 7 | 8 | 4 | 9 | 9 | 3 | 4 | 5 | 0.9 | *** | *** | |
| C18:2cis9, cis12 | 53 | 124 | 157 | 58 | 147 | 164 | 53 | 119 | 144 | 13.8 | *** | ||
| C18:2trans11,cis15 | 5 | 4 | 6 | 6 | 7 | 6 | 3 | 2 | 4 | 1.8 | ** | ||
| C18:3cis9,cis12,cis15 | 30 | 21 | 25 | 29 | 24 | 28 | 28 | 16 | 20 | 2.9 | *** | ** | |
| C18:3cis9,trans11,cis15 | 2 | 3 | 3 | 2 | 3 | 3 | 2 | 3 | 2 | 0.4 | ** | * | |
| C18:0iso | 2 | 2 | 5 | 3 | 4 | 5 | 0 | 1 | 3 | 0.9 | *** | *** | |
| C18:2trans12,cis15 | 1 | 11 | 6 | 1 | 1 | 6 | 1 | 1 | 4 | 4.6 | |||
| C20:0 | 4 | 3 | 4 | 4 | 4 | 4 | 2 | 2 | 2 | 0.7 | *** | ||
| C20:1cis11 | 3 | 6 | 8 | 4 | 7 | 9 | 1 | 4 | 6 | 1.4 | *** | *** | |
| C20:2cis11,cis14 | 2 | 2 | 3 | 2 | 2 | 3 | 1 | 2 | 3 | 0.6 | *** | ||
| C20:3cis8,cis11,cis14 | 4 | 4 | 7 | 4 | 4 | 6 | 4 | 5 | 7 | 0.6 | *** | ||
| C20:4cis5,cis8,cis11,cis14 | 12 | 12 | 13 | 12 | 10 | 12 | 14 | 14 | 14 | 1.2 | ** | ||
| C20:5cis5,cis8,cis11,cis14,cis17 | 8 | 4 | 5 | 6 | 3 | 6 | 10 | 4 | 6 | 0.8 | *** | * | * |
| C22:0 | 1 | 1 | 1 | 1 | 1 | 1 | 1 | 0 | 1 | 0.3 | * | ||
| C22:1cis11 | 1 | 4 | 3 | 2 | 4 | 2 | 0 | 2 | 2 | 0.7 | *** | ** | |
| C22:5cis7,cis10,cis13,cis16,cis19 | 9 | 6 | 7 | 9 | 5 | 9 | 10 | 8 | 10 | 1.5 | ** | ||
| C22:6cis4,cis7,cis10,cis13,cis16,cis19 | 1 | 0 | 0 | 1 | 0 | 0 | 1 | 1 | 1 | 0.2 | *** | *** | |
| C27:0 | 3 | 3 | 1 | 0 | 3 | 1 | 6 | 1 | 0 | 1.7 | * | * | |
| CLA (C18:2trans10,cis12) | 1 | 1 | 1 | 1 | 1 | 1 | 0 | 0 | 1 | 0.4 | ** | ||
| CLA (C18:2cis9, trans11) | 15 | 12 | 16 | 13 | 17 | 17 | 10 | 7 | 10 | 2.0 | *** | ||
| Others | 97 | 126 | 156 | 129 | 140 | 187 | 53 | 85 | 118 | 26.5 | ** | *** | |
| Total | 2,407 | 3,592 | 4,106 | 2,448 | 4,394 | 4,852 | 1,740 | 2,122 | 2,907 | 424.2 | *** | *** | |
| SFA | 1,087 | 1,506 | 1,699 | 1,127 | 1,907 | 2,080 | 808 | 884 | 1,183 | 190.4 | *** | *** | |
| MUFA | 1,047 | 1,710 | 1,955 | 1,020 | 2,067 | 2,272 | 716 | 948 | 1,350 | 204.5 | *** | *** | |
| PUFA | 176 | 250 | 296 | 171 | 281 | 314 | 163 | 205 | 256 | 22.9 | *** | ** | |
| n-3 PUFA | 52 | 36 | 45 | 50 | 37 | 49 | 54 | 33 | 43 | 4.1 | *** | ||
| n-6 PUFA | 89 | 166 | 198 | 90 | 182 | 205 | 86 | 148 | 177 | 15.5 | *** | * | |
| PUFA: SFA | 0.17 | 0.17 | 0.19 | 0.18 | 0.15 | 0.15 | 0.21 | 0.24 | 0.22 | 0.016 | *** | ||
| n-6:n-3 PUFA | 1.72 | 4.85 | 4.52 | 1.81 | 5.01 | 4.17 | 1.62 | 4.51 | 4.16 | 0.327 | *** | ||
| Desaturase index4 | 0.63 | 0.71 | 0.72 | 0.63 | 0.70 | 0.71 | 0.59 | 0.68 | 0.72 | 0.021 | *** | ||
| Atherogenic index5 | 0.50 | 0.55 | 0.52 | 0.56 | 0.58 | 0.60 | 0.53 | 0.52 | 0.52 | 0.031 | ** | ||
| Thrombogenic index6 | 1.35 | 1.32 | 1.26 | 1.44 | 1.39 | 1.38 | 1.30 | 1.24 | 1.21 | 0.067 | ** | ||
1In this and subsequent tables, s.e.d. is the standard error of the difference for the diet * breed interaction with n = 6/group.
2Co-eluted with C17:0 anteiso; 3co-eluted with C18:2,10,14 and C19:0; 3co-eluted with C18:2,11,14.
4Calculated as (14:1 + 16:1 + 18:1)/14:0 + 16:0 + 18:0 + 14:1 + 16:1 + 18:1).
5Atherogenic index = (12:0 + 4 × 14:0 + 16:0)/(∑MUFA + ∑n − 6 + ∑n − 3).
6Thrombogenic index = (14:0 + 16:0 + 18:0)/((0.5 × ∑MUFA + 0.5 × ∑n − 6 + 3 × ∑n − 3 + ∑n − 3)/(∑n − 6)).
CLA = conjugated linoleic acid; MUFA = monounsaturated fatty acids; PUFA = polyunsaturated fatty acids; SFA = saturated fatty acids.
With regard to breed type, the total fatty acid concentration was higher for AA compared to HF and for HF compared to BB. Of the main fatty acids listed in Table 2, the concentrations of C14:0, C15:0, C16:0, C16:1cis9, C18:0 and SFA were higher for AA compared to HF and for HF compared to BB. The concentrations of C14:1, C16:1trans7+C16:1trans8, C18:1 trans11, C18:1cis13, C18:1cis9, LNA, C18:2 cis9, trans11 (CLA), MUFA and PUFA were similar for AA and HF but higher for both compared to BB. The concentration of C15:1 was similar for AA and HF but lower for both compared to BB. The concentrations of C18:1cis11 and omega-6 PUFA were higher for AA compared to BB. The concentration of C20:4cis5,cis8,cis11,cis14 was lower for AA than HF and for HF compared to BB.
There were several interactions between diet and breed. For AA and HF, the concentration of C16:2cis9,cis12 in Grass was lower compared to EC and LC which did not differ; whereas for BB, the concentration in Grass was similar to EC which was lower than LC. For AA and HF, the concentration of C17:0 in Grass was lower compared to EC and LC which did not differ whereas for BB, the concentration was similar in Grass, EC and LC. For C18:1trans10, the concentration was similar for each breed for Grass and lower than that for EC. For both AA and HF, the concentration in EC was lower than that for LC, but EC and LC did not differ for BB. The concentration of EPA was higher for BB in Grass compared to AA and HF but similar for each breed for EC and LC.
With regard to nutritional indices, the omega-6:omega-3 PUFA ratio was lower for Grass compared to EC and higher for EC compared to LC. The desaturase index was lower for Grass compared to EC and LC which did not differ. The PUFA:SFA ratio was lower for AA than for HF and for HF compared to BB. The atherogenic and thrombogenic indices were higher for AA compared to HF and BB which did not differ.
Only those fatty acids detected at >0.1 g/100 g fatty acids (for at least one treatment mean) are summarised in Table 3. The proportions of C14:0, C14:1, C16:0, C16:1cis9, C16:2cis9, cis12, C18:1cis15, C18:1cis13, C18:1cis9, C18:1 trans9, C20:1cis11 and omega-6 PUFA were lower for Grass compared to EC and LC which did not differ. The proportions of C15:0anteiso, C15:1, C16:1trans12, C17:0iso+C16:1trans9, C18:0, C18:1trans11, C18:1trans13, C18:1trans16, C18:2trans11,cis15, C20:0, C20:3, C20:4, DPA, C22:6cis4, cis7, cis10, cis13, cis16, cis19 (docosahexaenoic acid, DHA), C18:2cis9, trans11 CLA and SFA were higher for Grass compared to EC and LC which did not differ. The proportions of C18:1cis11, C18:1cis12 and C18:1trans10 were lower for Grass than for EC but higher for EC compared to LC. The proportion of MUFA was higher for Grass than for EC and LC which did not differ. The proportion of C16:0iso was higher for Grass compared to EC, which in turn was higher than LC.
Effect of sire breed type (Holstein-Friesian [HF], Angus [AA] or Belgian Blue [BB]) and finishing strategy (Grass, concentrates [EC] or concentrates after extended grazing [LC]) on the proportion of fatty acids (g/100g fatty acids) in the longissimus muscle of steers
|
| HF | AA | BB |
| Significance | ||||||||
|---|---|---|---|---|---|---|---|---|---|---|---|---|---|
| GRASS | EC | LC | GRASS | EC | LC | GRASS | EC | LC | s.e.d. | Diet (D) | Breed B) | D × B | |
| C14:0 | 1.05 | 1.72 | 1.54 | 1.24 | 1.90 | 1.85 | 1.14 | 1.52 | 1.55 | 0.180 | *** | * | |
| C14:1 | 0.22 | 0.41 | 0.47 | 0.28 | 0.41 | 0.46 | 0.20 | 0.47 | 0.46 | 0.060 | *** | ||
| C15:0 | 0.47 | 0.35 | 0.35 | 0.44 | 0.38 | 0.36 | 0.59 | 0.33 | 0.35 | 0.036 | *** | ** | |
| C15:0anteiso | 0.24 | 0.10 | 0.11 | 0.20 | 0.11 | 0.10 | 0.26 | 0.15 | 0.09 | 0.028 | *** | ||
| C15:1 | 1.22 | 0.62 | 0.77 | 1.19 | 0.51 | 0.67 | 2.11 | 1.38 | 1.11 | 0.216 | *** | *** | |
| C15:0iso | 0.22 | 0.08 | 0.09 | 0.19 | 0.08 | 0.08 | 0.26 | 0.06 | 0.07 | 0.018 | *** | ** | |
| C16:1trans12 | 0.20 | 0.11 | 0.11 | 0.17 | 0.10 | 0.09 | 0.22 | 0.11 | 0.11 | 0.011 | *** | ** | |
| C16:0 | 21.20 | 22.80 | 22.36 | 22.55 | 23.45 | 24.21 | 21.93 | 22.19 | 22.69 | 0.689 | * | ** | |
| C16:0iso | 0.19 | 0.10 | 0.13 | 0.20 | 0.09 | 0.10 | 0.19 | 0.12 | 0.12 | 0.014 | *** | ||
| C16:1cis91 | 2.24 | 2.83 | 2.93 | 2.56 | 3.02 | 3.02 | 2.02 | 2.91 | 2.95 | 0.208 | *** | ||
| C16:1trans7+trans8 | 0.47 | 0.23 | 0.27 | 0.40 | 0.24 | 0.23 | 0.50 | 0.21 | 0.23 | 0.027 | *** | * | |
| C16:2cis9,cis12 | 0.67 | 0.86 | 0.81 | 0.63 | 0.90 | 0.78 | 0.61 | 0.75 | 0.80 | 0.065 | *** | ||
| C16:1cis13 | 0.03 | 0.09 | 0.09 | 0.05 | 0.08 | 0.09 | 0.02 | 0.13 | 0.10 | 0.078 | |||
| C17:0 | 1.20 | 1.18 | 1.01 | 1.02 | 1.22 | 1.00 | 1.22 | 0.88 | 0.96 | 0.101 | * | * | |
| C17:0iso+C16:1trans9 | 0.14 | 0.04 | 0.05 | 0.14 | 0.03 | 0.03 | 0.19 | 0.09 | 0.05 | 0.022 | *** | *** | |
| C17:1cis9 | 0.25 | 0.11 | 0.12 | 0.22 | 0.10 | 0.09 | 0.41 | 0.15 | 0.13 | 0.032 | *** | *** | ** |
| C18:0 | 19.72 | 15.35 | 15.13 | 19.26 | 15.57 | 15.20 | 20.32 | 15.76 | 14.49 | 1.134 | *** | ||
| C18:1trans11 | 2.83 | 0.84 | 1.15 | 2.28 | 0.97 | 0.89 | 2.99 | 0.88 | 0.92 | 0.242 | *** | ||
| C18:1cis152 | 0.11 | 0.15 | 0.16 | 0.10 | 0.16 | 0.13 | 0.10 | 0.16 | 0.14 | 0.024 | *** | ||
| C18:1cis16 | 0.18 | 0.13 | 0.11 | 0.08 | 0.11 | 0.07 | 0.24 | 0.12 | 0.11 | 0.035 | ** | ** | * |
| C18:1cis11 | 0.52 | 0.84 | 0.72 | 0.54 | 0.81 | 0.69 | 0.59 | 1.15 | 0.84 | 0.086 | *** | ** | |
| C18:1cis12 | 0.06 | 0.15 | 0.12 | 0.05 | 0.16 | 0.10 | 0.02 | 0.21 | 0.13 | 0.034 | *** | ||
| C18:1cis13 | 0.12 | 0.28 | 0.29 | 0.12 | 0.25 | 0.25 | 0.09 | 0.29 | 0.30 | 0.037 | *** | ||
| C18:1cis9 | 34.10 | 37.91 | 38.26 | 32.90 | 36.71 | 37.79 | 29.81 | 33.44 | 36.83 | 1.343 | *** | *** | |
| C18:1trans10 | 0.20 | 1.94 | 1.32 | 0.17 | 2.74 | 1.24 | 0.15 | 1.87 | 1.34 | 0.306 | *** | ||
| C18:1trans13 | 0.37 | 0.18 | 0.17 | 0.23 | 0.16 | 0.14 | 0.54 | 0.31 | 0.16 | 0.073 | *** | *** | |
| C18:1trans16 | 0.21 | 0.10 | 0.11 | 0.18 | 0.11 | 0.10 | 0.23 | 0.12 | 0.10 | 0.022 | *** | ||
| C18:1trans9 | 0.08 | 0.22 | 0.21 | 0.06 | 0.20 | 0.13 | 0.09 | 0.20 | 0.20 | 0.041 | *** | ||
| C18:2,10,133 | 0.19 | 0.19 | 0.20 | 0.16 | 0.20 | 0.18 | 0.15 | 0.17 | 0.18 | 0.016 | * | ||
| C18:2cis9,cis12 | 2.30 | 3.53 | 4.02 | 2.47 | 3.42 | 3.44 | 3.20 | 5.74 | 5.00 | 0.373 | *** | *** | * |
| C18:2trans11,cis15 | 0.30 | 0.12 | 0.18 | 0.26 | 0.19 | 0.14 | 0.31 | 0.15 | 0.15 | 0.056 | * | ||
| C18:3cis9,cis12,cis15 | 1.27 | 0.58 | 0.61 | 1.19 | 0.55 | 0.57 | 1.65 | 0.74 | 0.69 | 0.074 | *** | *** | * |
| C18:3cis9,trans11,cis15 | 0.08 | 0.08 | 0.07 | 0.10 | 0.07 | 0.06 | 0.09 | 0.11 | 0.08 | 0.018 | |||
| C18:0iso | 0.08 | 0.07 | 0.12 | 0.13 | 0.09 | 0.10 | 0.00 | 0.05 | 0.09 | 0.025 | * | *** | * |
| C18:2:trans12,cis15 | 0.05 | 0.22 | 0.13 | 0.04 | 0.02 | 0.12 | 0.03 | 0.05 | 0.13 | 0.094 | |||
| C20:0 | 0.14 | 0.08 | 0.09 | 0.13 | 0.08 | 0.09 | 0.14 | 0.08 | 0.07 | 0.013 | *** | ||
| C20:1cis11 | 0.13 | 0.17 | 0.18 | 0.14 | 0.18 | 0.19 | 0.07 | 0.17 | 0.19 | 0.022 | ** | ||
| C20:3cis8,cis11,cis14 | 0.18 | 0.12 | 0.19 | 0.18 | 0.10 | 0.14 | 0.26 | 0.26 | 0.23 | 0.029 | * | *** | |
| C20:4cis5,cis8,cis11,cis14 | 0.57 | 0.35 | 0.34 | 0.50 | 0.24 | 0.26 | 0.89 | 0.65 | 0.51 | 0.075 | *** | *** | |
| C20:5cis5,cis8,cis11,cis14,cis17 | 0.37 | 0.11 | 0.14 | 0.28 | 0.07 | 0.13 | 0.70 | 0.19 | 0.21 | 0.055 | *** | *** | * |
| C22:1cis11 | 0.05 | 0.11 | 0.07 | 0.06 | 0.09 | 0.05 | 0.01 | 0.08 | 0.07 | 0.020 | *** | ||
| C22:5cis7,cis10,cis13,cis16, cis19 | 0.38 | 0.20 | 0.19 | 0.40 | 0.14 | 0.20 | 0.70 | 0.36 | 0.34 | 0.069 | *** | *** | |
| C22:6cis4,cis7,cis10,cis13, cis16,cis19 | 0.04 | 0.01 | 0.01 | 0.04 | 0.00 | 0.01 | 0.07 | 0.03 | 0.03 | 0.007 | *** | *** | |
| C27:0 | 0.17 | 0.09 | 0.02 | 0.01 | 0.07 | 0.01 | 0.39 | 0.05 | 0.01 | 0.063 | ** | *** | *** |
| CLA (C18:2cis9,trans11) | 0.61 | 0.34 | 0.40 | 0.51 | 0.38 | 0.34 | 0.54 | 0.30 | 0.33 | 0.048 | *** | ||
| Others | 3.83 | 3.60 | 3.78 | 5.39 | 3.30 | 3.83 | 3.12 | 4.14 | 4.05 | 0.592 | ** | ||
| SFA | 44.88 | 41.98 | 41.01 | 45.55 | 43.08 | 43.15 | 46.66 | 41.35 | 40.59 | 1.302 | *** | ||
| MUFA | 43.70 | 47.45 | 47.67 | 41.87 | 47.12 | 46.45 | 40.50 | 44.66 | 46.44 | 1.268 | *** | ** | |
| PUFA | 7.58 | 6.97 | 7.54 | 7.18 | 6.50 | 6.57 | 9.70 | 9.85 | 8.93 | 0.528 | *** | ||
| n-3 PUFA | 2.26 | 1.00 | 1.14 | 2.10 | 0.84 | 1.04 | 3.25 | 1.59 | 1.49 | 0.157 | *** | *** | * |
| n-6 PUFA | 3.88 | 4.62 | 5.05 | 3.79 | 4.24 | 4.30 | 5.18 | 7.09 | 6.17 | 0.417 | *** | *** | |
1Co-eluted with C17:0 anteiso.
2Co-eluted with C18:2,10,14 and C19:0.
3Co-eluted with C18:2,11,14.
CLA = conjugated linoleic acid; MUFA = monounsaturated fatty acids; PUFA = polyunsaturated fatty acids; SFA = saturated fatty acids.
With regard to breed type, the proportions of C15:1, C17:0iso, C18:1cis11 C18:1trans13, C20:3, C22:5, DHA, PUFA and n-6 PUFA were similar for AA and HF but lower than for BB. The proportions of C18:1cis9 and C18:2,10,13 were similar for AA and HF but higher than for BB. For the MUFA proportion, AA was similar to BB and HF but HF was higher than BB. The proportions of C14:0 and C16:0 were higher for AA than for HF which was similar to BB. The proportion of C16:1trans12 was lower for AA than for HF and BB which did not differ, while the proportion of C20:4 was lower for AA than for HF and for HF compared to BB.
There were several interactions between breed and diet. For the proportion of C15:0, Grass was higher than for EC and LC but BB was higher than for HF and AA on Grass only. For the proportion of C17:0, Grass was similar to EC and greater than for LC, BB was higher than AA on Grass but lower than AA on EC. For the proportion of LA, Grass was lower for EC and LC for AA and HF, but Grass was lower in BB for LC, which was lower than EC. For the proportions of LNA and EPA, Grass was higher than EC and LC but the difference was greater in BB compared to AA and HF.
Neutral lipids
The total fatty acid concentration in the NL fraction was lower for Grass than for EC and for EC compared to LC (Table 4). Only those fatty acids detected at >0.1 g/100 g fatty acids (for at least one treatment mean) are summarised in Table 4. The proportions of C14:0, C14:1, C16:1cis9, C16:2cis9, cis12, C18:1cis15, C18:1cis13, C18:1 trans9, LA, MUFA and the PUFA:SFA ratio were lower for Grass than for EC and LC which did not differ. The proportions of C15:0anteiso, C18:0, C18:1trans16, LNA, C20:0, DPA, CLA, SFA and omega-3 PUFA were higher for Grass than for EC and LC which did not differ. The proportions of C18:1cis11, C18:1cis12, C18:1trans10, omega-6 PUFA and the omega-6:omega-3 PUFA ratio were lower for Grass than for EC but higher for EC compared to LC. The proportion of PUFA was higher for EC than for Grass and LC, which did not differ. The proportion of C18:1cis 9 was lower for Grass than for EC and lower for EC compared to LC.
Effect of sire breed type (Holstein-Friesian [HF], Angus [AA] or Belgian Blue [BB]) and finishing strategy (Grass, concentrates [EC] or concentrates after extended grazing [LC]) on the total fatty acid concentration and the proportion of individual fatty acid (g/100g fatty acids) in the neutral lipids of the longissimus muscle from steers
|
| HF | AA | BB |
| Significance | ||||||||
|---|---|---|---|---|---|---|---|---|---|---|---|---|---|
| Grass | EC | LC | Grass | EC | LC | Grass | EC | LC | s.e.d. | Diet (D) | Breed (B) | D × B | |
| C14:0 | 1.17 | 1.82 | 1.67 | 1.36 | 1.99 | 1.98 | 1.37 | 1.74 | 1.74 | 0.198 | *** | ||
| C14:1 | 0.26 | 0.44 | 0.51 | 0.33 | 0.43 | 0.50 | 0.27 | 0.55 | 0.51 | 0.065 | *** | ||
| C15:0 | 0.51 | 0.37 | 0.38 | 0.48 | 0.40 | 0.38 | 0.68 | 0.37 | 0.39 | 0.040 | *** | * | ** |
| C15:0anteiso | 0.26 | 0.10 | 0.12 | 0.23 | 0.11 | 0.11 | 0.34 | 0.17 | 0.11 | 0.037 | * | * | |
| C15:0iso | 0.25 | 0.08 | 0.10 | 0.21 | 0.08 | 0.09 | 0.32 | 0.07 | 0.08 | 0.019 | *** | * | *** |
| C16:1trans12 | 0.19 | 0.10 | 0.12 | 0.16 | 0.11 | 0.10 | 0.23 | 0.11 | 0.11 | 0.012 | *** | ** | ** |
| C16:0 | 21.46 | 22.82 | 22.34 | 22.81 | 23.42 | 24.41 | 22.82 | 22.43 | 23.02 | 0.766 | * | ||
| C16:0is0 | 0.20 | 0.09 | 0.11 | 0.18 | 0.09 | 0.09 | 0.23 | 0.09 | 0.09 | 0.013 | *** | * | |
| C16:1cis9 | 2.42 | 2.97 | 3.15 | 2.76 | 3.14 | 3.20 | 2.29 | 3.32 | 3.26 | 0.231 | *** | ||
| C16:1cis13 | 0.04 | 0.10 | 0.10 | 0.05 | 0.09 | 0.10 | 0.02 | 0.31 | 0.11 | 0.089 | * | ** | |
| C16:1trans7+C16:1trans8 | 0.47 | 0.23 | 0.27 | 0.40 | 0.25 | 0.24 | 0.50 | 0.20 | 0.23 | 0.029 | *** | * | |
| C16:2 cis9, cis12 | 0.64 | 0.87 | 0.84 | 0.60 | 0.92 | 0.80 | 0.56 | 0.80 | 0.84 | 0.072 | *** | ||
| C17:0 | 1.29 | 1.23 | 1.08 | 1.09 | 1.26 | 1.06 | 1.40 | 0.96 | 1.05 | 0.111 | ** | ** | |
| C18:0 | 21.68 | 16.06 | 16.10 | 21.15 | 16.16 | 15.96 | 24.22 | 17.68 | 15.74 | 1.366 | *** | ||
| C18:1 trans11 | 3.18 | 0.86 | 1.21 | 2.53 | 0.97 | 0.93 | 3.65 | 0.89 | 0.97 | 0.273 | *** | * | |
| C18:1cis151 | 0.13 | 0.17 | 0.18 | 0.11 | 0.17 | 0.14 | 0.12 | 0.18 | 0.15 | 0.027 | ** | ||
| C18:1cis16 | 0.19 | 0.14 | 0.12 | 0.08 | 0.12 | 0.07 | 0.27 | 0.13 | 0.13 | 0.040 | ** | ** | * |
| C18:1cis11 | 0.50 | 0.78 | 0.62 | 0.51 | 0.73 | 0.59 | 0.54 | 0.98 | 0.67 | 0.086 | *** | * | |
| C18:1cis12 | 0.08 | 0.14 | 0.10 | 0.06 | 0.14 | 0.09 | 0.01 | 0.14 | 0.09 | 0.032 | *** | ||
| C18:1cis13 | 0.14 | 0.30 | 0.31 | 0.14 | 0.27 | 0.27 | 0.11 | 0.34 | 0.33 | 0.041 | *** | ||
| C18:1cis9 | 35.73 | 39.34 | 40.28 | 34.09 | 37.73 | 39.32 | 32.22 | 36.84 | 39.80 | 1.511 | *** | * | |
| C18:1trans10 | 0.22 | 2.06 | 1.45 | 0.19 | 2.87 | 1.33 | 0.18 | 2.15 | 1.51 | 0.323 | *** | ||
| C18:1trans13 | 0.40 | 0.16 | 0.19 | 0.24 | 0.14 | 0.15 | 0.65 | 0.35 | 0.18 | 0.085 | *** | *** | * |
| C18:1trans16 | 0.25 | 0.11 | 0.12 | 0.21 | 0.11 | 0.10 | 0.31 | 0.14 | 0.11 | 0.025 | *** | * | |
| C18:1trans9 | 0.09 | 0.23 | 0.23 | 0.08 | 0.21 | 0.14 | 0.11 | 0.24 | 0.22 | 0.045 | *** | ||
| C18:2,10,132 | 0.23 | 0.21 | 0.21 | 0.19 | 0.22 | 0.19 | 0.20 | 0.20 | 0.20 | 0.017 | |||
| C18:2cis9,cis12 | 1.27 | 2.37 | 2.14 | 1.39 | 2.42 | 1.95 | 1.22 | 2.56 | 2.35 | 0.266 | *** | ||
| C18:2trans11,cis15 | 0.23 | 0.10 | 0.16 | 0.28 | 0.17 | 0.13 | 0.20 | 0.10 | 0.15 | 0.063 | ** | ||
| C18:3cis9,cis12,cis15 | 0.87 | 0.47 | 0.49 | 0.84 | 0.46 | 0.46 | 0.86 | 0.46 | 0.47 | 0.055 | *** | ||
| C18:2trans12,cis15 | 0.05 | 0.24 | 0.14 | 0.04 | 0.03 | 0.13 | 0.02 | 0.05 | 0.14 | 0.101 | |||
| C20:0 | 0.15 | 0.09 | 0.10 | 0.15 | 0.08 | 0.09 | 0.17 | 0.09 | 0.08 | 0.013 | *** | ||
| C20:1cis11 | 0.13 | 0.18 | 0.18 | 0.14 | 0.19 | 0.19 | 0.06 | 0.16 | 0.18 | 0.026 | *** | * | |
| C20:4cis5,cis8,cis11,cis14 | 0.07 | 0.12 | 0.03 | 0.14 | 0.09 | 0.02 | 0.01 | 0.10 | 0.04 | 0.046 | * | ||
| C22:1cis11 | 0.06 | 0.12 | 0.07 | 0.07 | 0.09 | 0.05 | 0.01 | 0.09 | 0.07 | 0.021 | *** | * | |
| C22:5cis7,cis10,cis13,cis16,cis19 | 0.10 | 0.06 | 0.03 | 0.11 | 0.04 | 0.02 | 0.12 | 0.05 | 0.03 | 0.028 | *** | ||
| CLA (C18:2,cis9,trans11) | 0.68 | 0.37 | 0.44 | 0.56 | 0.40 | 0.36 | 0.64 | 0.34 | 0.37 | 0.050 | *** | ||
| Others | 3.12 | 3.35 | 3.67 | 4.99 | 3.21 | 3.72 | 1.71 | 3.80 | 3.90 | 0.714 | ** | ||
| SFA | 47.45 | 42.89 | 42.20 | 47.91 | 43.81 | 44.33 | 52.20 | 43.76 | 42.47 | 1.537 | ** | ||
| MUFA | 44.72 | 48.57 | 49.31 | 42.43 | 47.88 | 47.59 | 41.76 | 47.36 | 48.72 | 1.451 | *** | ||
| PUFA | 4.72 | 5.19 | 4.83 | 4.67 | 5.10 | 4.36 | 4.33 | 5.08 | 4.92 | 0.382 | * | ||
| n-3 PUFA | 1.03 | 0.57 | 0.56 | 1.06 | 0.54 | 0.53 | 0.99 | 0.57 | 0.56 | 0.084 | *** | ||
| n-6 PUFA | 2.19 | 3.22 | 2.84 | 2.30 | 3.09 | 2.56 | 1.99 | 3.26 | 3.00 | 0.260 | *** | ||
| PUFA:SFA | 0.10 | 0.12 | 0.12 | 0.10 | 0.12 | 0.10 | 0.08 | 0.12 | 0.12 | 0.010 | ** | ||
| n-6:n-3 PUFA | 2.16 | 5.78 | 5.23 | 2.19 | 5.63 | 4.91 | 2.04 | 5.80 | 5.37 | 0.312 | *** | ||
| Total fatty acids (mg/g muscle) | 2,047 | 3,313 | 3,788 | 2,124 | 4,173 | 4,512 | 1,339 | 1,825 | 2,592 | 427.8 | *** | *** | |
1co-eluted with C18:2,10,14 and C19:0; 2co-eluted with C18:2, 11,14.
CLA = conjugated linoleic acid; MUFA = monounsaturated fatty acids; PUFA = polyunsaturated fatty acids; SFA = saturated fatty acids.
With regard to breed type, the total fatty acid concentration in the NL fraction was higher for AA than for HF and for HF compared to BB. The proportions of C15:0anteiso and C18:1cis11 were similar for AA and HF but lower than for BB. The proportions of C18:1cis9 and C20:1cis11 were similar for AA and HF but higher than for BB. The proportion of C16:0 was higher for AA than for HF which was similar to BB. The proportion of C18:1trans16 was similar for AA and HF and for HF and BB but was lower for AA than for BB.
There were several interactions between diet and breed. For the proportions of C15:0, C16:1trans12, C16:0iso, C16:1trans7+trans8, C18:1trans 11, C18:1cis16 and C18:1trans13, Grass was higher than EC and LC which did not differ. There was little difference between breeds for EC and LC but for Grass, BB generally tended to be higher than HF which tended to be higher than AA.
Polar lipids
The total fatty acid concentration in the PL fraction was higher for Grass than for EC, which in turn was similar to LC (Table 5). Only those fatty acids detected at >0.1 g/100 g fatty acids (for at least one treatment mean) are summarised in Table 5. The proportion of C18:1cis11 and the omega-6:omega-3 PUFA ratio was lower for Grass than for EC and LC, which did not differ. The proportions of C15:0, C16:1trans12, C16:1trans7+trans8, C17:0 iso+C16:1trans9, C18:0, C18:1cis9, LNA, C20:4n-3, EPA, DHA, CLA and omega-3 PUFA were higher for Grass than for EC and LC which did not differ. The proportions of C16:0 and C18:1cis12 were lower for Grass than for EC but higher for EC compared to LC. The proportions of C16:1cis9, C16:2, C17:0, C18:1trans13 and MUFA were higher for Grass than for EC and for EC compared to LC. The proportions of LA, C20:3, PUFA and PUFA:SFA ratio were lower for Grass than for EC and for EC compared to LC. The proportions of C14:0 and SFA were similar for Grass and EC and similar for EC and LC, but Grass was higher than LC.
Effect of sire breed type (Holstein-Friesian [HF], Angus [AA] or Belgian Blue [BB]) and finishing strategy (Grass, concentrates [EC] or concentrates after extended grazing [LC]) on the total fatty acid concentration and the proportion of individual fatty acids (g/100g fatty acids) in the polar lipids of the longissimus muscle from steers
|
| HF | AA | BB |
| Significance | ||||||||
|---|---|---|---|---|---|---|---|---|---|---|---|---|---|
| Grass | EC | LC | Grass | EC | LC | Grass | EC | LC | s.e.d. | Diet (D) | Breed (B) | D × B | |
| C14:0 | 0.31 | 0.39 | 0.07 | 0.43 | 0.11 | 0.25 | 0.38 | 0.20 | 0.05 | 0.151 | * | ||
| C15:0 | 0.25 | 0.12 | 0.02 | 0.24 | 0.02 | 0.05 | 0.31 | 0.10 | 0.03 | 0.040 | *** | ||
| C15:1 | 7.91 | 8.35 | 9.13 | 8.50 | 9.81 | 8.93 | 8.88 | 9.43 | 9.97 | 0.927 | |||
| C16:1trans12 | 0.24 | 0.10 | 0.05 | 0.23 | 0.00 | 0.01 | 0.21 | 0.10 | 0.08 | 0.032 | *** | * | |
| C16:0 | 20.09 | 22.48 | 22.50 | 21.11 | 23.90 | 22.17 | 19.12 | 20.78 | 20.12 | 0.546 | *** | *** | |
| C16:0iso | 0.15 | 0.22 | 0.30 | 0.34 | 0.00 | 0.24 | 0.06 | 0.26 | 0.39 | 0.071 | ** | *** | |
| C16:1cis9 | 1.21 | 0.93 | 0.60 | 1.38 | 0.66 | 0.66 | 1.10 | 0.65 | 0.47 | 0.173 | *** | ||
| C16:1trans7+C16:1trans8 | 0.47 | 0.18 | 0.20 | 0.41 | 0.12 | 0.14 | 0.49 | 0.29 | 0.21 | 0.063 | *** | * | |
| C16:2cis9,cis12 | 0.83 | 0.62 | 0.46 | 0.83 | 0.57 | 0.44 | 0.75 | 0.50 | 0.46 | 0.071 | *** | ||
| C17:0 | 0.68 | 0.56 | 0.29 | 0.57 | 0.45 | 0.30 | 0.69 | 0.43 | 0.23 | 0.087 | *** | ||
| C17:0 iso+C16:1trans9 | 0.54 | 0.15 | 0.17 | 0.47 | 0.02 | 0.06 | 0.58 | 0.32 | 0.23 | 0.066 | *** | *** | |
| C17:1cis9 | 1.03 | 0.75 | 0.82 | 0.52 | 0.78 | 0.72 | 1.43 | 0.80 | 0.87 | 0.152 | * | *** | ** |
| C18:0 | 8.84 | 6.42 | 4.70 | 8.01 | 4.47 | 5.67 | 8.69 | 4.66 | 4.48 | 1.554 | *** | ||
| C18:1trans11 | 0.92 | 0.55 | 0.48 | 0.71 | 1.01 | 0.50 | 0.91 | 0.79 | 0.55 | 0.284 | |||
| C18:1cis11 | 0.71 | 1.75 | 1.77 | 0.75 | 2.38 | 1.90 | 0.77 | 2.12 | 2.20 | 0.219 | *** | * | |
| C18:1cis12 | 0.01 | 0.34 | 0.29 | 0.03 | 0.68 | 0.27 | 0.02 | 0.60 | 0.47 | 0.109 | *** | * | |
| C18:1cis9 | 25.34 | 20.25 | 16.67 | 25.81 | 17.77 | 18.21 | 21.62 | 14.43 | 13.17 | 1.710 | *** | *** | |
| C18:1trans10 | 0.05 | 0.29 | 0.00 | 0.05 | 0.12 | 0.11 | 0.02 | 0.07 | 0.00 | 0.116 | |||
| C18:1trans13 | 0.16 | 0.09 | 0.01 | 0.16 | 0.02 | 0.00 | 0.21 | 0.07 | 0.00 | 0.042 | *** | ||
| C18:2cis9,cis12 | 8.09 | 18.95 | 24.21 | 9.03 | 22.71 | 22.56 | 9.37 | 23.96 | 26.29 | 1.965 | *** | * | |
| C18:2trans11,cis15 | 0.11 | 0.05 | 0.11 | 0.12 | 0.04 | 0.04 | 0.09 | 0.17 | 0.11 | 0.052 | |||
| C18:3cis9,cis12,cis15 | 3.56 | 2.02 | 2.02 | 3.40 | 2.31 | 2.01 | 4.12 | 2.36 | 2.41 | 0.352 | *** | ||
| C18:3cis9,trans11,cis15 | 0.13 | 0.02 | 0.01 | 0.05 | 0.00 | 0.00 | 0.21 | 0.05 | 0.01 | 0.036 | *** | ** | * |
| C20:1cis11 | 0.08 | 0.07 | 0.15 | 0.10 | 0.00 | 0.09 | 0.07 | 0.21 | 0.22 | 0.047 | ** | * | * |
| C20:2cis11,cis14 | 0.11 | 0.12 | 0.19 | 0.10 | 0.02 | 0.16 | 0.14 | 0.42 | 0.29 | 0.114 | * | ||
| C20:3cis8,cis11,cis14 | 1.01 | 1.27 | 1.81 | 0.86 | 1.39 | 1.50 | 1.06 | 1.49 | 1.63 | 0.150 | *** | ||
| C20:4cis5,cis8,cis11,cis14 | 3.18 | 3.16 | 3.76 | 2.71 | 2.99 | 3.25 | 3.66 | 3.84 | 4.23 | 0.497 | ** | ||
| C20:4cis8,cis11,cis14,cis17 | 0.72 | 0.22 | 0.27 | 0.53 | 0.09 | 0.23 | 0.73 | 0.24 | 0.34 | 0.094 | *** | * | |
| C20:5cis5,cis8,cis11,cis14,cis17 | 2.30 | 1.36 | 1.56 | 1.83 | 1.32 | 1.54 | 2.56 | 1.30 | 1.85 | 0.300 | *** | ||
| C22:5cis7,cis10,cis13,cis16,cis19 | 2.10 | 1.91 | 2.01 | 2.19 | 1.84 | 2.28 | 2.34 | 2.73 | 2.77 | 0.466 | |||
| C22:6cis4,cis7,cis10,cis13,cis16,cis19 | 0.21 | 0.08 | 0.14 | 0.18 | 0.00 | 0.11 | 0.30 | 0.20 | 0.22 | 0.062 | ** | *** | |
| CLA(C18:2,cis9,trans11) | 0.22 | 0.06 | 0.02 | 0.19 | 0.02 | 0.05 | 0.18 | 0.03 | 0.00 | 0.057 | *** | ||
| Others | 7.30 | 5.82 | 4.91 | 7.42 | 4.37 | 5.14 | 7.69 | 5.78 | 5.20 | 0.846 | *** | ||
| SFA | 31.04 | 30.36 | 28.08 | 31.40 | 28.97 | 28.89 | 29.93 | 27.18 | 25.58 | 1.954 | * | ||
| MUFA | 38.31 | 33.75 | 30.18 | 38.74 | 33.33 | 31.57 | 35.90 | 29.72 | 28.22 | 1.404 | *** | *** | |
| PUFA | 23.30 | 30.08 | 36.83 | 22.40 | 33.33 | 34.39 | 26.40 | 37.32 | 41.00 | 2.760 | *** | ** | |
| n-3 PUFA | 9.30 | 6.49 | 7.55 | 8.52 | 6.61 | 7.43 | 10.60 | 7.60 | 8.88 | 1.117 | ** | * | |
| n-6 PUFA | 12.93 | 22.85 | 28.75 | 12.80 | 26.13 | 26.41 | 14.85 | 29.02 | 31.51 | 2.048 | *** | ** | |
| n-6:n-3 PUFA | 1.42 | 3.93 | 3.94 | 1.51 | 4.03 | 3.61 | 1.46 | 3.90 | 3.56 | 0.392 | *** | ||
| PUFA:SFA | 0.81 | 1.01 | 1.31 | 0.75 | 1.17 | 1.20 | 0.92 | 1.38 | 1.60 | 0.135 | *** | ** | |
| Total fatty acids (mg/g muscle) | 359.5 | 278.3 | 318.0 | 323.7 | 221.3 | 340.3 | 401.1 | 297.1 | 315.6 | 46.80 | ** | ||
CLA = conjugated linoleic acid; MUFA = monounsaturated fatty acids; PUFA = polyunsaturated fatty acids; SFA = saturated fatty acids.
With regard to breed type, the total fatty acid concentration in the PL fraction was similar for the three breeds. The proportions of LA, C20:2, DHA, PUFA, omega-6 PUFA and PUFA:SFA ratio were similar for AA and HF but lower than for BB. The proportions of C18:1cis9 and MUFA were similar for AA and HF but higher than for BB. The proportions of C16:1trans12, C16:1trans7+trans8 and C20:4n-3 were lower for AA than for HF but similar for HF compared to BB. The proportions of C17:0 iso+C16:1trans9 and omega-3 PUFA were lower for AA than for HF and for HF compared to BB. The proportion of C16:0 was higher for AA than for HF and for HF compared to BB. The proportion of C20:4n-6 was similar for AA and for HF and for HF compared to BB but AA was lower than BB. The proportions of C18:1cis12 and LA were similar for AA and HF and lower for HF than for BB while AA was similar to BB. The proportion of C18:1cis11 was higher for AA than for HF and lower for HF than for BB but AA was similar to BB.
There were several interactions between diet and breed. The proportion of C16:0iso was similar for Grass and for EC, which was lower than LC. However, AA was higher than BB and HF for Grass but lower than both on EC and LC. The proportions of C17:1cis9 and C18:3cis9,trans11,cis15 were higher for Grass compared to EC and LC which did not differ. However, AA was lower than HF and BB on Grass but similar to the other breeds on EC and LC.
Partial least squares discriminant analysis
The PLS-DA resulted in clear discrimination between the Grass and the two concentrate-finished groups, considered together (Figure 1A). The fatty acids that contributed most to the discrimination are shown in the associated variable importance plot with C18:1trans10 being the most discriminating fatty acid (Figure 1B). The P-value based on the permutation test was 0.0005. The R2 for the model was 0.97, while the coefficient of prediction/classification based on cross-validation was 0.92. When PLS-DA was applied to the EC and LC groups (Figure 2A), good discrimination was also observed with C18:1trans10 being the most discriminating fatty acid (Figure 2B). The P-value based on the permutation test was 0.0055. The R2 for this model was 0.94, while the coefficient of prediction/classification based on cross-validation was 0.68. In contrast, however, when PLS-DA was applied to the breeds (Figure 3A), the separation was poor. The P-value based on the permutation test was 0.0035. The R2 for this model was 0.44, while the coefficient of prediction/classification based on cross-validation was −0.5. The most discriminating fatty acids were C18:1cis16 and DHA (Figure 3B).
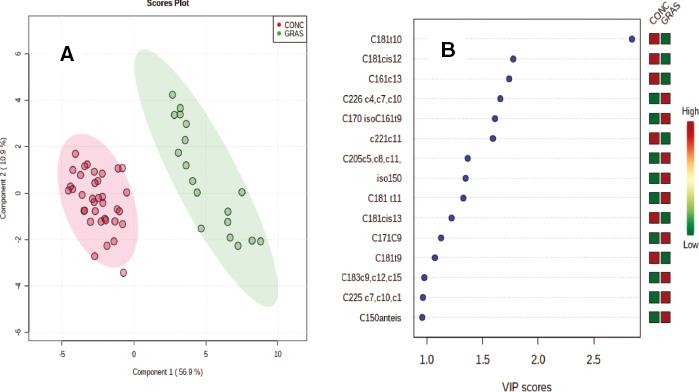
Panel A. Partial least square discriminant analysis (PLS-DA) of the fatty acid profile of the longissimus muscle from dairy-origin steers finished at pasture (GRAS) or indoors on ad libitum concentrates (short- and long-term grazing combined) (CONC). Panel B. Variable importance plot (VIP) highlighting the fatty acids most responsible for observed separations in PLS-DA; the coloured boxes on the right indicate the relative concentrations of the corresponding fatty acid in each group.
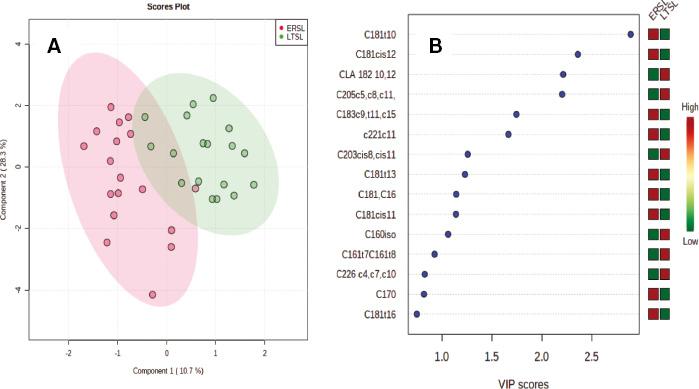
Panel A. Partial least square discriminant analysis (PLS-DA) of the fatty acid profile of the longissimus muscle from dairy-origin steers finished indoors on ad libitum concentrates after short- (ERSL) or long-term (LTSL) grazing. Panel B. Variable importance plot (VIP) highlighting the fatty acids most responsible for observed separations in PLS-DA; the coloured boxes on the right indicate the relative concentrations of the corresponding fatty acid in each group.
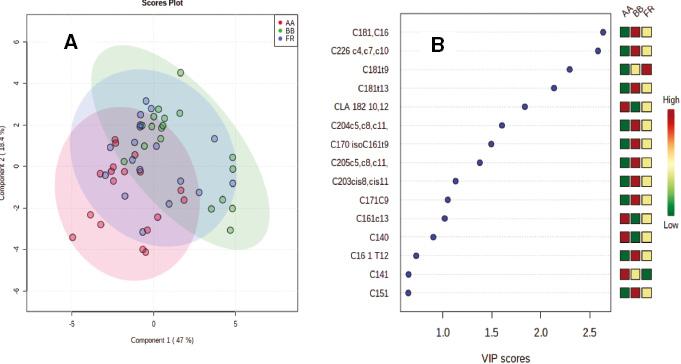
Panel A. Partial least square discriminant analysis of the fatty acid profile of the longissimus muscle from Angus (AA), Friesian (FR) or Belgian Blue (BB) sired dairy-origin steers. Panel B. Variable importance plot (VIP) highlighting the fatty acids most responsible for observed separations in PLS-DA; the coloured boxes on the right indicate the relative concentrations of the corresponding fatty acid in each group.
Discussion
Context
In the traditional 24-mo dairy calf-to-steer beef system, forage (grazed and ensiled) typically represents more than 80% of the lifetime DM intake of cattle (Prendiville et al., 2018). The main modification of this system was extending this proportion further by finishing cattle on pasture at 21 mo of age, thereby contributing to efforts to market this beef as “Grass-Fed and/or Grass-Finished”. This would also be beneficial to the producer as grazed grass is a cheaper feedstuff than grass silage or concentrates (Finneran et al., 2012). It is recognised that enhanced nutritive value is not the only contributor to consumer enthusiasm for these products (Li et al., 2016), but it is nonetheless important (Flowers et al., 2019). Accordingly, the focus in this study was on the fatty acid composition of the longissimus muscle. The main sires used for male dairy beef production (HF, AA and BB) were compared. From a fatty acid perspective, the BB is a good model of a late-maturing breed, as BB cross-bred cattle are characterised by lower fat deposition at a constant weight than cross-bred cattle of many other “beef” breeds (Keane, 1993). Cattle were also finished indoors on concentrates and slaughtered at 21 mo, to ensure carcasses achieved the current market specification for carcass fat classification when slaughtered earlier than in the traditional production system. Housing cattle later in the grazing season and finishing on concentrates will result in heavier carcasses, which may be financially more attractive to some producers depending on their particular production costs. We hypothesised that extending the duration of grazing would ameliorate the loss of “healthy” fatty acids compared to similarly fed cattle slaughtered at 21 mo of age.
Comparison of production systems
The grass and grass silage were of high nutritive value, based on DMD, and the fatty acid profile was similar to that previously seen at this location (Mezgebo et al., 2017). The fatty acid profile of the concentrate reflected the fatty acid profile of the main ingredients, barley and extruded full fat soyabean, and supplied both C18:1 and C18:2.
The concentrations of total fatty acids in the longissimus muscle reflect the energy consumption and associated carcass fat classification across the finishing systems and breeds. Based on the mean concentration in muscle from Grass (2.2 g/100 g), this beef could be labelled as “low fat”, that is, total fatty acids <3 g/100 g solid (EU, 2007). The AA and HF beef from EC and LC would not comply with this definition. However, all BB beef complies with this definition, reflecting the late-maturing characteristics of this breed.
For individual and classes of fatty acids, there are considerably more reports of data expressed as a proportion of total fatty acids than as a concentration in beef. Presentation of the fatty acid data expressed as a proportion has merit and allows more complete comparison with the literature (following text). From a labelling and ultimately a marketing perspective, concentration data are more relevant for some variables, while for others, proportional data are more relevant. Thus, based on the mean SFA concentration in the longissimus muscle, beef from Grass (1.0 g/100 g) from all breeds could be labelled “low in saturated fat”, that is, SFA concentration <1.5 g/100 g solid (EU, 2007). The AA and HF beef from EC and LC did not comply with this definition, whereas all BB beef did. For MUFA, EU (2010) states that “a claim that a food is high in monounsaturated fat may only be made when at least 45% of the fatty acids present” are monounsaturated. Based on the mean proportion of MUFA in the longissimus muscle, beef from Grass (42%) would not meet this claim, whereas beef from EC and LC from all breeds would. This reflects the higher intramuscular fat concentration and the higher consumption of MUFA by the latter. For PUFA, EU (2010) states that “a claim that a food is high in polyunsaturated fat may only be made when at least 45% of the fatty acids present” are polyunsaturated. None of the beef from the production systems examined in this study would meet this claim.
With regard to ratios of fatty acid classes, there is a recommendation (WHO, 2003) on a desirable ratio of total PUFA:total SFA on a whole diet basis (>0.45), but it does not relate to individual foods. All longissimus muscle in the present study was below this ratio. From a human nutrition perspective, longissimus muscle from BB has a more desirable PUFA:SFA ratio. Similarly, there is a recommendation (WHO, 2003) on a desirable ratio of total omega-6 PUFA:total omega-3 PUFA on a whole diet basis (<4). Nevertheless, the lower omega-6 PUFA:omega-3 PUFA ratio in longissimus muscle from Grass (1.72) compared to that from EC (4.79), consistent with the literature (Daley et al., 2010), can be viewed as positive for “Grass-Fed” beef. The lower omega-6 PUFA:omega-3 PUFA ratio in longissimus muscle from LC compared to LM from EC (4.28 vs. 4.79) is unlikely to be nutritionally important.
With regard to individual fatty acids, while the concentration of LA, the major omega-6 fatty acid, was markedly decreased in longissimus muscle from Grass and reflected in the omega-6 PUFA:omega-3 PUFA ratio, there is no reference intake value for this fatty acid. Similarly for CLA, there is no reference intake value but the concentration did not differ between production systems reflecting its higher concentration in the NL compared to the PL fraction (discussed in the following text). There is interest currently in the human health effects of the trans C18:1 fatty acids in beef with C18:1trans11 considered to be positive and C18:1trans10, negative (Mapiye et al., 2015). The higher concentration of C18:1trans11 and lower concentration of C18:1trans10 in longissimus muscle from Grass compared to EC and LC, reflected in C18:1trans11: C18:1trans10 ratios of 15.5, 0.39 and 0.77, respectively, is consistent with the study by Aldai et al. (2013) and can be considered a beneficial finding but there is no reference intake value currently. The published reference intake values for humans are 2 g and 250 mg/d for LNA, and EPA + DHA, respectively (EFSA, 2009). The associated concentrations in 100 g tissue for beef to be labelled as a “source” of omega-3 fatty acids are 300 mg and 40 mg, respectively (EFSA, 2009). In the present study, the highest concentration of LNA was 30 mg/100 g muscle (AA on Grass) and the highest concentration of EPA + DHA was 11 mg/100 g muscle (BB on Grass). The lowest concentration of LNA was 16 mg/100 g muscle (BB on EC) and the lowest concentration of EPA + DHA was 4 mg/100 g muscle (HF on EC). While DPA is a long-carbon-chain omega-3 fatty acid found in greater concentration in Grass, EU (2010) does not consider that it makes a contribution to the total long-carbon-chain omega-3 fatty acids for the purpose of a nutritional claim. The higher concentrations of LNA, EPA, DPA and omega-3 PUFA in LC compared to EC indicate a residual effect of the extended grazing period in the LC system, which could be viewed as a positive finding in the context of human health. However, the concentrations were considerably lower than those observed for Grass. While the data generally demonstrate the superiority of pasture finishing, the “Grass-Finished” beef in the present study could not be labelled a “source” of omega-3 fatty acids as defined by EFSA (2009). Nevertheless, Lenighan et al. (2020) demonstrated improved adherence with dietary recommendations for total fat, SFA and PUFA when grass-fed beef replaced concentrate-fed beef in a population modelling study and concluded that habitual consumption of grass-fed beef may have potential as a public health strategy to improve dietary fat quality.
In recognition of the impact of higher intramuscular fat concentration per se on muscle fatty acid composition (Moreno et al., 2008; Warren et al., 2008) and the range in total fatty acid concentrations across the breed and dietary combinations and to facilitate comparison with the literature, the data were also analysed on a proportional basis. The general results of the comparison of Grass and EC are consistent with the literature (Daley et al., 2010; Scollan et al., 2014), that is, a decrease in the proportion of fatty acids considered to be beneficial to human health that is dependent on the duration of concentrate feeding (Aldai et al., 2011). The proportion of LNA in total lipids from Grass (1.37 g/100 g) was similar to that reported by Noci et al. (2005) (1.29) and by Pavan & Duckett (2013) (1.08) for longissimus muscle from cattle that were at pasture for 158 and 200 d before slaughter in Ireland and the USA, respectively. The CLA proportion was also similar in the present study and the two studies cited earlier (0.55, 0.71 and 0.69 g/100 g, respectively) as was the proportion of C18:1trans11 (2.7, 3.0 and 2.8 g/100 g). In contrast, in surveys of beef labelled as “grass-fed” in the USA, LNA proportions of 0.81 (Bronkema et al., 2019) and 0.71 (Leheska et al., 2008) in total lipids were reported indicating a possible market opportunity with respect to LNA for the grass-finished beef from the modified production system.
With regard to breed type, the average fatty acid profile for the HF and BB was similar to that reported by Moreno et al. (2008). The intramuscular fat from BB reflected the later maturity of this breed by having on average, higher SFA (albeit not statistically different), PUFA and PUFA:SFA ratio and lower MUFA proportions than HF, particularly on Grass and agrees with previous studies on this breed (Raes et al., 2001). For dairy-origin steers sired by AA and HF bulls, Warren et al. (2008) found little difference in the proportions of SFA, MUFA and PUFA and a lower PUFA:SFA ratio for AA compared to HF, which is similar to the present study.
The interaction between diet and breed for the nutritionally important LA, LNA and EPA (and consequently total n-3 PUFA proportions) reflects the propensity for leanness of BB manifested when consuming the LNA-rich pasture and slaughtered at the lighter weight. This suggests that at a common intramuscular fat concentration, the late-maturing breed is more suited to the grass-finishing system from an omega-3 polyunsaturated fatty acid perspective, yet the carcass would not be acceptable under the current EUROP carcass classification system, as discussed earlier.
Because of the differences in total fatty acid concentrations between diets and sire breeds, and to explore the pattern of deposition of fatty acids, the extracted intramuscular lipids were separated into NL and PL fractions. Differences in total intramuscular fatty acid concentrations tend to mainly reflect differences in the size of the NL fraction as the size of the PL fraction is generally quite constant (Warren et al., 2008). However, in the present study the PL fraction was bigger for Grass, which may reflect the stage in adipose tissue deposition at which the lighter cattle were slaughtered. The higher proportion of individual PUFA and PUFA:SFA ratio in PL compared to NL reflects the preferential incorporation of PUFA into PL as previously reported (Moreno et al., 2008; Warren et al., 2008). The effect of Grass on the proportion of omega-3 PUFA is consequently greater in the PL fraction (mean LNA = 3.69 g/100 g) than in the total intramuscular lipids (mean LNA = 1.37 g/100 g). For PUFA, the change from the PL to total fatty acid fractions reflects dilution of the PL with NL as total intramuscular lipids increase as the proportion of PUFA is lower in NL than PL. Consequently, the highest proportion of omega-3 PUFA is found in the leanest breed finished on the Grass, in this case BB.
The preferential incorporation of CLA and C18:1trans10 and C18:1trans11, in particular in the NL fraction, was also reported by Warren et al. (2008) and Moreno et al. (2008). The effect of Grass on the proportion of CLA and C18:1trans11 is smaller in the PL fraction (mean values of 0.20 and 0.85 g/100 g, respectively) than in the total intramuscular lipids (mean values of 0.55 and 2.70 g/100 g, respectively). As the NL fraction has a higher proportion of CLA and C18:1trans11 than the PL fraction, as total intramuscular lipids increase due to deposition of NL, the proportion of these fatty acids increases. Consequently, the highest proportions of CLA and C18:1trans11 are found in the fattest/earlier-maturing breed finished on a CLA-promoting diet, in this case AA on Grass. In this regard, “Grass-Fed” beef is frequently stated to be high in CLA when compared to beef from other feeding systems. When compared at a similar total intramuscular lipid concentration, this is generally correct. However, when expressed on a portion size or concentration basis, beef with a higher intramuscular lipid concentration from a non-grass diet can supply a similar amount of CLA as seen in the present study.
Authentication of pre-slaughter diet and sire breed
Consumers are increasingly interested in the provenance of beef. Beef labelled as “Grass-Based or Grass-Fed”, which can command a premium price (Stampa et al., 2020), is likely to become more prominent on market shelves. Similarly, there is an increase in early-maturing breed branded beef products in the Irish market place, which also command a premium price (Moloney et al., 2020b). Methods that validate the elements of a system of production are therefore required. Garcia et al. (2008) and Alfaia et al. (2009) showed that beef from cattle finished on pasture or concentrates could be distinguished (94–100% correct classification after cross-validation) based on their differences in fatty acid composition. These observations were confirmed in the present study when beef from “Grass-Fed” cattle was compared with beef from cattle finished on concentrates per se. Further validation, by application of developed models to muscle fatty acid data from independent cattle, is required to ensure the robustness of this approach, for example, the potential for misclassification of dietary history when the fatty acid profile is manipulated to be more like the fatty acid profile of “Grass-Fed” beef. In this regard, Cama-Moncunill et al. (2021) developed a model to discriminate between beef from cattle finished on grass, grass supplemented with concentrates, or concentrates and straw, based on the fatty acid profile. When this model was applied to beef from cattle finished at grass and supplemented with either a linseed oil (high in LNA) or sunflower oil (high in LA to promote CLA synthesis)–rich concentrate, all samples were predicted to belong to the grass-fed group, that is, the model failed to distinguish these samples from true grass-fed beef. When the intramuscular fatty acid profile was more similar, due to supplementation of grazing cattle with concentrates at 0.7% or 1.0% of liveweight, the correct classification without cross-validation was 78% (Garcia et al., 2008). Similarly, Dias et al. (2008) reported a correct classification, without cross-validation, of 100% for beef produced according to a “traditional” or organic production system which had similar fatty acid profiles, while Moloney et al. (2018) showed that minor differences in the fatty acid profile were sufficient to discriminate between beef from cattle fed on different sward types. The present study expands these observations by demonstrating that the duration at pasture prior to cattle being finished on a similar concentrate ration creates a fatty acid signature in beef that is sufficiently different to distinguish beef on that basis. This might be helpful in marketing beef as being from an extended grazing system which would appeal to consumers more concerned with animal welfare than the nutritional benefits of “Grass-Fed” beef.
The potential of the fatty acid profile to discriminate between sire breeds was much lower than for dietary history. This may reflect the strategy of using the fatty acid profile (proportions of fatty acids) rather than the fatty acid concentrations for the discriminant analysis. This strategy was chosen as concentrations of individual fatty acids reflect the total fatty acid concentrations and therefore muscle fatness would be the major discriminating factor and limit the usefulness of this approach subsequently. Despite the differences in maturity and thus the patterns of fat deposition of the sire breeds in this study (Keane, 1993), the fatty acid profiles were clearly not sufficiently different to discriminate between them. This may also reflect the relatively smaller effect of breed compared to diet on the fatty acid profile of beef (de Smet et al., 2004). There was weak evidence that AA was distinguishable from HF and BB based on the fatty acid profile, and alternative approaches are more likely to be successful in authenticating the breed from which beef was produced.
It is concluded that to maximise the omega-3 PUFA concentration in beef, a lean late-maturing breed is more appropriate, while to maximise CLA, a fatter early-maturing breed is more appropriate and both should be finished on grass. Chemometric analysis confirmed the potential of the fatty acid profile as a tool to authenticate “Grass-Finished” beef and thus ensure consumer confidence when paying a premium for this product. Chemometric analysis also demonstrated the potential of the fatty acid profile to distinguish “Concentrate-Finished” beef based on the length of grazing prior to finishing, which could be helpful in the further development of “Grass-based” or “Animal welfare-friendly” beef products.