- Record: found
- Abstract: found
- Article: found
Decreased Influenza Activity During the COVID-19 Pandemic — United States, Australia, Chile, and South Africa, 2020
research-article
Sonja J. Olsen , PhD
1
,
,
Eduardo Azziz-Baumgartner , MD
1 ,
Alicia P. Budd , MPH
1 ,
Lynnette Brammer , MPH
1 ,
Sheena Sullivan , PhD
2 ,
Rodrigo Fasce Pineda , MS
3 ,
Cheryl Cohen , MD
4
,
5 ,
Alicia M. Fry , MD
1
18 September 2020
Read this article at
There is no author summary for this article yet. Authors can add summaries to their articles on ScienceOpen to make them more accessible to a non-specialist audience.
Abstract
After recognition of widespread community transmission of SARS-CoV-2, the virus that
causes coronavirus disease 2019 (COVID-19), by mid- to late February 2020, indicators
of influenza activity began to decline in the Northern Hemisphere. These changes were
attributed to both artifactual changes related to declines in routine health seeking
for respiratory illness as well as real changes in influenza virus circulation because
of widespread implementation of measures to mitigate transmission of SARS-CoV-2. Data
from clinical laboratories in the United States indicated a 61% decrease in the number
of specimens submitted (from a median of 49,696 per week during September 29, 2019–February
29, 2020, to 19,537 during March 1–May 16, 2020) and a 98% decrease in influenza activity
as measured by percentage of submitted specimens testing positive (from a median of
19.34% to 0.33%). Interseasonal (i.e., summer) circulation of influenza in the United
States (May 17–August 8, 2020) is currently at historical lows (median = 0.20% tests
positive in 2020 versus 2.35% in 2019, 1.04% in 2018, and 2.36% in 2017). Influenza
data reported to the World Health Organization’s (WHO’s) FluNet platform from three
Southern Hemisphere countries that serve as robust sentinel sites for influenza from
Oceania (Australia), South America (Chile), and Southern Africa (South Africa) showed
very low influenza activity during June–August 2020, the months that constitute the
typical Southern Hemisphere influenza season. In countries or jurisdictions where
extensive community mitigation measures are maintained (e.g., face masks, social distancing,
school closures, and teleworking), those locations might have little influenza circulation
during the upcoming 2020–21 Northern Hemisphere influenza season. The use of community
mitigation measures for the COVID-19 pandemic, plus influenza vaccination, are likely
to be effective in reducing the incidence and impact of influenza, and some of these
mitigation measures could have a role in preventing influenza in future seasons. However,
given the novelty of the COVID-19 pandemic and the uncertainty of continued community
mitigation measures, it is important to plan for seasonal influenza circulation in
the United States this fall and winter. Influenza vaccination of all persons aged
≥6 months remains the best method for influenza prevention and is especially important
this season when SARS-CoV-2 and influenza virus might cocirculate (
1
).
Data from approximately 300 U.S. clinical laboratories located throughout all 50 states,
Puerto Rico, Guam, and the District of Columbia that participate in virologic surveillance
for influenza through either the U.S. WHO Collaborating Laboratories System or the
National Respiratory and Enteric Virus Surveillance System* were used for this analysis.
Clinical laboratories primarily test respiratory specimens for diagnostic purposes,
and data from these laboratories provide useful information on the timing and intensity
of influenza activity. The median number of specimens tested per week and the median
percentage of samples testing positive for influenza during September 29, 2019–February
29, 2020 (surveillance weeks 40–9, the period before the March 1, 2020 declaration
of a national emergency related to COVID-19
†
) were compared with those tested during March 1–May 16, 2020 (weeks 10–20 after the
declaration); data from three previous influenza seasons are presented as a comparison.
To assess influenza virus activity in the Southern Hemisphere, influenza laboratory
data from clinical and surveillance platforms reported from Australia, Chile, and
South Africa to WHO’s FluNet
§
platform were analyzed. For each country, the percentage of samples testing positive
for influenza for April–July (weeks 14–31) for four seasons (2017–2020) are presented.
Selected measures implemented to respond to COVID-19 in these countries were ascertained
from government websites. All data used were in the public domain.
In the United States, influenza activity (measured by percentage of respiratory specimens
submitted for influenza testing that yielded positive results) began to increase in
early November 2019, and >20% of specimens were positive during December 15, 2019–March
7, 2020 (weeks 51–10), after which activity declined sharply (Figure 1). Percent positivity
peaked on week 6 at 30.25% and decreased 14.90% by week 9, compared with an 89.77%
decrease during weeks 10–13. By the week of March 22, 2020 (week 13), when the number
of samples tested remained very high, percent positivity dropped to 2.3%, and since
the week of April 5, 2020 (week 15), has remained <1%. The median number of specimens
tested for influenza each week decreased from 49,696 during September 29, 2019–February
29, 2020 (weeks 40–9), to 19,537 during March 1–May 16, 2020 (weeks 10–20), representing
a 61% decrease. During these same two periods, influenza activity decreased 98%, from
a median of 19.34% to 0.33% of submitted respiratory specimens testing positive for
influenza. Interseasonal circulation of influenza in the United States (May 17–August
8, 2020; weeks 21–32) is now at historical lows (weekly median 0.20% of samples testing
positive in 2020 versus 2.35% in 2019, 1.04% in 2018 and 2.36% in 2017).
FIGURE 1
Number of respiratory specimens tested and percentage testing positive for influenza,
by year — United States, 2016–17 through 2019–20 seasons
Source: FluView Interactive. https://www.cdc.gov/flu/weekly/fluviewinteractive.htm.
Abbreviation: PP = percentage positive.
The figure is a histogram, an epidemiologic curve showing the number of respiratory
specimens tested and percentage testing positive for influenza, by year, in the United
States, during 2016–17 through 2019–20 seasons.
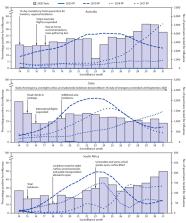
In the Southern Hemisphere countries of Australia, Chile, and South Africa, only 33
influenza positive test results were detected among 60,031 specimens tested in Australia,
12 among 21,178 specimens tested in Chile, and six among 2,098 specimens tested in
South Africa, for a total of 51 influenza positive specimens (0.06%, 95% confidence
interval [CI] = 0.04%–0.08%) among 83,307 tested in these three countries during April–July
2020 (weeks 14–31). In contrast, during April–July in 2017–2019, 24,512 specimens
tested positive for influenza (13.7%, 95% CI = 13.6%–13.9%) among 178,690 tested in
these three countries (Figure 2).
FIGURE 2
Number of specimens tested and percentage testing positive for influenza, by year
— Australia, Chile, and South Africa, April–August (weeks 14–31), 2017–20
Source: FluNet. https://www.who.int/influenza/gisrs_laboratory/flunet/en/.
Abbreviation: PP = percentage positive.
The figure is a histogram, an epidemiologic curve showing the number of specimens
tested and percentage testing positive for influenza, by year, in Australia, Chile,
and South Africa, during April–August (weeks 14–31), 2017–20.
In the United States, the COVID-19 national emergency was declared on March 1, 2020,
but states began implementing a range of COVID-19 mitigation measures in late February,
including school closures, bans on mass gatherings, and stay-at-home orders (
2
). In addition, some emphasis was placed on individual measures, such as mask wearing,
staying home while sick, and social distancing. In Australia, a 14-day mandatory hotel
quarantine was introduced for all returned travelers on March 29; regional lockdowns
began in early April, followed by a stay-at-home recommendation and bans on gatherings
in mid-April. Some easing of measures began in late April.
¶
In Chile, the president declared a state of emergency on March 18, which remains in
effect into September. In addition, in mid-March an overnight curfew and a nationwide
lockdown were implemented. Since then, the lockdown has been lifted regionally, based
on disease activity; however, recommendations to stay at home and socially distance,
as well as mandatory use of masks are all still in place.** In South Africa, a total
lockdown was imposed on April 9, with some easing of measures starting on May 1.
††
The community mitigation strategies implemented to prevent the spread of COVID-19,
including both community and individual-level measures, appear to have substantially
reduced transmission of influenza in all these countries.
Discussion
In the United States, influenza virus circulation declined sharply within 2 weeks
of the COVID-19 emergency declaration and widespread implementation of community mitigation
measures, including school closures, social distancing, and mask wearing, although
the exact timing varied by location (
2
). The decline in influenza virus circulation observed in the United States also occurred
in other Northern Hemisphere countries (
3
,
4
) and the tropics (
5
,
6
), and the Southern Hemisphere temperate climates have had virtually no influenza
circulation. Although causality cannot be inferred from these ecological comparisons,
the consistent trends over time and place are compelling and biologically plausible.
Like SARS-CoV-2, influenza viruses are spread primarily by droplet transmission; the
lower transmissibility of seasonal influenza virus (R0 = 1.28) compared with that
of SARS-CoV-2 (R0 = 2–3.5) (
7
) likely contributed to a more substantial interruption in influenza transmission.
These findings suggest that certain community mitigation measures might be useful
adjuncts to influenza vaccination during influenza seasons, particularly for populations
at highest risk for developing severe disease or complications.
Initially, declines in influenza virus activity were attributed to decreased testing,
because persons with respiratory symptoms were often preferentially referred for SARS-CoV-2
assessment and testing. However, renewed efforts by public health officials and clinicians
to test samples for influenza resulted in adequate numbers tested and detection of
little to no influenza virus. Further, some countries, such as Australia, had less
stringent criteria for testing respiratory specimens than in previous seasons and
tested markedly more specimens for influenza but still detected few with positive
results during months when Southern Hemisphere influenza epidemics typically peak.
A new Food and Drug Administration–approved multiplex diagnostic assay for detection
of both SARS-CoV-2 and influenza viruses could improve future surveillance efforts
(https://www.cdc.gov/coronavirus/2019-ncov/lab/multiplex.html).
It is difficult to separate the effect that individual community mitigation measures
might have had on influenza transmission this season. Although school-aged children
can drive the spread of influenza, the effectiveness of school closures alone is not
clear because adults have other exposures (
8
). There is evidence to support the use of face masks by infected persons to reduce
transmission of viral respiratory illnesses to others and growing evidence to support
their use (in the health care setting, in households, and in the community) to protect
the healthy wearer from acquiring infection. More data are needed to assess effectiveness
of different types of masks in different settings (
9
). Data from the current pandemic might help answer critical questions about the effect
of community mitigation measures on transmission of influenza or other respiratory
diseases. In addition, assessing acceptability of effective measures would be critical,
because acceptability is likely to be inversely correlated with the stringency of
the measure.
The findings in this report are subject to at least four limitations. First, an ecologic
analysis cannot demonstrate causality, although the consistency of findings across
multiple countries is compelling. Second, other factors, such as the sharp reductions
in global travel or increased vaccine use, might have played a role in decreasing
influenza spread; however, these were not assessed. Third, viral interference might
help explain the lack of influenza during a pandemic caused by another respiratory
virus that might outcompete influenza in the respiratory tract (
10
). This possibility is less likely in the United States because influenza activity
was already decreasing before SARS-CoV-2 community transmission was widespread in
most parts of the nation. Finally, it is possible that the declines observed in the
United States were just the natural end to the influenza season. However, the change
in the decrease percent positivity after March 1 was dramatic, suggesting other factors
were at play.
The global decline in influenza virus circulation appears to be real and concurrent
with the COVID-19 pandemic and its associated community mitigation measures. Influenza
virus circulation continues to be monitored to determine if the low activity levels
persist after community mitigation measures are eased. If extensive community mitigation
measures continue throughout the fall, influenza activity in the United States might
remain low and the season might be blunted or delayed. In the future, some of these
community mitigation measures could be implemented during influenza epidemics to reduce
transmission, particularly in populations at highest risk for developing severe disease
or complications. However, in light of the novelty of the COVID-19 pandemic and the
uncertainty of continued community mitigation measures, it is important to plan for
seasonal influenza circulation this fall and winter. Influenza vaccination for all
persons aged ≥6 months remains the best method for influenza prevention and is especially
important this season when SARS-CoV-2 and influenza virus might cocirculate (
1
).
Summary
What is already known about this topic?
Influenza activity is currently low in the United States and globally.
What is added by this report?
Following widespread adoption of community mitigation measures to reduce transmission
of SARS-CoV-2, the virus that causes COVID-19, the percentage of U.S. respiratory
specimens submitted for influenza testing that tested positive decreased from >20%
to 2.3% and has remained at historically low interseasonal levels (0.2% versus 1–2%).
Data from Southern Hemisphere countries also indicate little influenza activity.
What are the implications for public health practice?
Interventions aimed against SARS-CoV-2 transmission, plus influenza vaccination, could
substantially reduce influenza incidence and impact in the 2020–21 Northern Hemisphere
season. Some mitigation measures might have a role in reducing transmission in future
influenza seasons.
Related collections
Most cited references10
- Record: found
- Abstract: found
- Article: not found
Impact assessment of non-pharmaceutical interventions against coronavirus disease 2019 and influenza in Hong Kong: an observational study
Benjamin Cowling, Sheikh Taslim Ali, Tiffany W Y Ng … (2020)
- Record: found
- Abstract: found
- Article: not found
Estimating the impact of school closure on influenza transmission from Sentinel data.

- Record: found
- Abstract: found
- Article: found
Estimates of the reproduction number for seasonal, pandemic, and zoonotic influenza: a systematic review of the literature
Matthew Biggerstaff, Simon Cauchemez, Carrie Reed … (2014)