8
views
0
recommends
+1 Recommend
0 collections
    0
    shares
      • Record: found
      • Abstract: found
      • Article: found
      Is Open Access

      Urinalysis and determination of the urine protein‐to‐creatinine ratio reference interval in healthy cows

      research-article

      Read this article at

      Bookmark
          There is no author summary for this article yet. Authors can add summaries to their articles on ScienceOpen to make them more accessible to a non-specialist audience.

          Abstract

          Background

          There are no reference intervals for urinalysis in cattle.

          Hypothesis/Objectives

          Characterize the urine of healthy cows, establish urine protein‐to‐creatinine ratio (UPC) reference intervals, and test possible differences among dairy and beef cattle, age groups, or stage of lactation.

          Animals

          Seventy‐seven dairy and 74 beef 2.5 to 17 year‐old cows of different breeds housed mainly in free stall.

          Methods

          In this prospective study, urine specimens were collected by catheterization. Complete urinalysis was performed within 1 hour including specific gravity, dipstick evaluation, visual urine pH evaluation with 0.3 pH unit graded strips, and microscopic evaluation of the sediment. Urinary protein and creatinine concentrations and protein electrophoresis were determined on frozen aliquots.

          Results

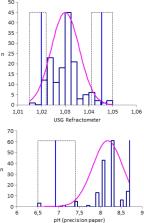
          Overall reference intervals were 1.020 to 1.045 for USG, 7.0 to 8.7 for pH, and 0.04 to 0.25 for UPC; because of differences in creatinine concentration, UPC was lower in beef (0.04‐0.14) than in dairy (0.05‐0.25) cows and in the latter in dry than lactating cows. With dipstick evaluation, most analytes were absent except for blood, ketone, and protein in 24.7, 16.0, and 64.7% of cases, respectively. Microscopic evaluation revealed less than 3 red blood cells, leukocytes, and epithelial cells in 84, 99.3, and 100% cows, respectively. No band was observed at electrophoresis, except in 1 case at MW ~66 000.

          Conclusions and Clinical Importance

          Creatininuria is higher in beef than dairy cows and proteinuria is likely more efficiently characterized by protein concentration than by UPC.

          Related collections

          Most cited references35

          • Record: found
          • Abstract: found
          • Article: not found

          Influence of muscle mass and physical activity on serum and urinary creatinine and serum cystatin C.

          For addressing the influence of muscle mass on serum and urinary creatinine and serum cystatin C, body composition was assessed by skinfold thickness measurement and bioelectrical impedance analyses. A total of 170 healthy individuals (92 women, 78 men) were classified as sedentary or with mild or moderate/intense physical activity. Blood, 24-h urine samples, and 24-h food recall were obtained from all individuals. Serum and urinary creatinine correlated significantly with body weight, but the level of correlation with lean mass was even greater. There was no significant correlation between body weight and lean mass with cystatin C. Individuals with moderate/intense physical activity presented significantly lower mean body mass index (23.1 +/- 2.5 versus 25.7 +/- 3.9 kg/m(2)) and higher lean mass (55.3 +/- 10.0 versus 48.5 +/- 10.4%), serum creatinine (1.04 +/- 0.12 versus 0.95 +/- 0.17 mg/dl), urinary creatinine (1437 +/- 471 versus 1231 +/- 430 mg/24 h), protein intake (1.4 +/- 0.6 versus 1.1 +/- 0.6 g/kg per d), and meat intake (0.7 +/- 0.3 versus 0.5 +/- 0.4 g/kg per d) than the sedentary individuals. Conversely, mean serum cystatin did not differ between these two groups. A multivariate analysis of covariance showed that lean mass was significantly related to serum and urinary creatinine but not with cystatin, even after adjustment for protein/meat intake and physical activity. Cystatin C may represent a more adequate alternative to assess renal function in individuals with higher muscle mass when mild kidney impairment is suspected.
            Bookmark
            • Record: found
            • Abstract: found
            • Article: not found

            ASVCP reference interval guidelines: determination of de novo reference intervals in veterinary species and other related topics.

            Reference intervals (RI) are an integral component of laboratory diagnostic testing and clinical decision-making and represent estimated distributions of reference values (RV) from healthy populations of comparable individuals. Because decisions to pursue diagnoses or initiate treatment are often based on values falling outside RI, the collection and analysis of RV should be approached with diligence. This report is a condensation of the ASVCP 2011 consensus guidelines for determination of de novo RI in veterinary species, which mirror the 2008 Clinical Laboratory and Standards Institute (CLSI) recommendations, but with language and examples specific to veterinary species. Newer topics include robust methods for calculating RI from small sample sizes and procedures for outlier detection adapted to data quality. Because collecting sufficient reference samples is challenging, this document also provides recommendations for determining multicenter RI and for transference and validation of RI from other sources (eg, manufacturers). Advice for use and interpretation of subject-based RI is included, as these RI are an alternative to population-based RI when sample size or inter-individual variation is high. Finally, generation of decision limits, which distinguish between populations according to a predefined query (eg, diseased or non-diseased), is described. Adoption of these guidelines by the entire veterinary community will improve communication and dissemination of expected clinical laboratory values in a variety of animal species and will provide a template for publications on RI. This and other reports from the Quality Assurance and Laboratory Standards (QALS) committee are intended to promote quality laboratory practices in laboratories serving both clinical and research veterinarians. © 2012 American Society for Veterinary Clinical Pathology.
              Bookmark
              • Record: found
              • Abstract: found
              • Article: not found

              Reference Value Advisor: a new freeware set of macroinstructions to calculate reference intervals with Microsoft Excel.

              International recommendations for determination of reference intervals have been recently updated, especially for small reference sample groups, and use of the robust method and Box-Cox transformation is now recommended. Unfortunately, these methods are not included in most software programs used for data analysis by clinical laboratories. We have created a set of macroinstructions, named Reference Value Advisor, for use in Microsoft Excel to calculate reference limits applying different methods. For any series of data, Reference Value Advisor calculates reference limits (with 90% confidence intervals [CI]) using a nonparametric method when n≥40 and by parametric and robust methods from native and Box-Cox transformed values; tests normality of distributions using the Anderson-Darling test and outliers using Tukey and Dixon-Reed tests; displays the distribution of values in dot plots and histograms and constructs Q-Q plots for visual inspection of normality; and provides minimal guidelines in the form of comments based on international recommendations. The critical steps in determination of reference intervals are correct selection of as many reference individuals as possible and analysis of specimens in controlled preanalytical and analytical conditions. Computing tools cannot compensate for flaws in selection and size of the reference sample group and handling and analysis of samples. However, if those steps are performed properly, Reference Value Advisor, available as freeware at http://www.biostat.envt.fr/spip/spip.php?article63, permits rapid assessment and comparison of results calculated using different methods, including currently unavailable methods. This allows for selection of the most appropriate method, especially as the program provides the CI of limits. It should be useful in veterinary clinical pathology when only small reference sample groups are available. ©2011 American Society for Veterinary Clinical Pathology.
                Bookmark

                Author and article information

                Contributors
                c.trumel@envt.fr
                Journal
                J Vet Intern Med
                J. Vet. Intern. Med
                10.1111/(ISSN)1939-1676
                JVIM
                Journal of Veterinary Internal Medicine
                John Wiley & Sons, Inc. (Hoboken, USA )
                0891-6640
                1939-1676
                15 February 2019
                Mar-Apr 2019
                : 33
                : 2 ( doiID: 10.1111/jvim.2019.33.issue-2 )
                : 999-1008
                Affiliations
                [ 1 ] Département Elevage et Produit, Santé Publique Vétérinaire Ecole Nationale Vétérinaire de Toulouse, Université de Toulouse Toulouse France
                [ 2 ] CREFRE, Université de Toulouse, INSERM, UPS, ENVT Toulouse France
                [ 3 ] IHAP, Université de Toulouse Toulouse France
                Author notes
                [*] [* ] Correspondence

                Catherine Trumel, Ecole Nationale Vétérinaire de Toulouse, 23 chemin des Capelles, 31076 Toulouse cedex 3, France.

                Email: c.trumel@ 123456envt.fr

                Author information
                https://orcid.org/0000-0001-9717-5808
                Article
                JVIM15452
                10.1111/jvim.15452
                6430871
                30768734
                3f5e479b-d330-4b9a-81fa-d2cc9c882470
                © 2019 The Authors. Journal of Veterinary Internal Medicine published by Wiley Periodicals, Inc. on behalf of the American College of Veterinary Internal Medicine.

                This is an open access article under the terms of the http://creativecommons.org/licenses/by-nc/4.0/ License, which permits use, distribution and reproduction in any medium, provided the original work is properly cited and is not used for commercial purposes.

                History
                : 26 July 2018
                : 30 January 2019
                Page count
                Figures: 5, Tables: 5, Pages: 10, Words: 7556
                Categories
                Standard Article
                FOOD AND FIBER ANIMAL
                Standard Articles
                Nephrology/Urology
                Custom metadata
                2.0
                jvim15452
                March/April 2019
                Converter:WILEY_ML3GV2_TO_NLMPMC version:5.6.1 mode:remove_FC converted:23.03.2019

                Veterinary medicine
                cattle,creatininuria,ph,proteinuria,upc,urinalysis,usg
                Veterinary medicine
                cattle, creatininuria, ph, proteinuria, upc, urinalysis, usg

                Comments

                Comment on this article