- Record: found
- Abstract: found
- Article: found
The Lancet Global Health Commission on Global Eye Health: vision beyond 2020
review-article

Matthew J Burton , Prof, PhD
a
,
d
,
* ,
Jacqueline Ramke , PhD
a
,
e ,
Ana Patricia Marques , PhD
a ,
Rupert R A Bourne , Prof, MD
f
,
g ,
Nathan Congdon , Prof, MD
h
,
i ,
Iain Jones , MSc
j ,
Brandon A M Ah Tong , BSocSci
k ,
Simon Arunga , PhD
a
,
l ,
Damodar Bachani , MD
m
,
n ,
Covadonga Bascaran , MSc
a ,
Andrew Bastawrous , PhD
a
,
o ,
Karl Blanchet , Prof, PhD
p ,
Tasanee Braithwaite , DM
a
,
q ,
John C Buchan , MD
a
,
r ,
John Cairns , Prof, MPhil
b ,
Anasaini Cama , MPH
s ,
Margarida Chagunda , MSc
t ,
Chimgee Chuluunkhuu , MD
u
,
v ,
Andrew Cooper , PhD
w ,
Jessica Crofts-Lawrence , MSt
x ,
William H Dean , PhD
a
,
y ,
Alastair K Denniston , Prof, PhD
d
,
z
,
aa ,
Joshua R Ehrlich , MD
ab
,
ac ,
Paul M Emerson , PhD
ad ,
Jennifer R Evans , PhD
a ,
Kevin D Frick , Prof, PhD
ae ,
David S Friedman , Prof, PhD
ah ,
João M Furtado , PhD
ai ,
Michael M Gichangi , MMed
aj ,
Stephen Gichuhi , PhD
ak ,
Suzanne S Gilbert , PhD
al ,
Reeta Gurung , MD
am ,
Esmael Habtamu , PhD
a
,
an ,
Peter Holland , MSc
x ,
Jost B Jonas , Prof, PhD
ao
,
ap
,
aq ,
Pearse A Keane , Prof, MD
d ,
Lisa Keay , Prof, PhD
ar
,
as ,
Rohit C Khanna , MPH
ar
,
at
,
au ,
Peng Tee Khaw , Prof, PhD
d ,
Hannah Kuper , Prof, ScD
c ,
Fatima Kyari , PhD
a
,
av ,
Van C Lansingh , Prof, PhD
aw
,
ax
,
ay ,
Islay Mactaggart , PhD
a
,
c ,
Milka M Mafwiri , MMed
az ,
Wanjiku Mathenge , Prof, PhD
ba ,
Ian McCormick , MSc
a ,
Priya Morjaria , PhD
a ,
Lizette Mowatt , FRCOphth
bb ,
Debbie Muirhead , MSc
k
,
bc ,
Gudlavalleti V S Murthy , Prof, MD
a
,
be ,
Nyawira Mwangi , PhD
a
,
bf ,
Daksha B Patel , MD
a ,
Tunde Peto , Prof, PhD
h ,
Babar M Qureshi , MD
bg ,
Solange R Salomão , Prof, PhD
bh ,
Virginia Sarah , BA
bi ,
Bernadetha R Shilio , MMed
bj ,
Anthony W Solomon , PhD
bk ,
Bonnielin K Swenor , PhD
af
,
ag ,
Hugh R Taylor , Prof, FRANZCO
bd ,
Ningli Wang , Prof, PhD
bl
,
bm ,
Aubrey Webson , DBA
bn ,
Sheila K West , Prof, PhD
af ,
Tien Yin Wong , Prof, MD
bo
,
bp ,
Richard Wormald , MSc
a
,
d ,
Sumrana Yasmin , MSc
bq ,
Mayinuer Yusufu , MTI
bl
,
bm ,
Juan Carlos Silva , MD
br ,
Serge Resnikoff , Prof, PhD
ar
,
bs ,
Thulasiraj Ravilla , MBA
bt ,
Clare E Gilbert , Prof, MD
a ,
Allen Foster , Prof, FRCOphth
a ,
Hannah B Faal , Prof, FRCOphth
bu
,
bv
16 February 2021
Read this article at
There is no author summary for this article yet. Authors can add summaries to their articles on ScienceOpen to make them more accessible to a non-specialist audience.
Abstract
Executive Summary
Eye health and vision have widespread and profound implications for many aspects of
life, health, sustainable development, and the economy. Yet nowadays, many people,
families, and populations continue to suffer the consequences of poor access to high-quality,
affordable eye care, leading to vision impairment and blindness.
In 2020, an estimated 596 million people had distance vision impairment worldwide,
of whom 43 million were blind. Another 510 million people had uncorrected near vision
impairment, simply because of not having reading spectacles. A large proportion of
those affected (90%), live in low-income and middle-income countries (LMICs). However,
encouragingly, more than 90% of people with vision impairment have a preventable or
treatable cause with existing highly cost-effective interventions. Eye conditions
affect all stages of life, with young children and older people being particularly
affected. Crucially, women, rural populations, and ethnic minority groups are more
likely to have vision impairment, and this pervasive inequality needs to be addressed.
By 2050, population ageing, growth, and urbanisation might lead to an estimated 895
million people with distance vision impairment, of whom 61 million will be blind.
Action to prioritise eye health is needed now.
This Commission defines eye health as maximised vision, ocular health, and functional
ability, thereby contributing to overall health and wellbeing, social inclusion, and
quality of life. Eye health is essential to achieve many of the Sustainable Development
Goals (SDGs). Poor eye health and impaired vision have a negative effect on quality
of life and restrict equitable access to and achievement in education and the workplace.
Vision loss has substantial financial implications for affected individuals, families,
and communities. Although high-quality data for global economic estimates are scarce,
particularly for LMICs, conservative assessments based on the latest prevalence figures
for 2020 suggest that annual global productivity loss from vision impairment is approximately
US$410·7 billion purchasing power parity. Vision impairment reduces mobility, affects
mental wellbeing, exacerbates risk of dementia, increases likelihood of falls and
road traffic crashes, increases the need for social care, and ultimately leads to
higher mortality rates.
By contrast, vision facilitates many daily life activities, enables better educational
outcomes, and increases work productivity, reducing inequality. An increasing amount
of evidence shows the potential for vision to advance the SDGs, by contributing towards
poverty reduction, zero hunger, good health and wellbeing, quality education, gender
equality, and decent work. Eye health is a global public priority, transforming lives
in both poor and wealthy communities. Therefore, eye health needs to be reframed as
a development as well as a health issue and given greater prominence within the global
development and health agendas.
Vision loss has many causes that require promotional, preventive, treatment, and rehabilitative
interventions. Cataract, uncorrected refractive error, glaucoma, age-related macular
degeneration, and diabetic retinopathy are responsible for most global vision impairment.
Research has identified treatments to reduce or eliminate blindness from all these
conditions; the priority is to deliver treatments where they are most needed. Proven
eye care interventions, such as cataract surgery and spectacle provision, are among
the most cost-effective in all of health care. Greater financial investment is needed
so that millions of people living with unnecessary vision impairment and blindness
can benefit from these interventions.
Lessons from the past three decades give hope that this challenge can be met. Between
1990 and 2020, the age-standardised global prevalence of blindness fell by 28·5%.
Since the 1990s, prevalence of major infectious causes of blindness—onchocerciasis
and trachoma—have declined substantially. Hope remains that by 2030, the transmission
of onchocerciasis will be interrupted, and trachoma will be eliminated as a public
health problem in every country worldwide. However, the ageing population has led
to a higher crude prevalence of age-related causes of blindness, and thus an increased
total number of people with blindness in some regions.
Key messages
Eye health is essential to achieve the Sustainable Development Goals; vision needs
to be reframed as a development issue
There is extensive evidence showing that improving eye health contributes directly
and indirectly to achieving many Sustainable Development Goals, including reducing
poverty and improving work productivity, general and mental health, and education
and equity. Improving eye health is a practical and cost-effective way of unlocking
human potential. Eye health needs to be reframed as an enabling, cross-cutting issue
within the sustainable development framework.
Almost everyone will experience impaired vision or an eye condition during their lifetime
and require eye care services; urgent action is necessary to meet the rapidly growing
eye health need
In 2020, 1·1 billion people had distance vision impairment or uncorrected presbyopia.
By 2050, this figure is expected to rise to 1·8 billion. Most affected people live
in low-income and middle-income countries (LMICs) with avoidable causes of vision
impairment. During the life course, most people will experience vision impairment,
even if just the need for reading glasses. Because of unmet needs and an ageing global
population, eye health is a major public health and sustainable development concern
which warrants urgent political action.
Eye health is an essential component of universal health coverage; it must be included
in planning, resourcing, and delivery of health care
Universal health coverage is not universal without affordable, high quality, equitable
eye care. In line with the WHO World report on vision, we urge countries to consider
eye care as an essential service within universal health coverage. To deliver comprehensive
services including promotion, prevention, treatment, and rehabilitation, eye care
needs to be included in national strategic health plans and development policies,
health financing structures, and health workforce planning. Coordinated intersectoral
action is needed to systematically improve population eye health, also within healthy
ageing initiatives, schools, and the workplace. Integration of eye health services
with multiple relevant components of health service delivery and at all levels of
the health system is of central importance.
High quality eye health services are not universally delivered; concerted action is
needed to improve quality and outcomes, providing effective, efficient, safe, timely,
equitable, and people-centred care
Use of effective service coverage indicators for cataract and refractive error highlight
the delivery gap between population eye health needs and the delivery of good outcomes.
We urge eye health providers to take a holistic view to emphasise quality and design
service delivery based on individual and population needs: a people-centred approach.
Services need to be characterised by inclusiveness and equity in design and delivery,
proactively addressing the needs of marginalised and vulnerable groups through targeted
interventions. To encourage improved quality in cataract surgery, we support redefining
a good vision outcome threshold as 6/12 or better.
Highly cost-effective vision-restoring interventions offer enormous potential to improve
the economic outlook of individuals and nations; a major scale up of financial investment
in eye health is required
For 2020, we estimate that vision impairment resulted in $410·7 billion lost economic
productivity; the full cost is most likely higher. Treatments for cataract and refractive
error would meet more than 90% of unmet needs and are highly cost-effective. The case
for countries to invest in improving population eye health is compelling and more
financial resources are urgently required.
Financial barriers to accessing eye care leave many people behind; eye health needs
to be included in national health financing to pool the risk
Health-care costs prevent many people from accessing essential eye health services.
Eye care needs to be integrated into general health system financing to remove cost
barriers. To improve access for the whole population and mitigate eye care expenditure,
mechanisms that pool risk are highly desirable.
Technology and treatment developments offer new tools to improve eye health; thoughtful
application is needed to maximise the potential to improve coverage, accessibility,
quality, efficiency, and affordability
Technological developments such as telemedicine, mHealth, and artificial intelligence
offer the potential to revolutionise eye health care in the next decade by delivering
affordable, high-quality services to remote areas. However, caution is needed to ensure
all populations benefit from these developments.
The eye health workforce is unable to meet population needs in many countries; major
expansion in service capacity is required through increased numbers, sharing tasks,
strengthened training, enabling work environments, and effective leadership
Many areas have major shortages of personnel working in eye health. The available
workforce needs to be distributed according to population need. Quality of training
for the workforce needs to be updated, with renewed emphasis on competency. Enabling
working environments need to be created, including appropriate support, supervision,
and equipment. Long-standing issues of low productivity need to be systematically
resolved. Mentoring and other programmes to cultivate an emerging generation of eye
health leaders are needed.
Reliable survey and service data are key to progress in eye health; robust indicator
data are needed to shape change and drive action
To monitor progress in delivering improved eye health within universal health coverage,
a balanced set of robust indicators are needed, which we outlined in this Commission.
Service data should be available and used by implementers and policy makers to drive
change. We highlight the scarcity of epidemiological data in several regions, which
should be addressed as a priority.
Research has been crucial to advances in understanding and treating eye disease; solution-focused,
contextually relevant research is urgently needed to deliver innovative prevention
and treatment strategies and inform implementation of eye health within universal
health coverage
Implementation research is needed, particularly in LMICs, to guide effective delivery
of services within universal health coverage. Discovery research is needed for specific
areas that remain without efficacious interventions. The economic impact of vision
impairment, and the costs and benefits of interventions are only partly understood;
a coordinated global effort to systematically collect data is needed. A step-change
in the capacity of LMICs to do contextually relevant eye health research and a greater
commitment are needed to improve diversity and inclusion in the research community.
Despite this progress, business as usual will not keep pace with the demographic trends
of an ageing global population or address the inequities that persist in each country.
New threats to eye health are emerging, including the worldwide increase in diabetic
retinopathy, high myopia, retinopathy of prematurity, and chronic eye diseases of
ageing such as glaucoma and age-related macular degeneration. With the projected increase
in such conditions and their associated vision loss over the coming decades, urgent
action is needed to develop innovative treatments and deliver services at a greater
scale than previously achieved.
Good eye health at the community and national level has been marginalised as a luxury
available to only wealthy or urban areas. Eye health needs to be urgently brought
into the mainstream of national health and development policy, planning, financing,
and action.
The challenge is to develop and deliver comprehensive eye health services (promotion,
prevention, treatment, rehabilitation) that address the full range of eye conditions
within the context of universal health coverage. Accessing services should not bring
the risk of falling into poverty and services should be of high quality, as envisaged
by the WHO framework for health-care quality: effective, safe, people-centred, timely,
equitable, integrated, and efficient. To this framework we add the need for services
to be environmentally sustainable. Universal health coverage is not universal without
eye care.
Multiple obstacles need to be overcome to achieve universal coverage for eye health.
Important issues include complex barriers to availability and access to quality services,
cost, major shortages and maldistribution of well-trained personnel, and lack of suitable,
well maintained equipment and consumables. These issues are particularly widespread
in LMICs, but also occur in underserved communities in high-income countries. Strong
partnerships need to be formed with natural allies working in areas affected by eye
health, such as non-communicable diseases, neglected tropical diseases, healthy ageing,
children's services, education, disability, and rehabilitation. The eye health sector
has traditionally focused on treatment and rehabilitation, and underused health promotion
and prevention strategies to lessen the impact of eye disease and reduce inequality.
Solving these problems will depend on solutions established from high quality evidence
that can guide more effective implementation at scale. Evidence-based approaches will
need to address existing deficiencies in the supply and demand. Strategic investments
in discovery research, harnessing new findings from diverse fields, and implementation
research to guide effective scale up are needed globally. Encouragingly, developments
in telemedicine, mobile health, artificial intelligence, and distance learning could
potentially enable eye care professionals to deliver higher quality care that is more
plentiful, equitable, and cost-effective.
This Commission did a Grand Challenges in Global Eye Health prioritisation exercise
to highlight key areas for concerted research and action. This exercise has identified
a broad set of challenges spanning the fields of epidemiology, health systems, diagnostics,
therapeutics, and implementation. The most compelling of these issues, picked from
among 3400 suggestions proposed by 336 people from 118 countries, can help to frame
the future research agenda for global eye health.
In this Commission, we harness lessons learned from over two decades, present the
growing evidence for the life-transforming impact of eye care, and provide a thorough
understanding of rapid developments in the field. This report was created through
a broad consultation involving experts within and outside the eye care sector to help
inform governments and other stakeholders about the path forward for eye health beyond
2020, to further the SDGs (including universal health coverage), and work towards
a world without avoidable vision loss.
The next few years are a crucial time for the global eye health community and its
partners in health care, government, and other sectors to consider the successes and
challenges encountered in the past two decades, and at the same time to chart a way
forward for the upcoming decades. Moving forward requires building on the strong foundation
laid by WHO and partners in VISION 2020 with renewed impetus to ultimately deliver
high quality universal eye health care for all.
Introduction
In 2020, an estimated 596 million people worldwide had distance vision impairment
and a further 510 million had uncorrected near vision impairment.
1
Most of these people live in low-income and middle-income countries (LMIC). Eye health
is also affected by conditions that do not, at least initially, impair vision. Although
these conditions are not currently included in global prevalence estimates, they contribute
substantially to the unmet need for eye health services. Vision is important for many
aspects of life, and vision impairment can profoundly affect individuals, families,
and society. Eye health touches all lives, either directly or indirectly, through
its impact on those close to us.
The year 2020 marks the culmination of the global initiative to eliminate avoidable
blindness, VISION 2020: The Right to Sight (appendix 1 p 7). This initiative provided
the framework for national programmes to address eye health over the past 20 years.
In 2019, WHO published the World report on vision,
2
which was endorsed by the 73rd World Health Assembly in 2020. The report and resolution
call for the advancing of eye health as an integral part of universal health coverage,
by implementation of integrated people-centred eye care, following the approach outlined
in a broader health services framework.
3
The Lancet Global Health Commission on Global Eye Health contends that eye health
should be part of the mainstream agenda to achieve universal health coverage and sustainable
development. We define eye health as the state in which vision, ocular health, and
functional ability are maximised, thereby contributing to overall health and wellbeing,
social inclusion, and quality of life. Eye health can be considered both a process
and an outcome. We define eye care services as those that contribute to any of vision,
ocular health, or functional ability being maximised.
This report broadly divides into two halves. First, we present evidence for the importance
of eye health, supporting the case for urgent action. Second, looking beyond 2020,
we examine approaches to enable delivery of eye health services within universal health
coverage. In section 1 we summarise the visual system, vision impairment, and common
conditions. In section 2, we synthesise several reviews done by the Commission on
the relevance of eye health to the Sustainable Development Goals (SDGs), as well as
its impact on quality of life, general health, and mortality. In section 3, we describe
the magnitude and causes of vision impairment in 2020 and projected global and regional
trends. We explore service needs of people with non-vision impairing eye conditions.
We propose a more standardised approach to reporting population-based eye health surveys
and examine the disability weights applied to vision impairment. In section 4, we
summarise findings from a systematic review of eye health economics, identifying important
areas for future work. We present a new estimate of global lost productivity associated
with vision impairment for 2020, and an analysis of the cost-effectiveness ratios
for cataract surgery and refractive error services. In section 5, we outline a bibliometric
analysis of eye health research since 2000, and report a global Grand Challenges project,
highlighting crucial issues for concerted research and action. Lastly, we address
the question of how health systems can practically advance towards delivering high
quality integrated people-centred eye care within universal health coverage.
2
We argue that business as usual will be insufficient, as evidenced by new analysis
of effective cataract surgical coverage data. We examine service delivery components:
primary eye care and integration with general health services, workforce strengthening,
financing, health information systems, indicators, advocacy, and approaches to increase
quality and equity.
The development of global eye health
This Commission views global eye health through the global health framework articulated
by Koplan and colleagues.
4
Eye health started with an understanding of the anatomy, physiology, diseases of the
eye, and the development of clinical ophthalmology, the medical and surgical discipline
for diagnosis and treatment of eye diseases. From the mid-20th century onwards (figure
1), there have been major technological advances in microsurgical techniques for cataract
and other conditions, and equipment for diagnosis and treatment of major non-communicable
eye diseases, resulting in more effective interventions. There has been an enormous
demographic transition, with ageing populations and epidemiological changes from infectious
diseases and towards non-communicable diseases, requiring accessible and affordable
eye services with long-term follow-up. The increase in demand, emphasis on better
quality, and higher cost of more sophisticated diagnostic and treatment services is
requiring an increase in resources, which presents enormous public health challenges.
Figure 1
The development of global eye health
Blue circles indicate major global developments. Red circles indicate major treatments
and programmatic developments. WHA=World Health Assembly. IAPB=International Agency
for the Prevention of Blindness. RAAB=Rapid Assessment of Avoidable Blindness. RACSS=Rapid
Assessment of Cataract Surgical Services.
A timeline of major developments in global eye health. For a longer description, refer
to appendix 3 in the supplementary materials.
There are many lessons from the past 70 years that are instructive for the future
of global eye health (appendix 1 p 8). First, the importance of advocacy in creating
global platforms to address a public health issue. Second, the value of common definitions,
high quality data and research to develop global, regional, and national health programmes.
Third, the importance of identifying and addressing specific eye diseases of public
health importance that can be eliminated through public–private partnerships. Fourth,
that the VISION 2020 initiative created an easily understood message for advocacy
and planning services, and a global partnership involving different stakeholders in
public health, including the private sector and non-governmental organisations, which
resulted in extra resources and a common goal and focus. Fifth, that in promoting
a global programme, inadequate attention was given to the engagement and partnership
with ministries of health to ensure national ownership. There remains a need to integrate
eye care planning and resource allocation into national health systems and share the
achievements and successes. Sixth, that the transition from elimination of focal eye
diseases with regional programmes and international funding to the development of
comprehensive services to achieve universal eye health requires engagement, commitment,
and leadership by the ministries of health and the willingness of all stakeholders
(including the private sector) to support eye care services integrated within national
health-care plans.
Section 1: The eyes, vision impairment, and eye conditions
The visual system
Vision is the most dominant of human senses. The eye, its associated adnexal tissues,
and visual pathways within the brain are very intricate (figure 2). All these elements
need to function well together to achieve clear vision. The transparent optical elements
at the front of the eye (cornea and lens) focus light onto retinal photoreceptors.
These transduce light stimuli into neuronal impulses with which the brain creates
a three-dimensional image. Vision requires structural and physiological integrity
of the eyes, brain, and their connections. Disruption of any part of this pathway
causes vision impairment.
Figure 2
The human eye and common conditions
The location and clinical appearance of common causes of vision impairment.
Photographic images of the external appearance of trichiasis, corneal scar, cataract,
diabetic retinopathy, glaucoma, and age-related macular degeneration, with arrows
pointing to the affected part on a cross-sectional diagram of the eye. The purpose
is to show the complexity of the visual system.
Measuring visual function
Our eyesight has several distinct components that require specific types of testing,
including visual acuity (distance and near), contrast sensitivity, colour vision,
and visual fields (appendix 1 p 9). Tests of cerebral visual function include interpreting
the meaning of a picture or recognising faces. Vision-driven activities of daily living
can be captured using quality of life tools and vision function-related tasks. The
most common measure of visual function is distance visual acuity, which tests the
ability to discern letters or characters of high contrast at decreasing size using
the central retina.
Defining vision impairment
There have been progressive developments in WHO recommendations on how vision impairment
is measured, defined, and categorised, particularly in population-based epidemiological
surveys (appendix 1 p 10). International Classification of Diseases 11th Revision
(ICD-11) definitions of distance vision impairment were updated in 2019 with additional
subdivisions (table 1).
5
In the World report on vision,
2
WHO has signalled an intention to change the way vision impairment is reported, moving
away from only presenting visual acuity (with spectacles or contact lenses if available),
to also reporting uncorrected visual acuity (without spectacles or contact lenses
if worn). Including the measurement of uncorrected acuity allows for better estimation
of the ongoing service need and effective coverage of refractive error correction.
In prevalence surveys, vision impairment is generally reported as visual acuity in
the better seeing eye. This Commission uses visual acuity categories defined on Snellen
charts in metres when presenting data. Moderate and severe vision impairment (MSVI)
is defined as visual acuity worse than 6/18, but equal to or better than 3/60, and
blindness is defined as worse than 3/60 (table 1).
Table 1
WHO definitions for vision impairment
Distance visual acuity worse than
Distance visual acuity equal to or better than
0 - no vision impairment
Snellen, metres
NA
6/12
Snellen, feet
NA
20/40
LogMAR
NA
0·30
Decimal
NA
0·5
1 - mild vision impairment
Snellen, metres
6/12
6/18
Snellen, feet
20/40
20/60
LogMAR
0·30
0·50
Decimal
5/10 (0·5)
0·3
2 - moderate vision impairment
Snellen, metres
6/18
6/60
Snellen, feet
20/60
20/200
LogMAR
0·50
1·00
Decimal
3/10 (0·3)
0·1
3 - severe vision impairment
Snellen, metres
6/60
3/60
Snellen, feet
20/200
20/400
LogMAR
1·00
1·30
Decimal
1/10 (0·1)
0·05
4 - blindness
Snellen, metres
3/60
1/60*
Snellen, feet
20/400
5/300
LogMAR
1·30
1·80
Decimal
1/20 (0·05)
0·02
5 - blindness
Snellen, metres
1/60*
Light perception
Snellen, feet
5/300
Light perception
LogMAR
1·80
Light perception
Decimal
1/50 (0·02)
Light perception
6 - blindness
Test for light perception
Light perception
No light perception
Sourced from WHO, 2019.
5
There are several visual acuity chart types, which differ in the number and type of
characters (optotypes), spacing, and reporting formats. The participant is asked to
read down the chart, which has multiple rows with progressively smaller characters,
at a specific distance. The visual acuity is the line with the smallest characters
correctly identified. Snellen is expressed as a fraction: the numerator is the test
distance and the denominator is the smallest line size correctly read. For each vision
impairment category, the equivalent visual acuity thresholds are presented. NA=not
applicable. LogMAR=Logarithm of the Minimum Angle of Resolution.
*
Or counting fingers at 1 metre.
Common eye conditions
Many conditions can affect eye health, and even those that do not cause vision impairment
can produce pronounced morbidity. Common eye conditions covering key clinical features,
epidemiology, and management are summarised in appendix 1 (pp 11–14). The most common
causes of vision impairment in adults are uncorrected refractive error, cataract,
glaucoma, age-related macular degeneration, diabetic retinopathy, corneal scarring,
and trachoma (figure 2). Among children the leading causes of blindness and MSVI include
uncorrected refractive error, cataract, retinopathy of prematurity, congenital ocular
anomalies, corneal scarring, and cerebral visual impairment. There are also many conditions
causing pronounced symptoms (eg, pain, itching, discharge) and affecting a large number
of people without vision impairment. These include infectious and allergic conjunctivitis,
blepharitis, and dry eyes. The resulting morbidity needs to be addressed, forming
a substantial proportion of ophthalmic service work.
6
Social determinants of eye health
Public health approaches can prevent or treat most common eye diseases. Vision loss
and access to eye care is greatly affected by social determinants.7, 8 These encompass
many issues: social exclusion, gender inequity, racism, early childhood development,
educational opportunities, employment conditions, design and implementation of health
systems and public health programmes, urbanisation, globalisation, and commercial
determinants.7, 9 Inequity in health, between and within countries, is mostly attributable
to social determinants of health.
9
We will explore questions on access, equity, and health financing in the wider context
of universal health coverage in section 6.
10
Eye health during the life course
Life course perspectives focus on health trajectories during key developmental periods
and across the whole lifespan.
11
At each stage of life, multiple biological, socioeconomic, and environmental factors
interact to determine the development and course of eye health (figure 3).
13
Lifelong accumulation of risk factors, particularly during crucial periods of visual
development, influence visual function trajectories and underlie marked regional differences
in vision impairment.
12
Figure 3
Life course perspective on eye health
Arrows indicate the period in the life course in which different conditions typically
present. The yellow line indicates a hypothetical functional vision trajectory of
someone with a condition leading to increased vision impairment. The black line represents
the functional vision trajectory of someone who does not have a condition leading
to vision impairment. This figure is partly based on the concept of functional trajectories
illustrated in WHO, 2001.
12
The disability threshold represents the level of functional vision below which there
is functional vision impairment.
Multi-part figure portraying a life-course perspective on eye health. The purpose
is to show the many biological, social, and environmental determinants of eye disorders
at different stages in the life course and how differences in functional vision begin
in childhood and widen over the course of the person's lifetime. For a longer description,
refer to appendix 3 in the supplementary materials.
The socioeconomic environment into which a child is born has profound effects on eye
health over the individual's life course. Maternal nutritional and vaccination status,
and development of intrauterine infections (rubella, toxoplasmosis, syphilis, Zika)
are important determinants.14, 15 Preterm birth can lead to retinopathy of prematurity
and cerebral visual impairment. Low birthweight, fetal growth restriction, antenatal
maternal smoking and alcohol misuse, and social deprivation in childhood can also
cause vision impairment.16, 17 Congenital eye conditions frequently have strong genetic
components. Over the life course, biological and social determinants interact to determine
visual function. For example, retinoblastoma, a mostly genetically determined childhood
eye cancer, is not expected to vary by socioeconomic status. However, socioeconomic
and cultural factors that influence timely access and adherence to treatment are responsible
for important differences in vision and survival outcomes.
18
Visual acuity develops rapidly after birth and reaches full development at around
age 8 years. Early childhood is a crucial period because visual cortex plasticity
progressively diminishes after age 2 years. Since vision is important for early child
development, early onset vision impairment can lead to psychomotor and cognitive developmental
delay.
19
Visual stimulus deprivation between birth and age 8 years can lead to permanent vision
impairment (amblyopia) if not managed in a timely manner.
11
As the eyes grow and change shape there is a further sensitive period from childhood
to adolescence when a combination of genetic and environmental factors, such as light
exposure and time spent outdoors, can lead to myopia.
20
Several infectious diseases (trachoma, toxoplasmosis, onchocerciasis) begin in childhood
and lead to vision impairment later in life from accumulated pathology.21, 22
Many conditions are age-related. Presbyopia starts developing from age 35 years, as
the lens ages. Some conditions (eg, glaucoma and age-related macular degeneration)
have a complex polygenetic background, which can interact with nutrition and other
biological factors.23, 24 Diabetes and diabetic retinopathy are influenced by multiple
social and environmental determinants (diet, activity, obesity).
25
Cataract arises from multiple factors across the life course that promote lens ageing:
ultraviolet light exposure, smoking, poor nutrition, diabetes, and severe dehydration.
26
The life course trajectory of visual function is not fixed. Many conditions and risk
factors are amenable to interventions, including social determinants, along the spectrum
of promotion, prevention, treatment, and rehabilitation. These are complex issues,
requiring multisectoral approaches (nutrition, housing, social security, education),
long-term policies, and health system investment for greater health equity.13, 27
Section 2: The importance of eye health
Eye health and the SDGs
The UN SDGs are a group of broad target-driven goals for 2030, designed as a “blueprint
to achieve a better and more sustainable future for all”.
28
We did a series of systematic and scoping reviews to examine the relationship between
eye health and the SDGs. Together, these reviews provide compelling evidence that
improving access to eye health services will contribute to achieving many SDGs, including
the goals to reduce poverty and increased work productivity, health, education, and
equity (figure 4). Furthermore, progress towards many SDGs will benefit vision and
eye health. Therefore, we believe improving eye health should be viewed principally
as a human development issue.
Figure 4
Improving eye health and Sustainable Development Goals
Green arrows indicate relationships with direct evidence of a beneficial effect from
improving eye health on Sustainable Development Goals. Dashed green arrows represent
hypothesised direct beneficial effects. Black arrows represent possible indirect beneficial
effects.
A schematic showing boxes for each of the 17 Sustainable Development Goals and arrows
to indicate how improved eye health can have a beneficial effect on each of them,
either with direct evidence or indirect evidence of this effect
This Commission explored the relationship between eye health and general health and
wellbeing (SDG3) in six separate reviews, as well as doing a further review on the
relation between eye health and the 16 other SDGs (appendix 1 p 15; table 2).
57
In terms of these 16 SDGs, we showed that the provision of eye care services is associated
with improvements in workplace productivity,
29
household consumption,30, 31 household income,32, 33, 34, 35 employment prospects,
36
and economic productivity.37, 38, 39, 40 Economic benefits, particularly in resource-limited
communities, contribute to achieving SDGs such as poverty reduction (SDG1), food security
(SDG2), and decent work (SDG8). An example of benefits resulting from provision of
eye care services is shown by the Cataract Impact Study30, 31 done in Kenya, Bangladesh,
and the Philippines (appendix 2 p 3).
Table 2
Eye health and Sustainable Development Goals
Number and type of study
Summary of study findings
Poverty-related (SDGs 1, 2, 8)
Relative productivity in the workplace
One (randomised controlled trial)
Provision of free spectacles to tea workers with presbyopia in India improved workplace
relative productivity by 22% (p<0·0001)
29
Household per-capita expenditure
Two (prospective cohort studies)
Increase in household per-capita expenditure in people with vision impairment who
underwent cataract surgery—eg, in the Philippines, increase by 88% over 1 year (p<0·001)30,
31
Household income
Four (prospective cohort studies and one retrospective cohort study)
Household income increased after cataract surgery—eg, 1 year after provision of surgery
for marginalised communities in rural India,32, 33, 34 the proportion of households
with a monthly income (<1000 Rupees) decreased from 51% to 21% (p=0·05); in the USA,
35
children who became blind by age of 6 years and attended vision impairment schools
had a lower salary than those who attended public schools (possibly confounded by
other determinants)
Employment rates
One (retrospective cohort study)
Vocational rehabilitation services for vision impairment in the USA were positively
associated with paid employment—eg, training and support services increased odds of
obtaining paid employment (odds ratio 1·10, p=0·001)
36
Economic productivity
Four (cost-effectiveness and evaluation studies)
Benefits to economic productivity from cataract surgery37, 38 and trichiasis surgery39,
40—eg, there was a net 13-year US$123·4-billion return on investment from a 1-year
cohort after cataract surgery, including an increase in US national productivity of
US$25·4 billion
37
Quality education (SDG 4)
Academic test scores
Seven (randomised controlled trials and prospective cohort studies)
Providing children with spectacles improved academic test scores41, 42, 43, 44, 45,
46, 47—eg, in China, vision correction reduced the odds of failing a class by 44%
(p<0·01)
43
Reading or word identification
Two (cohort studies)
Improved reading and word identification with spectacle wear and attendance at specialised
schools35, 48
Inequalities (SDGs 5, 10)
Gender inequality
Three (systematic review with meta-analysis, and pair of cross-sectional surveys)
Reduced gender inequality in all-cause blindness, clinic attendance, cataract surgery
coverage, and trachoma treatment coverage following interventions to promote eye services
by trained rural community volunteers in low-income and middle-income countries;
49
free cataract screening and low-cost quality cataract surgery in China reduced gender
disparity in willingness to pay at 5-year follow-up (88% men, 91% women) compared
with baseline (67% men, 50% women)
50
Equity (per-capita expenditure)
One (cohort study)
People who had cataract surgery in Kenya, the Philippines, and Bangladesh were poorer
than non-visually impaired people before surgery (p≤0·02), but after surgery, there
was no difference in household per-capita expenditure between the groups (p≥0·2),
showing equity improvement
33
Inequalities in use of eye care services
One (series of repeat cross-sectional studies)
Free eye examinations in Scotland increased use of eye care services at the aggregate
level but widened inequalities by income (p<0·001) and education (p<0·001)
Sustainable cities and communities (SDG 11)
Driving-related difficulties
One (meta-analysis)
Reduced driving-related difficulties after cataract surgery (pooled odds ratio 0·12,
95% CI 0·10–0·16)
51
Motor vehicle crashes
Five (observational studies)
Cataract surgery reduced motor vehicle crashes (all studies statistically significant)52,
53, 54, 55, 56
Changes in eye health following an intervention are directly linked to one or more
Sustainable Development Goals.
Educational performance is linked to vision. Children with vision impairment have
poorer educational outcomes and are more likely to be excluded from schools (less
likely to attend). We found evidence that providing spectacles to children improves
educational performance, supporting quality education (SDG4), with effect sizes at
least as large as other health interventions.41, 42, 43, 44, 45 Improved education
is crucial to development, reducing poverty and hunger, and enabling work (SDGs 1,
2, and 8).
58
Improving eye health contributes to increased gender equity (SDG5) and reduced inequalities
(SDG10).
49
Cataract surgery can improve equity, measured by expenditure.
31
Women have poorer access to eye health services and more vision impairment; addressing
gender inequality will help advance eye health.
59
Specific interventions such as community outreach vision screening services increase
equity for conditions such as cataract and glaucoma among women, marginalised communities,
and older people.51, 60
Improved eye care can contribute to improving the sustainability of cities and communities
(SDG11). Studies52, 53, 54, 55, 56 show that improved vision enhances road safety,
thereby contributing to safer cities. Although no studies met our inclusion criteria
for the remaining SDGs, we contend that environmentally responsible eye health services
would reduce carbon emissions and plastic waste, thereby contributing to progress
towards the SDGs for affordable clean energy (SDG7), responsible consumption (SDG12),
climate action (SDG13), life below water (SDG14), and life on land (SDG15).61, 62
Unaddressed eye care needs in displaced populations underscore the potential for such
interventions to contribute to the resilience of these disadvantaged communities (SDG16).
63
Underlying all SDGs is SDG17, strengthening partnerships to achieve the goals. The
global eye health community provides examples of effective health-care partnerships,
including the GET2020 Alliance
64
and the African Programme for Onchocerciasis Control,
65
which have yielded major reductions in the disease burden.
Vision impairment and health and wellbeing
Vision impairment affects multiple functional domains (physical, cognitive, psychological,
social), and overall quality of life and wellbeing.66, 67 Here, we reflect on vision
impairment and inclusive development before summarising each review done by this Commission.
Vision impairment and inclusive development
The UN places great emphasis on “realization of the SDGs by, for and with persons
with disabilities”, including people with vision loss.
68
This emphasis recognises that people with vision-related disability play an important
part in achieving the SDGs, and their exclusion from schooling and employment is a
violation of their rights, as set out in the UN Convention on the Rights of Persons
with Disabilities. For example, children with vision impairment in multiple LMICs
are up to five times less likely to be in formal education than children without disabilities.
69
In high-income countries, where school attendance is usually mandatory, children with
vision impairment often achieve poorer outcomes (appendix 1 p 16)
70
and might face social exclusion and violence in schools, impacting their education.71,
72 People with vision impairment also experience reduced employment prospects and
are more likely to have low paid work rather than professional jobs.73, 74 Beyond
education and employment, vision impairment is linked to social exclusion including
the experience of negative attitudes,
75
violence and bullying,
76
sexual assault,
77
and loneliness.
The key to promoting the rights of people with vision impairment is to improve functional
ability by increasing access to vision rehabilitation services and creating more inclusive
environments through strengthening inclusive policies and laws, providing assistive
technology, inclusive education and vocational training, advocacy, and creating accessible
spaces. To ensure vision rehabilitation is considered as an integral component of
eye care services in pursuit of universal health coverage, this Commission calls for
adoption of a new definition of eye health, which involves maximised vision, ocular
health, and functional ability, thereby contributing to overall health, wellbeing,
social inclusion, and quality of life.
The International Classification of Functioning, Disability and Health model by WHO
67
can help to contextualise the impact of vision impairment on a person's life, including
walking, eating, education, employment, and social participation (appendix 1 p 16).
This model illustrates the importance of environmental factors to maximise participation
of people with vision impairment in society, including the opportunity to access vision
rehabilitation.
Studies have shown78, 79, 80 that vision screening and provision of glasses helps
to improve educational outcomes for children with vision impairment, and the provision
of other types of assistive devices and reading aids is also likely to be effective.
However, spectacles are not universally available and the ability to read and write
using assistive technology, such as screen reading software or an electronic braille
display, requires skills; the means to procure, purchase, and power the technology;
and access to information in a compatible format. Compensatory skills learned in vision
rehabilitation, such as orientation and mobility using a white cane, presupposes the
necessary infrastructure of predictable paths and spaces in which the person can confidently
move. These skills might be useful in one context but are not transferable to another—eg,
in an urban setting with requisite infrastructure versus a rural setting without appropriate
infrastructure. Clearly, much needs to be done to maximise the function and societal
participation for people living with vision impairment. This is explored further in
section 6.
The Commission calls for a more holistic approach to the health of people with vision
impairment, who might have great difficulties with other health conditions and some
might be perceived to no longer require eye care services.81, 82 We see integrated
people-centred eye care as an opportunity to ensure that any reorientation of care
promotes the rights of people to access eye care that they require during the life
course, which is not limited to the condition causing their vision loss.
Vision impairment and quality of life
Assessment of quality of life describes an overall state of wellbeing from the individual's
perspective. Health-related quality of life describes the degree to which health affects
wellbeing, whereas vision-related quality of life reflects the degree to which vision
affects wellbeing.83, 84 Health-related quality of life and vision-related quality
of life are used to understand how vision impairment affects wellbeing from a person-centred
perspective, and how this perspective is influenced by personal, social, and environmental
contexts.
To summarise the extensive research on the impact of vision impairment, eye conditions,
and ophthalmic interventions on the quality of life, we conducted an umbrella review
of systematic reviews (appendix 1 p 17).
85
In total, 69 systematic reviews were identified. Nine of those reviews evaluated the
relationship between quality of life and vision impairment or specific eye conditions,
such as age-related macular degeneration, glaucoma, or diabetic retinopathy, and all
concluded that vision loss and eye disease were associated with poor quality of life
outcomes. The remaining 60 reviews evaluated quality of life between groups receiving
alternative ophthalmic interventions, active treatment (appendix 1 p 18), and controls
who did not receive an ophthalmic intervention. 75% of ophthalmic interventions showed
a positive impact on quality of life. Most notably, cataract surgery and anti-vascular
endothelial growth factor treatment for age-related macular degeneration, diabetic
macular oedema, and macular oedema secondary to other causes resulted in improved
quality of life (appendix 1 p 18).
Our umbrella review reinforces the close relationship between good vision and enhanced
quality of life and provides a strong argument for increased investment in eye health.
The umbrella review also highlights that despite quality of life being commonly assessed
in ophthalmic studies, definitions varied widely. This Commission calls for the development
and the adoption of standardised and culturally sensitive measures of quality of life
for eye health research, to better understand the effect of vision impairment and
ophthalmic interventions from the patient's perspective.
Vision impairment and other health conditions
People with self-reported vision impairment have increased risk of some health conditions
such as depression, dementia, cardiovascular disease, and lung cancer.86, 87, 88,
89 The causal relationship between vision impairment and other conditions is complex,
but can be broadly summarised by three different pathways (figure 5); (1) vision impairment
causes or exacerbates other conditions either directly, through injuries, or indirectly—eg,
through reduced access to health care, limitations in physical activity, or increased
social isolation; (2) vision impairment and other conditions share common risk factors—eg,
smoking, poverty, reduced health-care access, ageing, or poor diet; and (3) systemic
health problems can lead to vision impairment—eg, diabetes and diabetic retinopathy,
cancer and ocular metastases, and dementia—limiting access to eye health services.
Figure 5
Relationships between vision impairment and general health
These associations are derived from multiple literature reviews done by this Commission.
*Hypothetical common degenerative pathways.
A schematic of boxes and arrows illustrating common risk factors or confounders for
vision impairment, ocular problems that can contribute to other health problems, other
health problems that can lead to ocular problems, and other health problems that contribute
to compromised health and mortality
More than one pathway seems to underlie the association between vision impairment
and other health conditions, making the pathways difficult to elucidate. Here, we
summarise a rapid review led by one of the commissioners to investigate the relationship
between vision impairment and mental health; and cardiovascular disease, respiratory
disease, and cancer (appendix 1 p 19).
The rapid review found that vision impairment is likely to be linked to depressive
illness. A meta-analysis of data from high-income and middle-income countries found
that 25% of people with eye conditions also have pronounced depressive symptoms.
87
Depressive symptoms have been shown to increase with more severe eye disease.90, 91
Another meta-analysis found a significant reduction in depression after cataract surgery.
92
A review done by members of this Commission, in addition to the rapid review, found
an association between vision impairment and dementia, and suggested that interventions
to improve vision could possibly slow down cognitive decline (panel 1).
Panel 1
Vision impairment and dementia
In 2016, 43·8 million adults aged 60 years and older had dementia, with numbers doubling
every 20 years (GBD Dementia Collaborators, 2019; Prince et al, 2013). The estimated
global economic cost of dementia in 2018 was US$1 trillion (Wimo et al, 2017). Although
there are few effective treatments (Mukaden et al, 2019), in the past decade vision
impairment has emerged as a potential modifiable risk factor (Ehrlich et al, 2019;
Swenor et al, 2019; Zheng et al, 2018; Brenowitz et al, 2019; Fischer et al, 2016;
Schubert et al, 2017; Rogers et al, 2010; Nael et al, 2019; Maharani et al, 2018).
Longitudinal studies indicate that vision impairment might be a risk factor for dementia
and accelerated cognitive decline (Swenor et al, 2019; Zheng et al, 2018; Fischer
et al, 2016; Rogers et al, 2010; Tran et al, 2020). In Singapore, adults with vision
impairment had an accelerated cognitive decline (Lim et al, 2020). In the USA, vision
impairment was associated with 55% increased hazard of incident cognitive impairment
and the effect of declining vision on future declines in Mini-Mental State Exam scores
was significantly stronger than the reverse association (Swenor et al, 2019). Among
more than 1000 women in the USA, incident dementia increased with vision impairment
severity (Tran et al, 2020). In France, near vision impairment was associated with
increased dementia risk at 4 years, although this association waned with longer follow-up
(Nael et al, 2019). Preliminary data suggest that cataract surgery might decrease
risk of cognitive decline. In an English longitudinal study of ageing, cognitive decline
slowed down significantly (by 50%) following cataract surgery (Maharani et al, 2018).
Together, these data provide strong evidence of an association between vision impairment
and dementia.
Most research on vision impairment with cognitive function and dementia has been done
in high-income countries, with few ongoing studies from LMICs (Lee et al, 2019; Kowal
et al, 2012). However, there is a pressing need in all settings to test causal pathways
that might underlie the association of vision impairment with cognitive decline and
dementia. Although several hypotheses have been proposed to account for this relationship
(Whitson et al, 2018), none have been rigorously tested. The postulated reason that
dementia might be more prevalent in those with poor vision could be because of a single
common underlying cause, such as neurodegenerative or microvascular disease. This
reason is supported by the possible use of retinal imaging as a biomarker for dementia
(Chan et al, 2019). Several indirect pathways have also been proposed. Poor vision
is known to increase cognitive load (Pigeon et al, 2019), a stressor that might increase
dementia risk. Another possibility is that decreased visual input could result in
direct alteration of brain structure. Finally, vision impairment might exert its effect
on dementia risk by limiting social and physical activity, factors that have separately
been shown to elevate dementia risk (Tan et al, 2017; Reas et al, 2019; Rafnsson et
al, 2020).
Vision impairment is possibly a modifiable risk factor for dementia because most of
vision loss is preventable or treatable. However, vision impairment has not been widely
recognised as such outside of the vision research community (Livingstone et al, 2020).
Additional work is needed to ensure that various stakeholders invest in the importance
of characterising cognitive trajectories of older adults with vision and multisensory
impairments and in the testing of interventions to slow cognitive decline across diverse
cultural and geographic contexts. References for this panel can be found in appendix
1 (p 105).
Indirect pathways might also link vision impairment with systemic conditions—eg, as
a barrier to accessing health care. A UK study
93
found that women with vision impairment were less likely to participate in breast
and bowel cancer screening than women with no disabilities, after adjusting for confounding
factors. Reduced physical activity might be another important factor; older adults
in the USA with vision impairment took 26% fewer steps each day and spent 48% less
time in moderate or vigorous physical activity than those with healthy vision.94,
95 Reduced physical activity is a leading risk factor for non-communicable eye diseases.
Ocular and general health conditions might share common risk factors. Smoking is associated
with lung cancer, chronic obstructive pulmonary disease, stroke, coronary artery disease,
dementia, and numerous eye conditions including cataract, age-related macular degeneration,
diabetic retinopathy, and possibly glaucoma.96, 97, 98, 99 Sun exposure is associated
with cataract and skin cancer.
100
Poor diet, obesity, and low physical activity are common to systemic diseases and
eye diseases. Consumption of vegetables, fruit, and micronutrients are protective
for some cancers, cardiovascular disease, and depression. Similarly, a Mediterranean
diet and some micronutrients might protect against cardiovascular disease and cataract,
diabetic retinopathy, glaucoma, and age-related macular degeneration.97, 101, 102,
103
For cases in which systemic diseases directly cause vision impairment, the pathophysiology
is often better understood. However, causative effects of general illness on vision
impairment can also be mediated indirectly through the reverse of some of the indirect
pathways. For example, poor systemic health might limit physical activity, which might
increase risk of diabetic retinopathy
104
and glaucoma progression.
105
Preventive initiatives that reduce smoking, improve diet, and promote physical activity
are likely to have shared benefits for general and ocular health. The question of
whether interventions to ameliorate vision impairment can also improve general health
is an important area for future investigation.
Dual sensory impairment
In a similar way to vision impairment, hearing impairment is also associated with
age. Therefore, dual sensory impairment—ie, when these two conditions occur concurrently—is
an important consideration for healthy ageing.
106
This Commission did a scoping review to summarise dual sensory impairment definitions,
prevalence, and the effect on people's lives (appendix 1 p 21). We found striking
heterogeneity in the definitions of dual sensory impairment (67 variations in 151
studies), the age groups included, and prevalence estimates. Despite this heterogeneity,
dual sensory impairment appears prevalent in older adults (increasing prevalence with
age), and many studies reported that people with dual sensory impairment had worse
physical and psychosocial health outcomes and reduced social participation compared
with those who had only vision impairment or hearing impairment. In the context of
an ageing population, this Commission calls for greater emphasis on dual sensory impairment,
including a consensus on definitions and reporting, and collaborative efforts to advance
the research, clinical care, and social inclusion for this population.
Vision and driving
Driving is a complex vision-dependent task with a risk of road traffic injury. SDG3
(good health and wellbeing) and SDG11 (improving the sustainability of cities and
communities) include targets to reduce road traffic injury, which is the leading cause
of death for children and young adults.
107
This Commission did a systematic review of the relationship between vision impairment
and driving, outlined in appendix 1 (pp 22–23). Findings from 115 studies showed that
some causes of vision impairment, such as glaucoma and cataract, are associated with
motor vehicle collisions and unsafe driving practices.108, 109 Interventions such
as cataract surgery can reduce the risk of motor vehicle collisions,56, 110 whereas
anti-vascular endothelial growth factor (for age-related macular degeneration or diabetic
macular oedema) can enable continued participation in driving.111, 112 Most of these
data were from high-income countries (88%). With the increasing reliance on motor
vehicle transport, maintaining vision is essential for drivers to prevent road traffic
injuries and promote independent mobility. This Commission calls for ready access
to eye care services for drivers and evidence-based legislation to mitigate the risks
associated with vision impairment and driving, particularly in LMICs.
Vision impairment and falls
Globally, a third of people aged over 65 years fall each year and falls are the leading
cause of injury-related death among adults over 70 years.113, 114 This Commission
did a systematic review to assess the relationship between vision impairment, ophthalmic
interventions, and falls (appendix 1 pp 23–24). The main findings from 129 studies
showed that vision impairment is an independent risk factor for falls among older
adults and that timely access to ophthalmic interventions such as cataract surgery
can reduce the risk of falls.115, 116, 117 On the basis of these findings, we call
for vision to be included in risk assessment tools for falls and for eye care services
to be better integrated with fall prevention efforts.
Vision impairment and mortality
Vision impairment seems to be associated with an increased risk of all-cause mortality.118,
119, 120, 121 Several explanations are possible for this association in relation to
non-communicable eye diseases, mental health, and injuries (figure 5). This Commission
did a systematic review and meta-analysis to contribute an updated appraisal of the
literature, assessment of bias, and overall grading of the quality of evidence (appendix
1 p 24).
122
We included studies that measured visual acuity and contained at least 1-year follow-up
to assess all-cause mortality. A total of 28 studies representing 30 cohorts were
included. Studies came from 12 countries in Africa, Asia, Australia, Europe, and North
America and included 451 001 participants.
The primary meta-analysis included studies comparing mortality among participants
with vision better or worse than the prespecified thresholds of 6/12, 6/18, and 6/60.
Since age is a common risk factor for vision impairment and mortality, all measures
of association in this meta-analysis were age-adjusted. Where available, we also selected
estimates adjusted for other possible confounders such as smoking, diabetes, access
to health care, and socioeconomic status. Figure 6 presents the results of this analysis.
We found that the hazard of mortality was higher among those with visual acuity <6/12
(hazard ratio [HR] 1·29, 95% CI 1·20–1·39) and <6/18 (1·43, 1·22–1·68) compared to
those with better vision. At the 6/60 threshold, the hazard of mortality was higher
than for those with visual acuity of ≥6/18 (1·89, 1·45–2·47). However, no significant
association was detected when comparing those with visual acuity better and worse
than 6/60 (1·02, 0·79–1·32), probably because the reference group contained participants
with a substantial degree of vision impairment (≥6/60). We evaluated the certainty
of evidence using the Grades of Recommendation, Assessment, Development, and Evaluation
(GRADE) framework and judged it to be of moderate certainty.
123
Additional research is needed to better understand factors that modulate mortality
risk among adults with vision impairment, and to more fully characterise risk in LMICs,
where data remain scarce. Given the prevailing finding of an association between vision
impairment and mortality, future calculations of disability-adjusted life-years might
include years of life lost due to vision impairment, which could provide a more complete
estimate of the overall global burden of vision impairment. The impact of vision impairment
on mortality should drive action to address avoidable sight loss and reinforces the
relevance of eye health to SDG3 (good health and wellbeing) and the SDGs in general.
Figure 6
Vision impairment and mortality
Random-effects meta-analysis results showing the maximally adjusted pooled hazard
of mortality in adults with (A) mild vision impairment or worse (<6/12 compared with
≥6/12); (B) moderate vision impairment or worse (<6/18 compared with ≥6/18); (C) severe
vision impairment or worse (<6/60 compared with ≥6/18); and (D) severe vision impairment
or worse (<6/60 compared with ≥6/60). Events are defined as the number of participants
in the study who died, and N is the total number of participants in the study. 12
cohorts that were included in the systematic review are not depicted in this figure
for the following reasons: they used other vision impairment thresholds that could
not be aggregated with these studies; they reported results per unit difference in
visual acuity; they reported odds ratios or risk ratios that could not be pooled with
HRs; or they compared a reference category of participants with good vision to participants
with various vision impairment categories. References can be found in appendix 1 (p
100).
A forest plot illustrating the findings of a systematic review and meta-analysis of
the association between visual impairment and mortality. Findings are shown in terms
of hazard ratios and 95% confidence intervals, grouped by different levels of visual
acuity. The results show a clear association between visual impairment and mortality
except for visual acuity <6/60 (compared with 6/60).
Section 3: Magnitude of eye disease
Burden of global vision impairment in 2020
World Health Assembly Resolution 66/11 Universal eye health: a global action plan
2014–19, opened up a new opportunity for WHO member states to progress with their
efforts to prevent vision impairment and strengthen vision loss rehabilitation in
their countries.
124
Central to this process is an understanding of the prevalence, magnitude, and causes
of vision loss.
The Vision Loss Expert Group (VLEG) has worked with the Global Burden of Disease (GBD)
collaborators since 2007 to produce global vision loss metrics. The VLEG published
global estimates for vision loss and modelled temporal change for the first time in
2010,125, 126 and subsequently in 2015.127, 128 The results from 2015 were also published
in the World report on vision by WHO.
2
These analyses use definitions from the ICD-11 for distance and near vision impairment.
The VLEG–GBD group collaborators have jointly published estimates for 2020, which
we summarised here.
1
Globally, of 7·79 billion people living in 2020, it is estimated that 43·28 million
(95% uncertainty interval [UI] 37·57–48·36) are blind with presenting visual acuity
of worse than 3/60 in the better eye and a crude all-age prevalence of 0·55% (0·48–0·61;
table 3). Of these, 55% or 23·88 million (20·83–26·82) are women. The prevalence of
blindness increases with age; most (77·7% or 33·61 million, 28·58–38·54) people with
blindness are aged 50 years or older.
Table 3
Global number, crude prevalence, and age-adjusted prevalence of vision impairment
in 2020
Blindness
Moderate and severe vision impairment
Mild vision impairment
Number, millions
Crude prevalence
Age-standardised prevalence
Number, millions
Crude prevalence
Age-standardised prevalence
Number, millions
Crude prevalence
Age-standardised prevalence
All
All ages
43·28 (37·57–48·36)
0·55% (0·48–0·61)
0·52% (0·46–0·59)
295·09 (267·32–324·60)
3·74% (3·39–4·12)
3·58% (3·24–3·92)
257·83 (232·66–285·34)
3·27% (2·95–3·62)
3·20% (2·89–3·54)
≥50 years
33·61 (28·58–38·54)
1·77% (1·51–2·03)
1·85% (1·57–2·11)
206·42 (182·37–233·16)
10·87% (9·61–12·28)
11·18% (9·90–12·61)
142·88 (122·12–163·00)
7·53% (6·43–8·59)
7·73% (6·62–8·82)
Men
All ages
19·40 (16·95–21·70)
0·49% (0·43–0·55)
0·50% (0·44–0·56)
132·12 (119·77–145·68)
3·34% (3·03–3·68)
3·37% (3·05–3·70)
115·54 (104·37–127·95)
2·92% (2·64–3·23)
2·97% (2·68–3·28)
≥50 years
14·56 (12·38–16·73)
1·61% (1·37–1·85)
1·76% (1·49–2·01)
89·44 (78·70–101·43)
9·87% (8·68–11·19)
10·49% (9·30–11·83)
60·56 (51·60–69·25)
6·68% (5·69–7·64)
7·11% (6·07–8·11)
Women
All ages
23·88 (20·83–26·82)
0·61% (0·53–0·68)
0·54% (0·47–0·61)
162·97 (147·43–179·21)
4·15% (3·75–4·56)
3·77% (3·42–4·13)
142·29 (128·45–157·36)
3·62% (3·27–4·00)
3·42% (3·10–3·78)
≥50 years
19·05 (16·22–21·82)
1·92% (1·64–2·20)
1·92% (1·63–2·20)
116·98 (103·72–131·93)
11·79% (10·46–13·30)
11·78% (10·44–13·30)
82·32 (70·52–93·83)
8·30% (7·11–9·46)
8·29% (7·10–9·45)
Data are n (95% uncertainty interval) or % (95% uncertainty interval). Data taken
from VLEG–GBD, 2020.
1
Moderate or severe vision impairment (MSVI) is defined as presenting visual acuity
of worse than 6/18 to 3/60 in the better eye. MSVI is estimated to affect 295·09 million
(95% UI 267·32–324·60) people, which is 3·74% (3·39–4·12) of the global population
(table 3). A further 257·83 million (232·66–285·34) or 3·27% (2·95–3·62) have mild
vision impairment, defined as presenting visual acuity of worse than 6/12 to 6/18
in the better eye. Globally, an estimated 509·69 million (371·11–666·66) people globally
have near vision impairment from uncorrected presbyopia, representing 22·06% (15·52–29·62)
of people aged 50 years and older. Similar to the gender imbalance in blindness, 55%
or 162·97 million (147·43–179·21) of individuals who have MSVI and 55% or 142·29 million
(128·45–157·36) of people with mild vision impairment are women.
Globally, 91·75% of people who are blind (39·62 million, 95% UI 34·64–44·79) and 87·68%
of those with MSVI (257·90 million, 231·87–285·81) live in LMICs. There are large
interregional differences in crude and age-standardised prevalence of blindness and
MSVI for 2020 (figure 7; appendix 1 p 26). Western sub-Saharan Africa has the highest
age-standardised prevalence of blindness (1·11%, 0·95–1·26) and high-income North
America has the lowest prevalence (0·12%, 0·11–0·14). South Asia has the highest age-standardised
overall prevalence of MSVI (6·44%, 5·79–7·13). The largest number of blind people
live in South Asia (11·9 million, 10·4–13·4), followed by east Asia (9·1 million,
7·9–10·3), and southeast Asia (5·9 million, 5·2–6·7), because of the large regional
populations (figure 7; appendix 1 p 26). MSVI follows a similar pattern.
Figure 7
Vision impairment by Global Burden of Disease region
(A) Age-standardised prevalence of vision impairment and (B) number of people with
vision impairment. Data from VLEG–GBD.
1
MSVI=moderate and severe vision impairment.
Two bar charts illustrating the geographical differences in the global burden of vision
impairment. The highest prevalence is in South Asia and the lowest is in high-income
North America. The highest absolute numbers are in South Asia and the lowest are in
Oceania.
The World report on vision
2
by WHO used estimates of people with distance vision impairment for 2015, provided
by the VLEG, and combined these with an estimated 1·8 billion people with addressed
(974 million) and unaddressed (826 million) near vision impairment due to presbyopia,
derived from a different model, to reach an overall figure of 2·2 billion people with
vision impairment.127, 128, 129 These 2015 estimates have now been superseded by 2020
estimates from the VLEG–GBD group.
In summary, for 2020, there are an estimated 596 million people with distance vision
impairment and a further 510 million with uncorrected presbyopia. These estimates
do not include people who have already received spectacles or contact lenses to correct
distance refractive error or presbyopia, because reliable population-based data are
scarce. However, this group probably represents a very large number of people who
require ongoing services to meet their eye health needs.129, 130
Causes of global vision impairment in 2020
The leading causes of blindness globally are cataract (17·01 million, 95% UI 14·40–19·93),
uncorrected refractive error (3·70 million, 3·10–4·29), glaucoma (3·61 million, 2·81–4·42),
age-related macular degeneration (1·85 million, 1·35–2·43), and diabetic retinopathy
(1·07 million, 0·76–1·51; appendix 1 p 27).
131
Notably, 37% (16·04 million, 14·00–18·06) of all blindness is attributable to a variety
of other conditions. This group cannot be overlooked when focusing on the five leading
causes of blindness. A person can have more than one cause of vision impairment; however,
epidemiological studies tend to report only the primary cause.
In 2020, the leading causes of MSVI globally are uncorrected refractive error (157·49
million, 140·30–175·54), followed by cataract (83·48 million, 71·76–95·98), age-related
macular degeneration (6·23 million, 5·04–7·59), glaucoma (4·14 million, 3·24–5·18),
and diabetic retinopathy (3·28 million, 2·41–4·34; appendix 1 p 28).
1
Regions with particularly high prevalence of cataract blindness (as a proportion of
all-cause blindness) include south Asia, Oceania, and southeast Asia, where cataract
is responsible for around half of all blindness in 2020 (figure 8).
131
In high-income regions, glaucoma and age-related macular degeneration account for
a greater proportion of blindness than other regions. In all regions, uncorrected
refractive error is responsible for most MSVI. In 2020, 77·3% of people with blindness
and MSVI have an avoidable cause, defined as cataract or uncorrected refractive error;
increasing to 90·9% if near vision impairment is included.
Figure 8
Causes of vision impairment by Global Burden of Disease region
(A) Blindness and (B) moderate and severe vision impairment attributable to the five
leading causes of vision impairment and other conditions (combined), all ages. Data
are presented for the 21 Global Burden of Disease regions. Data from VLEG–GBD.
131
Two bar charts illustrating the proportion of blindness and moderate and severe vision
impairment resulting from the five leading causes (plus all other causes combined)
by Global Burden of Disease region. Cataract is shown to cause the highest proportion
of blindness globally, and uncorrected refractive error the highest proportion of
moderate and severe vision impairment.
Vision impairment in children
Data on vision impairment in children and adults younger than 40 years are scarce.
Surveys need to be larger because blindness prevalence is lower in this age group
(3 per 10 000 children in high-income countries, 10 per 10 000 in low-income countries)
and some conditions appear as clusters. Measuring visual acuity of young children
is challenging. As a result, population-based data are rare and mostly consist of
school surveys. Mindful of these data limitations, the VLEG–GBD group has estimated
that for 2020, 1·44 million children aged 0–14 years are blind (including uncorrected
refractive error), 22·16 million have MSVI, and 46·60 million have mild vision impairment.
In 1990, WHO estimated that 1·5 million children (aged 0–15 years) worldwide were
blind, excluding those with refractive errors.
132
In 1999, WHO updated this estimate using an alternative method based on under-5 mortality
rate as a proxy indicator for prevalence of blindness in children aged 0–15 years;
reporting 1·4 million children.
133
The rationale was that many causes of blindness in children also cause mortality,
such as measles infection, vitamin A deficiency, meningitis, malaria, birth hypoxia,
and prematurity. This prevalence was re-estimated at 1·14 million for 2015.
134
Using the same method, this Commission re-estimated prevalence of blindness to be
1·02 million for 2020; representing a global prevalence of 4·8 per 10 000 children
(appendix 1 pp 29–31). Further decline reflects a fall in under-5 mortality rate and
stabilisation of the global population of children at 2·1 billion. South Asia and
Western sub-Saharan Africa account for almost half (45·6%) of all children who are
blind (appendix 1 p 30).
Overall, these two different estimation approaches have produced similar values. However,
there is a pressing need for new methods to obtain more extensive survey data that
would be representative of the population and would improve the estimates of vision
impairment in children.
Trends in vision impairment
To model temporal trends, the VLEG–GBD group
1
generated forecasts of vision impairment prevalence for 1990–2019 (in 5-year increments),
using age-specific prevalence as input into a regression model with year, region,
and age as predictors. In the past 30 years, age-standardised prevalence of blindness
has reduced by approximately 28·5%. By 2050, the number of people who are blind is
predicted to increase to 61·05 million globally (95% UI 52·85–69·27). For MSVI, the
number affected is expected to rise to 474·12 million (428·43–518·23), followed by
360·35 million (321·96–399·96) for mild vision impairment, and 865·67 million (628·79–1154·14)
for vision impairment from uncorrected presbyopia (figure 9).
Figure 9
Forecast to 2050 of global cases of blindness and vision impairment by sex
Reproduced from VLEG–GBD, 2020.
1
Four line graphs showing the expected change in the number of cases of mild vision
impairment, moderate and severe vision impairment, blindness, and vision impairment
from uncorrected presbyopia between 1990 and 2050. The graphs show a higher number
of cases for women than men at all timepoints and for all conditions.
These trends are continuing—largely driven by population ageing and changes in disease
patterns. UN projections
135
indicate a substantial increase in the number of people aged 65 years and older over
the next 30 years, from 700 million to 1·5 billion, with the largest increase in LMICs.
Many conditions causing vision impairment become more prevalent with age.
Projections suggest that the proportion of people with vision loss who are women will
increase (figure 9).
1
When actual numbers are assessed, there are more women than men living with blindness
and MSVI in all regions of the world (figure 10). This gender imbalance can be attributed
to demographic factors (women living longer than men) and social factors (women having
reduced access to care). To adjust for demographic differences, age-standardised prevalence
can be compared to provide a better estimate of gender inequity. Even after this adjustment,
MSVI prevalence is higher in women in all regions of the world (except in two regions:
central and southern sub-Saharan Africa; appendix 1 p 32). Men have lower age-standardised
prevalence of blindness in less than half of world regions. Globally, for every 100
men with blindness or MSVI there are 108 women with blindness and 112 women with MSVI.
The persistent gender differences after age-standardisation suggest that, in some
settings, greater vision loss in women is socially determined. Some groups of women
have difficulty accessing eye care, particularly in southeast Asia. These demographic
and social factors have major implications for the pursuit of gender equity within
universal health coverage.
Figure 10
Women with blindness and MSVI
Excess number of women over men, in adults (≥50 years). Data are plotted for the 21
Global Burden of Disease regions using a log scale. Size of the circle represents
the total number of adults with blindness and MSVI in that region. Oceania has less
than 1000 excess women with MSVI and was not plotted on this figure. Data available
in appendix 1 (p 33), from VLEG–GBD.
1
MSVI=moderate and severe vision impairment.
Bubble chart plotting excess number of women with moderate and severe vision impairment
against excess number of women with blindness. East Asia is the region with the greatest
excess of women with both blindness and moderate and severe vision impairment. Australasia
is the region with the lowest.
There are several important risk factor and disease-specific trends that are changing
the epidemiology of eye disease in many populations (panel 2). In the past three decades
there has been substantial success in controlling trachoma and onchocerciasis. Environmental
factors and educational practices, particularly in Asian populations, are believed
to explain the pronounced increase in myopia in schoolchildren and young adults. Increasing
urbanisation, less active lifestyles, and altered diets are contributing to a marked
increase in diabetes, resulting in more people affected by diabetic retinopathy (appendix
1 p 33). Myopia and diabetic retinopathy require specific prevention and management
strategies. New treatments for wet age-related macular degeneration have reduced the
progression to blindness from this cause.
Panel 2
The changing epidemiology of eye disease
Changing epidemiology of eye disease
References for this panel can be found in appendix 1 (pp 106–08).
Global increase of myopia
Myopia is a major growing public health challenge. More than 2 billion people worldwide
have a degree of myopia (≥–0·5 dioptres), 15% of whom have high myopia (≥–5 dioptres;
Holden et al, 2016; WHO, 2015). In 2020, an estimated 161 million people worldwide
were blind or had moderate to severe vision impairment from uncorrected refractive
error, the leading cause of vision impairment (Bourne et al, 2020). By 2050, myopia
is expected to affect 5 billion people, more than half of the projected global population
(Holden et al, 2016), which will place an enormous burden on health services to provide
spectacles and detect and manage serious eye diseases caused by high myopia (appendix
1 p 34). Uncorrected myopia and myopic macular degeneration, a major complication
of high myopia, were responsible for approximately US$250 billion lost global productivity
in 2015 (Naidoo et al, 2019).
Myopia is rapidly increasing worldwide (Holden et al, 2016; Naidoo et al, 2019; Koh
et al, 2014; Vitale et al, 2008; Morgan et al, 2019). Myopia is considered a genetic
condition with more than 200 associated genes, individually and in combination these
genes contribute to only a small proportion of myopia (Tedja et al, 2019). Furthermore,
the rapid global increase in school myopia cannot be explained by genetics alone,
given the prevalence rise in a short timeframe (Morgan et al, 2019). Environmental
factors and gene–environment interactions are thought to play a large role.
The large increase in myopia prevalence in east and southeast Asia since 1960 have
mirrored rapid economic development and the associated educational and lifestyle changes
in societies such as Hong Kong, Taiwan, Singapore, and South Korea (Siddiqi et al,
2001). The prevalence of myopia in people aged 20 years has risen from 20–30% in the
mid-20th century to more than 80% nowadays (Morgan et al, 2019). China has also shown
a rapid increase in myopia in the past few decades (Morgan et al, 2019; Sun et al,
2015). High myopia is becoming more prevalent and developing at a younger age (WHO,
2015), resulting in increased vision impairment and blindness from its complications
(myopic macular degeneration, retinal detachment, and glaucoma; Liu et al, 2020; Fricke
et al, 2018).
Educational pressures are substantially higher in east and southeast Asia than in
other world regions (Morgan et al, 2019), which creates two interrelated environmental
risk factors for myopia: a combination of increased near work activity (including
screen time with increasing use of smart devices) and reduced outdoor activity (Dirani
et al, 2019). With long periods of near work (Huang et al, 2015), children from east
and southeast Asia spend less time outdoors than their peers in countries such as
Australia (Rose et al, 2016; Wen et al, 2020). Clinical trials of increased time outdoors
report a 25–50% reduction in incident myopia, although the precise mechanisms for
these effects are not yet understood (Wu et al, 2018).
Finally, optical interventions such as spectacles and contact lenses reduce retinal
defocus and slow myopia progression (Wildsoet et al, 2019). Pharmacological therapies
such as low-dose atropine, have also been shown to slow myopia progression, although
the underlying mechanism is unclear (Wildsoet et al, 2019; Walline et al, 2020). There
are no good treatment options for myopic macular degeneration, although the treatment
of one of its major complications, myopic choroidal neovascularisation, has improved
with anti-vascular endothelial growth factor therapy (Cheung et al, 2017).
Reducing the growing societal burdens of uncorrected myopia will require complex strategies—ie,
combining prevention methods with enhanced capacity to deliver high quality, affordable,
and equitable refractive services (Ang et al, 2020). Investments will be substantial
but are likely to be outweighed by the cost of inaction.
Diabetic retinopathy
Diabetic retinopathy is the most common microvascular complication of diabetes (Wong
et al, 2016). The global prevalence of diabetes has tripled in the past 20 years.
In 2019, diabetes prevalence was estimated at 9·3% (95% CI 7·4–12·1) of the global
population aged 20–79 years, which is 463 million people, and is projected to reach
700 million by 2045 (Saeedi et al, 2019). The increase, mainly in type 2 diabetes,
is attributed to dietary and lifestyle changes related to urbanisation, population
growth, and increasing life expectancy (Saeedi et al, 2019; WHO, 2016). There are
large regional differences in age-standardised prevalence of diabetes, with the highest
in north Africa and the Middle East (12·2%, 8·3–16·1) and the lowest in sub-Saharan
Africa (4·7%, 3·2–8·1). The greatest number of people with diabetes are in China,
India, and the USA (Saeedi et al, 2019). In the next 25 years, sub-Saharan Africa
is projected to have the largest percentage increase in diabetes (appendix 1 p 33).
People with diabetes in LMICs are predominantly younger than 65 years and face a large
unmet need for diabetes treatment, leading to inadequate glycaemic control and subsequent
complications of diabetes (Manne-Goehler et al, 2019).
As the global prevalence of diabetes increases, the prevalence of vision loss from
diabetic retinopathy will also increase. Although the crude prevalence of other causes
of blindness decreased between 1990 and 2020, diabetic retinopathy-related blindness
increased by 68%, mainly in LMICs (Flaxman et al, 2017; Leasher et al, 2016). A meta-analysis
of population-based studies estimated that globally 34·6% (34·5–34·8) of people with
diabetes have some degree of diabetic retinopathy and 10·2% (10·1–10·3) have vision-threatening
diabetic retinopathy (Yau et al, 2012). Some findings show that the risk of developing
diabetic retinopathy varies between populations although these data are scarce (Yau
et al, 2012). Multiplying the estimated number of people with diabetes (Saeedi et
al, 2019) by the global diabetic retinopathy prevalence provides an estimate of the
magnitude of these conditions (Yau et al, 2012). In 2019, an estimated 160 million
people had some form of diabetic retinopathy, of whom 47 million had vision-threatening
diabetic retinopathy; by 2045 this number is projected to increase to 242 million
(for diabetic retinopathy) and 71 million (for vision-threatening diabetic retinopathy;
appendix 1 p 33).
In northern USA with good access to care, cumulative lifetime incidence of diabetic
retinopathy for a person with type 1 diabetes was estimated at 90% in 1984 and for
type 2 diabetes, approximately 50% (Klein et al, 1984 and 1984). The risk seems to
be decreasing over time, particularly in high-income countries, probably because of
improved risk factor control and advances in diagnostics over the past 30 years (Sabanayagam
et al, 2019 and 2016).
Several factors influence the risk of developing diabetic retinopathy. Glycaemic control
is a key factor, particularly in type 1 diabetes, and improved glycaemic control reduces
the incident risk of diabetic retinopathy, progression, and sight loss (Diabetes Control
and Complications Trial Research Group, 1993; UK Prospective Diabetes Study [UKPDS]
Group, 1998). Increasing duration of diabetes is another major determinant for diabetic
retinopathy, with incident risk rising to more than 75% in those living with diabetes
for more than 15 years (Klein et al, 1984 and 1984). Hypertension is the third risk
factor and might be more important in people with type 2 diabetes. Tight blood pressure
control is thought to prevent the development of diabetic retinopathy, although its
effect on diabetic retinopathy progression is less clear (UKPDS, 1998; Do et al, 2015).
There appears to be genetic variation in diabetic retinopathy susceptibility, particularly
among people with type 1 diabetes (Arar et al, 2008; Huang et al, 2011). Epigenetic
factors might also be important in the pathophysiology (Kowluru et al, 2015).
Early detection and timely treatment of vision-threatening diabetic retinopathy can
prevent 95% of blindness from this cause (Vujosevic et al, 2020). Strong links between
general medical services and eye care are needed to ensure effective well-coordinated
care. Treatment of vision-threatening diabetic retinopathy includes laser photocoagulation
for retinopathy and maculopathy and careful consideration of an intravitreal injection
with anti-vascular endothelial growth factor (Wong et al, 2018). Diabetic retinopathy
screening and treatment programmes are considered by WHO as other recommended effective
interventions in health care for non-communicable diseases (WHO, 2017). Low resources
in many low-income and middle-income countries, to implement screening programmes
and current cost-effectiveness ratios (outside the <$100 per disability-adjusted life-year
range), means that reducing costs and increasing efficiency (through targeted screening,
decreasing cost of treatment, and increasing completion rates) should be a high priority
(Poore et al, 2015; Burgess et al, 2013). Additionally, a high proportion of people
with diabetes are undiagnosed, with marked inequity seen within populations. In high-income
countries, populations from disadvantaged groups (eg, highly deprived, ethnic minorities,
and Indigenous people) are unable to equitably access services, leading to differential
outcomes (Denniston et al, 2019; Foreman et al, 2017). New technologies, including
teleophthalmology and artificial intelligence, offer potential new solutions (Vujosevic
et al, 2020).
Successful disease control programmes
Onchocerciasis control efforts
Onchocerciasis, also known as river blindness, is a neglected tropical disease resulting
in parasitic filarial infection caused by Onchocerca volvulus, which is transmitted
by the Simulium blackfly. After an infected blackfly bite, adult worms (macrofilariae)
develop in nodules under the skin. These worms release large numbers of microfilariae,
which disperse around the body. The Global Burden of Disease study (Disease and Injury
Incidence and Prevalence Collaborators, 2018) estimated that onchocerciasis infected
20·9 million people worldwide and caused vision loss in 1·15 million people from inflammatory
damage to the cornea, retina, and optic nerve. The Simulium blackfly requires fast-flowing
well-oxygenated water for its lifecycle, so larvicide treatment of fly breeding sites
can interrupt transmission. Ivermectin can reduce symptoms and break transmission
by killing microfilariae and stopping their release from adult female worms.
During the past five decades, four regionally focused control programmes have been
developed. The Onchocerciasis Control Programme between 1974 and 2002, was launched
by the World Bank, WHO, UNDP, and the Food and Agriculture Organization to control
onchocerciasis transmission by larvicide spraying of rivers in seven (later expanded
to 11) west African countries. The African Programme for Onchocerciasis Control between
1994 and 2015 was launched by the World Bank and WHO in 19 (other) African endemic
countries and to assist the original 11 countries, using community directed treatment
with ivermectin to control (and later eliminate) the disease. The Onchocerciasis Elimination
Programme for the Americas was launched by WHO in 1992 to eliminate transmission of
onchocerciasis in six endemic countries in central and south America using twice a
year distribution of ivermectin. The Expanded Special Project for the Elimination
of Neglected Tropical Diseases was established in 2016 by WHO Regional Office for
Africa, member states, and neglected tropical disease partners to mobilise political,
technical, and financial resources to accelerate the elimination of the five most
prevalent neglected tropical diseases.
These programmes led to several key achievements. Infection has been prevented or
treated and vision loss was prevented in more than 80 million people in 27 African
countries and six countries of the Americas. Transmission of O volvulus has been eliminated
in four of six endemic countries in the Americas and some areas in Africa. Programmes
have supported health system capacity building for control of neglected tropical diseases.
Arable land in Africa has been reclaimed for agriculture and economic development
(WHO, 2008).
A key component of success of the African programme was implementation research, which
identified that community-directed drug administration was an effective delivery strategy
for ivermectin. A further benefit was the provision of extensive capacity building
opportunities for African researchers, who are now global leaders in their field.
Lessons from onchocerciasis control
Economic impact research and advocacy led to the donation of ivermectin by Merck in
1988—“as much as is needed for as long as it is needed”. This donation was crucial
in creating an international public–private partnership to improve the health of affected
communities.
Regional programmes enabled efficient use of technical resources and cross-border
treatment of endemic communities.
The community-directed distribution of ivermectin increased coverage, while keeping
the cost of distribution low and improving coverage and sustainability.
The partnership between endemic communities, ministries of health, UN agencies, international
and local non-governmental organisations, agricultural agencies, and the pharmaceutical
industry has become a model for control of onchocerciasis and other neglected tropical
diseases.
Implementation research built into these programmes to address issues of disease transmission,
resistance, coverage, cost-effectiveness, adverse effects, and disability, has been
crucial to their successful implementation (WHO, 2008).
Eliminating trachoma as a public health problem
Trachoma is the leading infectious cause of blindness, recognised as a clinical entity
for many years, and responsible for vision impairment or blindness in 1·9 million
people (Bourne et al, 2013). The pathogen, Chlamydia trachomatis, was first isolated
in China in 1955 (Tang et al, 1957). The discovery that one oral dose of the antibiotic
azithromycin was effective against C trachomatis reinvigorated efforts to control
and eliminate the disease (Bailey et al, 1993). The WHO Alliance for the Global Elimination
of Trachoma by 2020 was established in 1996 (WHO, 1997). Elimination of blindness
from trachoma was included in VISION 2020 (WHO, 2000 and 2003). Since then, as a result
of a well-coordinated effort between health ministries, donors, and implementing partners,
the number of people at risk of blindness from trachoma has decreased by 91% from
an estimated 1·5 billion in 2002 to under 137 million in 2020, and the number of people
requiring surgery for trichiasis has decreased by 74% from 7·6 million in 2002 to
2 million in 2020 (WHO, 2020). Nine countries have been validated by WHO as having
eliminated trachoma as a public health problem (WHO, 2020). Many other disease communities
have monitored the trachoma community.
Four crucial factors might underlie success
First, normative guidance from WHO translated into preferred practices by the International
Coalition for Trachoma Control, based on the SAFE strategy (surgery for trichiasis,
antibiotic treatment, facial cleanliness, and environmental improvement).The SAFE
strategy was formally adopted by WHO member states in 1998 in the World Health Assembly
Resolution 51.11 (WHO, 1998). Conclusions and recommendations from the annual meeting
of the Alliance for the Global Elimination of Trachoma are translated into complementary
action plans by health ministries, academics, donors, and implementing partners.
Second, partnerships fostered within the Alliance for the Global Elimination of Trachoma
and International Coalition for Trachoma Control, supporting government-led implementation
of the SAFE strategy in endemic countries. Partners come together to strengthen national
capacity; to coordinate the efforts of governments with those of funders, implementing
partners, and researchers; and to mobilise resources from various donors to fill gaps
in the global programme (Courtright et al, 2018).
Third, committed donors and a data-driven medicine donation programme with a strong
country-led accountability framework. Pfizer's commitment to supply azithromycin for
trachoma elimination is coupled with robust stewardship of the donation by the International
Trachoma Initiative. Many other committed and motivated donors also support these
programmes.
Fourth, credible national plans to achieve elimination. Through trachoma action plans
and neglected tropical disease plans, health ministries have crafted ambitious but
attainable targets, facilitating the political decision making that underlies progress
in public health. Crucial decisions include commitments to scale up interventions,
standardise approaches, allocate domestic resources, and recruit new stakeholders.
Now, in the last mile of trachoma elimination, the trachoma community has built on
its strong foundations and strengthened global collaboration with four key enabling
factors.
(1)
A shared passion and ambition to target gaps and achieve a world free of trachoma.
(2)
Use of high-quality prevalence data generated by the Global Trachoma Mapping Project
and Tropical Data, coupled with rigorous research overseen by the WHO Network of Collaborating
Centres for Trachoma to underpin evidence for interventions and facilitate refinement
in programme delivery (Solomon et al, 2015 and 2018; WHO, 2017).
(3)
Innovation for continuous improvement and accelerating the global programme, including
new tools for active trachoma diagnosis and trichiasis surgeon training and practice
(Solomon et al, 2018; Gower et al, 2014; Merbs et al, 2012); open online courses for
programme managers (London School of Hygiene & Tropical Medicine, 2020); streamlining
of reporting for endemic countries through the Trachoma Elimination Monitoring Form
jointly managed by WHO and the International Trachoma Initiative; and transparent
updates about the progress of antibiotic shipments through the International Trachoma
Initiative azithromycin tracker.
(4)
Integration by pursuing mutually advantageous opportunities to engage with interdependent
sectors (water, sanitation, and hygiene, education, vision, and neglected tropical
diseases).
WHO noted in an analysis of progress towards trachoma elimination, the 2021–30 Neglected
Tropical Disease Roadmap, that key components (technical progress, strategy, service
delivery) were in place, with enabling factors producing amplification of collective
efforts (WHO, 2020). The essential actions required to achieve global elimination
of trachoma as a public health problem are: continued investment in implementation,
additional research to better understand transmission and how to limit transmission
in different settings, improvements in surgical quality, strengthening surveillance
capacity to monitor possible recrudescence, and ongoing advocacy for domestic financing
(Habtamu et al, 2016; Last et al, 2020). These actions for trachoma overlap substantially
with recommendations for the vision sector in the WHO World report on vision, reminding
communities that integrated people-centred eye care is a cornerstone to end trachoma.
Non-visually impairing ocular conditions
Population-based eye health surveys typically quantify vision impairment at an individual
level. Surveys usually do not report conditions that have the potential to cause vision
loss later in life, such as early glaucoma or diabetic retinopathy, or conditions
that typically do not cause vision impairment. Surveys report data for the better
seeing eye, overlooking individuals with monocular problems, which greatly underestimates
the magnitude of eye conditions and service needs.
Broadly there are three groups of people that need eye care services: the first group
are people with manifest or corrected vision impairment who need ongoing care, including
rehabilitative services; the second group are people with early stage disease or at
high risk of eye conditions that might cause vision impairment in later life, who
need ongoing care to prevent the disease or its progression; and the third group are
people with symptomatic conditions that typically do not cause vision impairment but
require services.
The first group is partly quantified in population-based surveys measuring vision
loss and summarised by the 2020 VLEG–GBD data.
1
There is also a large but poorly quantified group of people, mostly with corrected
refractive error or presbyopia, who need ongoing intermittent eye checks. Recording
uncorrected visual acuity, in addition to visual acuity, in future population-based
surveys will help to quantify this group.
2
Data on the younger age groups are particularly scarce.
For the second group, vision-impairment-based surveys and analyses underestimate common
diseases because they do not report conditions in people without impaired vision.136,
137, 138 Using population-based comprehensive survey data, it has been estimated that
76 million people are living with glaucoma worldwide in 2020.
136
However, the latest 2020 global estimates for blindness (3·61 million) and MSVI (4·13
million) attributed to glaucoma are substantially lower (appendix 1 pp 27–28). Although
these estimates are derived using different approaches, clearly, most people with
glaucoma are not included in GBD estimates because their central visual acuity is
preserved. Glaucoma constricts the visual field and even mild forms cause problems
with reading, walking, and increase the risk of falling. Most people living with glaucoma
have not been diagnosed and are not receiving treatment.
139
In 2020, 4·4 million people were estimated to be blind or have MSVI from diabetic
retinopathy (appendix 1 pp 27–28). However, this number is small compared with the
160 million people who have any diabetic retinopathy, or the estimated 463 million
people living with diabetes in 2019, all of whom require regular access to eye care
services to reduce long-term risk of vision loss (appendix 1 p 33).138, 140 People
with vision impairment represent only a small proportion of all people who need these
services. The second group also includes high-risk populations that require screening
services for early disease detection. For example, premature infants at risk of retinopathy
or older (≥40 years) African Americans, at risk of glaucoma.
The third group includes conditions that rarely affect vision, such as conjunctivitis
and dry eyes. Existing data suggest that the number of people affected are considerable.
For example, a large UK database
141
of 3 million people showed that ocular problems without vision impairment account
for 88·1% of all general practitioner consultations related to eye health and 68·9%
of referrals. Data from secondary eye units, which are part of the Aravind Eye Care
System in India, show a similar pattern; only 41% had visual acuity of worse than
6/12 in the worse eye and 28% in the better eye (appendix 1 p 35). Similarly, data
from a secondary eye unit in Kenya found that less than half of presentations were
for conditions associated with vision impairment.
6
The implications of these findings are important and require action. There is a need
for standard terminology and robust definitions to measure the magnitude of eye disease
that does not impair vision; data need to be collected and analysed to assess this
magnitude; the impact of non-visually impairing eye disease on the quality of life
and its economic consequences need to be assessed; and the full magnitude and impact
of all eye disease needs to inform health-care planning to serve the population and
improve eye health.
Quantifying the magnitude of eye disease
Population-based surveys provide estimates of disease prevalence, service coverage,
and outcomes. These data are needed to support service planning, resourcing, and monitoring,
and can be aggregated to provide regional or global estimates.1, 127, 128, 131, 142
Broadly, there are two approaches to eye health surveys, comprehensive and rapid (appendix
1 pp 36–37). Comprehensive eye health surveys typically include an in-depth ophthalmic
examination with imaging for independent retinal grading and data on risk factors.
Several rapid assessment methods are available.
143
The most used method is the Rapid Assessment of Avoidable Blindness (RAAB), for people
aged 50 years and older. The most applicable approach balances the required epidemiological
detail and the available resources.
Developing reliable estimates of eye disease depends on good quality survey data.
This Commission has analysed the distribution of surveys since 2000 (appendix 1 pp
38–42). Most were RAAB surveys. Some regions have scarce or old data (eg, western
and central sub-Saharan Africa, central Asia, central Europe, North America; figure
11). Where there are few data for a region, modelling approaches are sometimes used
to fill in the gaps.
Figure 11
Most recent population-based eye health surveys globally
All surveys (rapid and comprehensive, national or subnational) done since 2000. Not
applicable indicates that no surveys were done. Data from VLEG–GBD,
1
and the Rapid Assessment of Avoidable Blindness Repository.
Heatmap of the world, showing the countries with the least to the most recent population-based
eye health surveys. Countries are coloured differently depending on how recently the
last survey was done. Some countries have done no such surveys.
Rapid and comprehensive techniques have predominantly reported presenting distance
visual acuity (ie, with available correction). However, following the WHO World report
on vision, future eye health surveys are strongly encouraged to measure uncorrected
visual acuity as well, and acknowledge met and unmet need for refractive services
in addition to presenting vision impairment prevalence.
2
With new focus on effective refractive error coverage as a core indicator, accurate
diagnosis of refractive error needs to be ensured. The accuracy of pinhole correction
to identify uncorrected refractive error (a common survey approach), might be variable
as opposed to subjective refraction, on account of the quality, the type of pinhole
occluder used, or other pathology.
144
Standardisation of procedures and equipment is required.
Reporting eye health surveys
The World report on vision by WHO
2
highlighted the need for greater methodological and reporting standardisation of eye
health surveys. Although generic tools such as the Strengthening The Reporting of
Observational Studies in Epidemiology (STROBE) checklist and the risk of bias assessment
exist, none are specific to eye health surveys,
145
which is a missed opportunity to promote robust study design, reduce risk of bias,
and emphasise complete reporting. In response, we did a two-round Delphi survey to
identify key methodological issues and develop a checklist to improve the design,
conduct, and reporting of vision impairment surveys, including minimising bias (appendix
1 p 43). Generic STROBE checklist items were endorsed as essential for high quality
reporting in comprehensive and rapid surveys. We identified several STROBE items that
were frequently poorly reported, several vision-specific extensions, and a need for
better guidance to enhance the standardisation and quality of future eye health surveys
(panel 3).
Panel 3
Key recommendations for improving population-based vision impairment surveys
Improving survey design and conduct
•
Standardise equipment, participant recruitment strategy, and team training
•
Measure vision at a constant distance using a vision chart with high contrast, crowded,
standardised optotypes
•
Assess quality assurance (survey staff accuracy of measuring vision) using Bland-Altman
Limits of Agreement to test visual acuity or kappa, allowing to compare vision impairment
categories
•
Address declining response rates globally by updating sample size calculations, sampling,
and analytical approaches (eg, weighting by cluster non-response)
•
Incorporate standard socioeconomic position indices (eg, Equity Tool) and other known
associated demographic or equity factors (eg, disability, distance from services)
Improving completeness of reporting
Improve application of Strengthening The Reporting of Observational Studies in Epidemiology
(STROBE) items
•
Item 6 (participant recruitment): report participant recruitment strategy in full
•
Item 12 and 16 (statistical methods): analyse and report crude and adjusted prevalence
estimates with measures of uncertainty (eg, 95% CI), to account for the sampling design
•
Item 13 (results): report the number of units (eg, villages, households, people) sampled
at each stage (assessed for eligibility, recruited, examined) with numbers of not
contactable participants and reasons for non-participation
•
Item 14 (results): report missing data for each variable of interest
Extensions of STROBE items for vision impairment surveys
•
Items 7 and 11 (variables): define and report vision categories and unit of analysis
(eg, best eye or binocular), eye disease case definitions, avoidable vision loss,
and any risk exposures of interest
•
Item 8 (details of measurement): for vision testing, report chart type (scale, optotype),
approach to maintaining constant test distance, location of testing, and whether the
examination protocol differed for different subgroups (eg, children or adults with
cognitive impairment); if collecting clinical images, report details of reading centre
personnel, training and grading or agreement criteria
Major risks of bias to minimise and report
•
Wrong sample size bias—sample too small to yield precise prevalence estimates or too
large and resource inefficient—eg, if expected prevalence of blindness is lower than
sample prevalence
•
Selection bias—the sampled population not accurately representing the target population,
resulting in erroneous inferences about the population's magnitude of vision impairment—eg,
if the random sampling and enumeration procedures are not rigorously observed, a convenience
sample might be recruited, yielding an apparently good response rate, who differ in
important but unmeasurable ways from the true target population
•
Non-responder bias—non-responders might differ substantially from responders—eg, older
people (in whom vision impairment is more prevalent) or people not working on account
of vision impairment, are more likely to be available for examination than younger
employed people
•
Diagnostic purity bias—narrow case definitions—eg, exclusion of ocular comorbidities
might lead to misleading cause attribution, a tendency to over-report causes most
easily identified from simple examination protocols and to underreport posterior segment
disease
•
Missing clinical data bias—missing data might differentially impact reliability of
results in different subgroups—eg, likelihood of agreeing to pupil dilation might
vary between different clinical subgroups, affecting the ability to collect data
Disability weights for vision impairment
How important are blindness and vision loss to an individual, compared with other
health morbidities? Disability weights (where 0 equals a state of full health and
1 equals death) and disability-adjusted life-years (DALYs) provide an answer. Nine
studies (appendix 1 p 44), published between 1994 and 2015, used various approaches
to estimate the disability weight associated with blindness, which ranged widely from
0·600 (in 1994) to 0·173 (in 2015).
There are multiple explanations for this variation.
146
First, the construct being measured shifted over time from loss of wellbeing (disability)
to loss of health. Second, studies described the impact on health states differently.
147
Third, studies framed their questions differently. Fourth, some studies used expert
panels exclusively from high-income countries, while others sought responses from
large samples of the general public internationally. There are likely to be considerable
regional differences in the impact of vision loss on quality of life. Finally, studies
used different valuation methods, which included person trade-off, paired comparison,
population health equivalence, and the visual analogue scale.
The GBD 2010 study disability weights sparked a lively debate.148, 149 By reporting
a blindness disability weight reduction from 0·600 to 0·195, the apparent global importance
of cataracts fell substantially.150, 151 WHO subsequently incorporated health state
data to calculate another blindness disability weight of 0·338.
152
In view of the wide range and major implications that this figure has on how vision
loss is valued, further empirical research is urgently needed to understand societal
valuations of vision impairment and reach a broad, evidence-based consensus of weights
that should be applied, possibly allowing for the use of different weights in different
settings.
146
Section 4: The economics of vision
As a society, what value do we place on vision? How much are we willing to invest,
relative to the other demands on finite health resources, to ensure that people can
access services? These questions are especially complex in 2021 as the world continues
to battle the COVID-19 pandemic. In response, this Commission did a systematic literature
review of the economic costs of vision impairment and its major causes to identify
and summarise what is currently known. Using studies identified in this review, we
then determined a new estimate for global and regional productivity losses from vision
impairment, and summarised studies reporting cost-effectiveness ratios of cataract
surgery and refractive error correction.
Systematic review of eye health economics
We searched the literature from Jan 1, 2000, to Dec 31, 2019, for partial economic
studies (eg, cost of illness and economic burden of disease) and full economic studies
(eg, cost-effectiveness and cost-benefit) reporting the economic cost of vision impairment
or the cost of evaluating interventions for seven leading causes: cataract, refractive
error, glaucoma, diabetic retinopathy, age-related macular degeneration, corneal opacity,
and trachoma (appendix 1 pp 45–49).
153
We excluded studies reporting only incremental costs, benefits, or cost-effectiveness
ratios.
In total, 138 publications met these criteria, with scarce information about many
regions and conditions. The geographical distribution and focus of each publication
are shown in appendix 1 (p 48). We identified fourteen studies that reported global
estimates related to eye health economics. Most (72%) regional estimates were from
high-income countries. Study types were heterogeneous (appendix 1 p 49). The main
economic study perspectives of vision impairment were societal (35%), health system
(18%), or third-party payer (17%). Most studies (90%) used a prevalence-based approach
for estimation.
Economic literature on eye health has multiple limitations and great uncertainty.
First, many studies were not comprehensive in approach; most (70%) considered only
one cost category (direct health-care costs, direct non-health-care costs, productivity
loss, informal care, or intangible costs). Heterogeneity limits comparability and
the few cost items included in many studies probably underestimate the full cost of
treatment and rehabilitation. Second, vision impairment severity or disease stage
are not standardised. Third, studies tended to be small and unrepresentative. Fourth,
productivity loss estimates were limited in scope and generally made major, largely
unsupported assumptions about the productivity and proportion of people with vision
impairment who work. Finally, few studies did sensitivity analysis or addressed uncertainty.
These limitations mean that previous estimates might have substantially underestimated
or overestimated the economic impact of vision impairment, which limits the usefulness
of cost-of-illness estimates and possibly led to flawed policy prioritisation decisions.
Global productivity losses from vision impairment
We have already explored the limitations that vision impairment can place on an individual's
ability to engage in the workplace, ensuing loss of productivity and income. Addressing
avoidable vision impairment and enabling people with permanent impairment to access
and function well in the workplace, increases productivity. For example, a trial
29
in India found that provision of near vision spectacles resulted in significantly
increased productivity of people with presbyopia in harvesting tea (appendix 2 p 4).
29
Our systematic review identified 37 articles on productivity loss (appendix 1 p 49).
Studies reported different combinations of components (absenteeism, presenteeism,
wage reduction, reduction in employment, and premature mortality), although reduction
in employment was the most frequently reported component. Assumptions around reduced
employment attributable to vision impairment were variable, predominantly based on
scarce data and diverse methods. Most studies focused on a single condition or a few
regions. There are only three previous global productivity loss estimates for vision
impairment and blindness, and they are compared in appendix 1 (p 50).154, 155, 156
This Commission has established a new estimate for global and regional productivity
losses from unaddressed vision impairment (appendix 1 pp 51–53). We systematically
searched for employment gap data for people with vision impairment, identifying 11
reports, with limited geographical distribution (appendix 1 p 52). Productivity loss
calculations included the number of people with blindness or MSVI of working-age (15–64
years) in 2020, national employment rates for 2018, per-capita gross domestic product
for 2018, and employment gap data published between 2004 and 2018. Values are presented
for 2018 in US$, adjusted for purchasing power parity.
In 2020, it was estimated that globally, 18·1 million (95% UI 14·4–22·6) people are
blind and 142·6 million (112·5–179·6) are living with MSVI in the working-age group.
The overall relative reduction in employment of people with blindness or MSVI was
estimated to be 30·2%. We estimated that the global annual productivity loss was $410·7
billion (95% uncertainty interval $322·1–518·7 billion), which represents 0·3% of
the gross domestic product of the 21 GBD regions in 2018. Potential productivity losses
were estimated at $43·6 billion, ($34·4–54·5 billion) attributable to blindness, and
$367·1 billion ($287·7–464·2 billion) attributable to MSVI. Figure 12 shows the productivity
losses for each GBD region. Productivity losses were highest in east Asia ($90·4 billion,
$70·5–115·3 billion). Productivity losses as a proportion of gross domestic product
was highest in south Asia (0·6%).
Figure 12
Productivity losses resulting from vision impairment
Estimates made for 2020 using the number of people who were blind or had moderate
and severe vision impairment, an employment gap of 30·2%, 2018 employment rates, and
gross domestic product for (A) productivity loss, and (B) as a percentage of gross
domestic product.
Graphs illustrating productivity losses resulting from vision impairment. Productivity
loss in terms of billions of 2018 US$ purchasing power parity is greatest for East
Asia and least for Oceania. Productivity loss in terms of percentage of gross domestic
product is greatest for South Asia and least for Western Europe.
Our new analysis provides a robust estimate of the global annual productivity loss
attributable to vision impairment. For the first time to our knowledge, regional VLEG–GBD
estimates were used to estimate the number of people with vision impairment in the
working-age group and regional employment reduction variables derived from a literature
review. However, additional productivity loss components were not included in our
analysis because reliable data at country and regional level remain scarce. The components
that were not included are absenteeism and presenteeism (reduced productivity in the
working place), premature mortality, people older than 64 years, productivity losses
of caregivers, and value of time lost from unpaid or informal labour activities. Data
do not sufficiently differentiate between reduction in employment for blindness and
MSVI. Therefore, we only included components for which sufficient evidence was available,
and consequently the magnitude of productivity loss could have been underestimated.
Overall, this analysis indicates that blindness and MSVI have substantial economic
impact worldwide and highlights the opportunity to unlock human potential by addressing
avoidable vision impairment and providing rehabilitation services to enable people
to work.
Cost-effectiveness of eye health interventions
As an adjunct to the systematic review, we examined cost-effectiveness ratios of eye
health services and interventions (appendix 1 pp 54–57). We identified 182 reports
for 16 ophthalmic conditions. The most frequently studied interventions addressed
age-related macular degeneration,
53
glaucoma,
32
cataract,
29
and diabetic retinopathy.
27
We focused on cataract and uncorrected refractive error interventions and only included
studies reporting health benefits using DALYs or quality-adjusted life-years (QALYs).
Costs were adjusted to 2018 values expressed in US$ purchasing power parity.
For cataract, we identified 11 publications providing 58 separate national or regional
cost-effectiveness ratio estimates.37, 157, 158, 159, 160, 161, 162, 163, 164, 165
The average cost-effectiveness ratios are shown in figure 13. The studies are heterogeneous
in perspective, costs included, surgical procedure, and assumed duration of the health
benefit, which limited our comparison. The cost-effectiveness ratio ranged from $5
per QALY gained in India to $24 783 per QALY gained in the UK. However, most ratios
were less than $1000 per DALY averted or QALY gained, and in 19 (33%) countries the
cost-effectiveness ratio was less than $100 per DALY averted or QALY gained. In general,
LMICs reported more favourable cost-effectiveness ratios for cataract surgery than
did high-income countries. Two studies from India
158
and Nepal
160
showed that the cost-effectiveness ratio of a manual small-incision cataract surgery
ranged from $5 to $95 per QALY gained and phacoemulsification surgery ranged from
$47 to $142 per QALY gained. The highest estimate, from the UK, used a wider perspective,
including personal social-care costs.
163
The higher cost-effectiveness ratios in some studies, mostly from high-income countries,
might be partly because of a higher proportion of mild vision impairment in those
receiving surgery and possibly higher remuneration to eye care professionals in high-income
countries than in LMICs.
Figure 13
Cost-effectiveness ratios for cataract surgery
Studies reporting either DALYs averted or QALYs gained. Costs have been inflated to
2018 levels and converted to US$ purchasing power parity. Studies which provide only
a single estimate are plotted as a diamond. For studies reporting more than one estimation
the highest and lowest values are plotted as a range (appendix 1 pp 56–57). Letters
shown next to some regions are related to the WHO regional coding labels. References
for this figure can be found in appendix 1 (p 101). DALYs=disability-adjusted life-years.
ECCE=extracapsular cataract surgery. QALYs=quality-adjusted life-years. SICS=small-incision
cataract surgery.
Graph visualising cost of cataract surgery per disability-adjusted life year averted
or quality-adjusted life year gained, as estimated from 11 studies that calculated
national or regional cost-effectiveness ratio estimates.
There were two studies on screening and treatment of uncorrected refractive error
in schoolchildren, providing 16 separate national or regional cost-effectiveness ratio
estimates (WHO subregions), and an additional cost-effectiveness ratio analysis for
a facility-based refractive error service in Zambia.165, 166, 167 The average cost-effectiveness
ratios, shown in figure 14, ranged from $95–184 per DALY averted in southeast Asia
D, to $987–2127 per DALY averted in Western Pacific A. The most cost-effective strategy
($95 per DALY averted) in all 14 regions involved screening children in the age group
11–15 years.
166
The cost-effectiveness ratio exceeded $1000 in only three regions: Europe A, West
Pacific A, and rural India. Reports in India showed that cost-effectiveness ratios
for screening and treating schoolchildren were lower in urban areas ($264) than rural
areas ($1448).
167
Both studies concluded that screening and treating schoolchildren for uncorrected
refractive error seems to be economically attractive in many settings and world regions.
Figure 14
Cost-effectiveness ratios for refractive error services
Cost-effectiveness of screening and treating refractive error in schoolchildren166,
167 and for facility-based refractive error services for all ages.
165
Studies reported either DALYs averted or QALYs gained. Costs have been inflated to
2018 levels and converted to US$ purchasing power parity. For studies reporting more
than one estimation, the highest and lowest values are plotted as a range (appendix
1 p 57). References for this figure can be found in appendix 1 (p 101).
Graph visualising cost of refractive error services per disability-adjusted life year
averted or quality-adjusted life year gained, as estimated from two studies that calculated
national or regional cost-effectiveness ratio estimates.
The wide range of cost-effectiveness ratios suggest regional variations in resource
use, costs, and patient characteristics, and heterogeneous study methods such as the
cost component, measurement of health benefits, duration of health benefits, and use
of different discount rates. This heterogeneity is common in health economics, but
limits comparability. The low costs per QALY gained or DALY averted indicate that
cataract surgery and refractive services are cost-effective in many settings, encouraging
countries to prioritise eye care services. Cataract surgery seems favourable compared
with other essential surgical procedures and non-surgical public health interventions
in LMICs.168, 169 However, cost-effectiveness ratios are only one consideration when
making resource allocation decisions; others include the locally relevant cost-effectiveness
ratio threshold, budget, feasibility, and other specific context factors.
170
Strengthening research on eye health economics
Our systematic review and analyses highlighted marked methodological heterogeneity,
limitations, and data gaps in eye health economics literature. To address these several
actions are needed.
First, standardised methodological approaches and reporting need to be adopted, following
international guidelines for health economic evaluations.171, 172, 173 This improvement
would increase reliability and enable the comparison of findings between settings
and over time. This Commission calls for an international consensus on the process
to develop guidance for eye health economic studies and standardise approaches for
core components and analyses, particularly for the cost of illness.
Second, more standardised data need to be collected from diverse settings and repeated
over time. Our review revealed that data are particularly scarce from LMICs, a gap
that needs to be urgently addressed to better inform policy and planning decisions.
This step will require financial investment and development of capacity for local
data collection and analysis. Opportunities to integrate data collection into routine
health system data processes should be investigated. Few long-term studies have revisited
estimates over time; these would be invaluable to monitor trends and the impact of
interventions.
Third, robust, comprehensive economic impact analyses should be developed to better
understand the true impact of vision impairment. Our productivity loss analysis provides
only a partial perspective and is limited by the availability of data. A systematic
approach in a representative set of countries is needed to collect data to inform
more comprehensive models. For example, to improve the estimation of productivity
losses, more data are needed in relation to vision impairment and its impact on employment
status, wages, absenteeism, and presenteeism.
Fourth, better analyses are needed on cost-effectiveness, budgetary impact, and feasibility
in a broader range of settings to better inform national decision making. Cost and
cost-effectiveness analyses evaluating alternative service delivery approaches should
be done—eg, moving to greater primary-care-based and community-based delivery platforms,
integration with other services, and task sharing. Extended cost-effectiveness analyses
that would include health system objectives, such as improved financial protection
and equity to inform policy and planning decisions, are needed.
Section 5: Global eye health research
Research is crucial to advancing global eye health; specifically, to understand population
eye health needs, identify effective interventions, optimise delivery, and support
effective advocacy. This Commission analysed vision and eye health research done in
the past 20 years. We investigated the diversity of the research community and explored
issues around equitable partnerships and growing capacity. Finally, we did a study
(unpublished) to collectively identify the grand challenges in global eye health,
highlighting key issues that would benefit from focused research. We outline crucial
actions necessary to advance research and to improve eye care delivery within universal
health coverage.
20 years of eye health research
To investigate how research relates to the distribution and causes of vision impairment,
we examined all primary peer-reviewed research on eye health published between 2000
and 2019 using a systematic search of online databases and a semi-automated bibliometric
analysis (appendix 1 p 58). After excluding editorials, comments, reviews, and case
reports, 156 954 articles were analysed. There was a 50% increase in research output
across two decades (62 868 publications for 2000–09 vs 94 086 for 2010–19). Only 4%
of publications were trials. One notable finding was the three-times increase in the
number of publications from China (3602 vs 10 594). Almost half (42%) of publications
were on one of the five leading conditions, glaucoma being the most frequent (11·0%),
followed by cataract (9·3%), and refractive error (8·8%; appendix 1 p 59). Overall,
these findings appear in line with the need for research to focus on leading causes
of vision impairment.
However, there is substantial maldistribution in the geographic focus of eye health
research (figure 15). Almost three-quarters of published reports are from high-income
countries. Several regions such as southeast Asia, Latin America and the Caribbean,
and sub-Saharan Africa, had particularly low research output per person. We anticipate
high-income countries will continue to produce a large proportion of basic science,
therapeutic, and translational research, although this distribution is changing with
the emergence of India and China as major pharmaceutical centres. It is important
that all regions have a solid local evidence base on the epidemiology of eye disease
and an equally strong understanding of which treatments and service delivery approaches
are most effective in their settings. A major gap is the lack of research that explores
solutions to eye health problems, particularly in LMICs, where decision makers do
not have sufficient and contextually relevant evidence. This gap was highlighted in
two systematic reviews.174, 175 For the first review, of interventions that aimed
to increase attendance at diabetic retinopathy screening, 66 randomised controlled
trials were identified, none of which were done in LMICs.
174
The second review of interventions to improve access to cataract services in LMICs
identified only two studies.
175
Figure 15
Global distribution of research
Number of primary research studies on vision and eye health, by country, done between
2000 and 2019 (studies identified by “explode eye disease” on MEDLINE, July 10, 2020;
n=156 954; appendix 1 pp 58–59).
Heatmap of the world showing the number of primary research studies on vision and
eye health, by country, between 2000 and 2019. Countries are coloured differently
depending on the number of studies carried out.
Given the magnitude of vision impairment in sub-Saharan Africa, we did an in-depth
review of randomised controlled trials done in this region since 2000 (appendix 1
pp 60–61). There were four key findings. First, geographic spread of the 86 trials
was limited; 16 countries had at least one trial and more than half were done in Nigeria,
South Africa, Ghana, or Ethiopia (appendix 1 p 61). Second, trachoma (28 trials) and
onchocerciasis (17 trials) were most the commonly assessed. High-quality trials have
been crucial for shaping disease control and programme success. Third, trachoma and
onchocerciasis research communities are well coordinated in identifying key questions
and minimising unnecessary duplication; they engage in extensive collaboration with
government-led programmes on neglected tropical disease and their funders recognise
that research is needed to develop elimination strategies. Finally, 16 trials were
about glaucoma. Given that glaucoma has a high prevalence in many African populations
and the uncertainty around how to address this issue, we believe that concerted research
action is urgently needed to develop contextually relevant management strategies for
glaucoma.
Equity, diversity, and inclusion in eye health research
Inequality is pervasive in medical science; eye health research is no exception.
176
Equity and diversity in research teams produces higher quality science that better
meets the needs of society. This Commission explored equity, diversity, and inclusion
in eye health research in three ways.
First, we assessed female authorship in eye health research since the beginning of
2000 to the end of 2019 (appendix 1 p 58). There were almost 880 000 authorships;
gender could be assigned to 780 000. Around 33% were female across the whole timespan.
Since 2000, female authorship increased from 28% to 37%. Women held 36% of first authorships
and 24% of last authorships.
Second, we assessed diversity of 112 ophthalmology journal editorial boards listed
in Scopus (appendix 1 p 62). Gender and country of affiliation were available for
5061 editorships. Women held 23% of editorships and 11% editor-in-chief positions.
72 countries had at least one editor; 1643 (32%) of 5061 editorships were held by
researchers in the USA (25% women), compared with only 15 (0·2%) across all of sub-Saharan
Africa (20% women). Among 47 countries with at least five editorships, the proportion
of editorships held by women within each country ranged from 0% to 60% (median 22%).
Third, we assessed authorship of 89 reports from 86 randomised controlled trials in
sub-Saharan Africa to evaluate the extent to which researchers from the continent
itself and female researchers were involved. All but one of the 89 reports included
authors who originated from the country of the study. Researchers from the country
of the study held 51% of all authorships, 74% of first authorships, and 43% of last
authorships. However, female researchers from the country of the study held only 8%
of all authorships, 12% of first authorships, and 8% of last authorships.
Change is required to improve equity, diversity, and inclusion for women, and other
under-represented groups. Strategies for organisational change have been outlined
and the need for measurable targets has been reinforced.
177
The Lancet has shown how editors and publishers can address gender gaps and set diversity
targets, leading to increased inclusion of women and people from LMICs among its authors
and reviewers.
178
We commend this pledge, and in preparing this Commission we aimed for balance in gender
and LMIC representation. Despite our efforts, the proportion of commissioners who
are women (44%) or originate from LMIC (38%) falls short of parity. Among our subsidiary
papers, more than 50% of authors were female (more than two-thirds held first authorship).
Increasing capacity for eye health research
Delivery of eye health within universal health coverage requires substantial expansion
in capacity to deliver high-quality research in LMICs. We call for investment in institutions
in LMICs so that eye health research is primarily executed by researchers living and
working in the region. The analysis of randomised controlled trials in sub-Saharan
Africa highlights that most research in this region appears to have substantial academic
involvement from high-income countries. A structural shift is required so that LMIC
institutions increasingly take the lead and are supported by equitable partnerships
that address priorities identified within the region. Such partnerships need to maximise
meaningful capacity building for local researchers. Previously, some externally driven
research projects have failed to sufficiently consider this issue, with local eye
health personnel limited to data collection roles as opposed to scientific design
and leadership. Subsequently, personnel might be included as authors without being
empowered to engage in a meaningful way that develops their research skills. Some
lessons can be drawn from the Commonwealth Eye Health Consortium, which built eye
health research capacity in LMICs (particularly in sub-Saharan Africa) by providing
Masters degrees, doctoral scholarships, and postdoctoral fellowships, with a focus
on mentoring and empowering independent researchers. More regionally focused peer-reviewed
journals are needed. Some regions might need capacity development support for longer.
Increasingly this involves South-South collaboration, with the development of research
community networks. This improvement is important considering that there are few,
widely dispersed eye health researchers. Funding arrangements are very important for
equitable partnerships, with a need for LMIC institutions to take the lead role in
obtaining and managing funding.
Grand challenges in global eye health
Global eye health research needs to focus resources on key questions to maximise benefit.
Previous research prioritisation processes were done in the UK, the USA, and for LMICs;
these included expert panels with or without open calls for contributions from clinicians
and the public, including people who live with vision loss.179, 180 To collectively
identify and focus on key areas that need attention in the upcoming decade, this Commission
did a global prioritisation exercise. We drew on the Grand Challenges method, which
involves a three-round modified Delphi process (appendix 1 p 63).
181
We recruited 336 people from 118 countries, working in clinical practice, eye health
system management, research and policymaking, and people who live with vision and
eye health problems. In round one, participants were asked the question “What are
the grand challenges in global eye health?” and could nominate up to five challenges
and five corresponding solutions. All 3400 responses were thematically analysed and
consolidated into 85 unique challenges. Ranking was done across two rounds to arrive
at 16 priority challenges (panel 4).
Panel 4
Prioritised Grand Challenges in global eye health
Improve treatment (condition-specific)
•
Develop models to encourage population demand and ensure access to accurate refraction
and affordable, good quality spectacles.
•
Identify and implement strategies to improve the quality, productivity, equity, and
access of cataract services.
•
Improve child eye health by integrating evidenced-based primary eye care services
for children into general health services and ensure strong connections to secondary
eye care services. Develop and implement sustainable school eye health programmes,
including screening and management for refractive error or amblyopia, which are well
integrated within education services.
•
Develop and implement effective, accessible, and inexpensive pathway approaches for
screening, diagnosing, monitoring, and managing glaucoma.
•
Develop and implement one-stop services for people with diabetes by integrating diabetic
retinopathy screening services with general diabetes care and develop robust systems
to ensure ongoing follow-up and referral for assessment and treatment.
•
Develop and implement evidenced-based, effective, sustainable, and context-relevant
screening and early detection strategies for eye conditions.
Health system
•
Encourage governments to prioritise integrated people-centred eye care services for
universal health coverage.
•
Develop and implement evidence-based strategies for the effective integration of eye
health services between the primary, secondary, and tertiary level to improve referral
pathways, ensuring recognition of those who need secondary care and a timely, reliable,
accessible, and affordable care mechanism.
•
Develop and implement evidence-based strategies for the effective integration of eye
care at the primary care level and with other medical services (eg, child health,
diabetes or other NCD services), ensuring that services are widely accessible, affordable,
of high quality, and meet the primary eye care needs of the population.
•
Strengthen the information system for eye health within health facilities, integrating
them into national systems.
•
Ensure financing for eye health exists within national budgets and financing structures
and increase the investment.
Access and equity
•
Develop and implement services that prioritise, and by design, reach marginalised
or vulnerable groups (women, poor communities, Indigenous people, ethnic minorities,
people with disabilities, people in residential care, prisoners, and refugee camps)
and people living in rural communities with quality affordable eye services.
•
Develop and implement strategies that reduce out-of-pocket costs for those requiring
eye care who are unable to afford full-cost services—eg, subsidy, tiered pricing,
or insurance.
•
Develop and implement responsive programmes to increase the access to and use of eye
health services and treatment—eg, reduce barriers to accessing services and increase
demand through greater awareness of need and confidence in health-care provision.
Build resource capacity
•
Increase support from international bodies, professional bodies, colleges, and non-governmental
organisations, for geographical regions with severe eye health resource shortages.
•
Strengthen leadership and public health expertise across all levels of eye care and
ensure that national leadership can influence policy and resource allocation. Additionally,
strengthen regional and national professional bodies for eye health practitioners.
Six of the 16 challenges focused on improving specific services and treatment for
cataract, refractive error, glaucoma, diabetic retinopathy, and children's eye diseases.
The available evidence for each condition warrant different research approaches. For
example, cataract and refractive error can be treated by well-established and efficacious
interventions, but these do not reach all who could benefit with sufficient quality
to be effective. Implementation research is needed to fill this gap; there are few
examples, perhaps the most well known is onchocerciasis, for which implementation
research was done to determine the best way to distribute ivermectin. Optimal treatment
and implementation approaches also need to be determined, in different populations,
for glaucoma and diabetic retinopathy to improve acceptance and sustained uptake of
lifelong care (panel 5).
Panel 5
The challenge of glaucoma
Glaucoma is the second leading cause of blindness (age-standardised prevalence), which
results in substantial disability before blindness, yet remains undertreated globally
(Bourne et al, 2020). In most prevalence surveys from high-income countries, less
than half of all detected glaucoma was previously diagnosed, and in low-income and
middle-income countries (LMICs) over 90% of people with glaucoma are not in care (Tham
et al, 2014; Vijaya et al, 2008; Kyari et al, 2015). This high percentage is because
glaucoma is mostly asymptomatic until relatively late in the disease. As many as 35%
of people are blind at diagnosis in LMICs, precluding effective interventions that
would have prevented vision loss (Ramakrishnan et al, 2003; Buhrmann et al, 2000;
Kyari et al, 2013; Abdull et al, 2015). Glaucoma lacks a one-stop solution such as
cataract surgery, because of its chronic nature and complexity of management. In the
absence of simple and affordable diagnostic and treatment solutions, the global eye
health community has not prioritised glaucoma—eg, when VISION 2020 was being developed
(WHO, 2000). There are several crucial issues.
First, there is a need to provide effective treatments that prevent glaucoma progression,
and maybe someday, restore function to those with glaucoma damage. Several high-quality
clinical trials have shown that lowering intraocular pressure slows, and in some cases
stops, glaucoma progression (Garway-Heath et al, 2015; Collaborative Normal-Tension
Glaucoma Study Group, 1998; Heijl et al, 2002). To do this intervention safely and
effectively remains a challenge in all resource settings. The current treatment is
long-term topical ocular hypotensive drops, but poor compliance and ongoing costs
are major challenges in LMICs (Newman-Casey et al, 2020). Laser trabeculoplasty, which
can be administered in a single session, is one effective strategy that has shown
effectiveness in locations with scarce resources (Gazzard et al, 2019). Unfortunately,
trabeculoplasty rarely provides lifetime control of intraocular pressure. Future hope
is that more effective surgical or laser approaches will provide safe and sustained
pressure lowering. Many novel approaches have been developed in the past decade, but
none are able to overcome these challenges (Poitras et al, 2019).
Second, individuals need to be monitored to determine whether their glaucoma is progressing
so that treatment can be changed or escalated when needed. Such monitoring presents
challenges for more remote and resource-limited populations. However, glaucoma monitoring
is undergoing a rapid evolution and home-based monitoring using off-the-shelf technology
might become available in the near future (Che Hamzah et al, 2020). The growth of
vision centres in India and elsewhere, staffed by mid-level ophthalmic personnel and
supported remotely by ophthalmologists, is an example of how to provide ongoing monitoring
and shared care for people living in remote settings.
Third, affordable and effective screening approaches are needed to enable identification
of individuals at risk of sight loss. Major advances in automated grading of optic
disc photographs has led to highly accurate glaucoma diagnosis on the basis of a single
photo (Li et al, 2018). Widespread use of screening using fundus imaging with artificial
intelligence-assisted grading could allow glaucoma to be diagnosed alongside the other
major causes of blindness at low cost. Implementation studies are needed to determine
how and where to apply these new tools.
Innovation in glaucoma detection and management, which will probably occur soon given
the rapidly improving technology, could catalyse a new care model in which earlier
detection and effective long-term intraocular pressure lowering combined with remote
monitoring can prevent unnecessary blindness globally. To reach this goal, the global
eye care community needs to include glaucoma in eye care planning, recognising the
centrality of the patient as a partner in management. Many important research questions
remain unresolved and require substantial investment and a concerted global effort
to answer.
References for this panel can be found in appendix 1 (p 109).
Five of the 16 challenges related to health system factors including: advocating for
and establishing the policy framework to implement people-centred eye care for universal
health coverage; strengthening integration between primary and secondary levels of
care, and between eye care and other health services; and strengthening the health
information system and ensuring better budget allocation for eye care. Two challenges
reflected the need to address shortages in human resources for eye health in parts
of the world—eg, sub-Saharan Africa, and to increase capacity of eye health personnel
in public health and leadership. These challenges could benefit from the application
of health systems and policy research to answer questions such as to what extent improving
integration between primary and secondary eye care services improve coverage, quality,
and equity, and reduce out-of-pocket costs.
Equity is a crucial issue for universal health coverage and is of relevance to any
service delivery-related research. We identified three challenges concerned with improving
access and promoting equity, reaching vulnerable and marginalised groups, and developing
and testing strategies to reduce out-of-pocket costs. Disadvantaged groups might have
worse outcomes that are obscured by aggregate data. A simple step is to disaggregate
data by the minimum set of social variables that are relevant in each context. In
addition, equity-relevant reporting guidelines and frameworks are available and can
be used in eye health research to consider equity in the design, analysis, and reporting
of research.182, 183 These challenges highlight the need for researchers to include
people with vision impairment and communities that the research is targeting in all
aspects of the process, from identifying the research question to co-designing and
implementing the study, data collection, analysis, and dissemination.
We believe this list of challenges serves as a starting point for immediate action
that needs to be taken by researchers and funders. We call for funders to use the
grand challenges to guide their research investments. Further, the list provides an
opportunity for consortia and networks, advocacy organisations, universities, and
governments to organise their activities around these challenges. In 2021, the authors
of this Commission will seek to cohost a workshop to generate a research agenda and
establish collaboration opportunities. The outputs of this workshop will include a
strategy for periodic monitoring of eye health progress.
Delivering research for universal eye health
We have identified six crucial actions to generate and use evidence to promote eye
health within universal health coverage. First, to develop a research agenda based
on the grand challenges. Second, to increase solution-focused research including more
contextually relevant implementation and health systems research, in partnership with
patients, communities, service implementers, and policy makers, with an emphasis on
ensuring that services address the leading causes of vision impairment in terms of
coverage, quality, equity, and financial protection. Third, to ensure more emphasis
is put on translating research findings into policy and practice, including better
partnership with policy makers and integrating eye health research into general research
priorities. Fourth, to avoid research waste by ensuring relevant questions are answered
by adequately powered, robustly designed studies that are informed by systematic reviews
of all the available evidence. Fifth, to support capacity building through equitable
North-South and South-South partnerships between researchers and research institutions.
Sixth, to ensure inclusion by monitoring diversity of research teams with structural
change toward better inclusion, and by including communities and patients throughout
the research development process.
Section 6: Beyond 2020—delivering high-quality universal eye care
The case for action
The UN has set ambitious SDG targets for 2030.
28
This Commission argues that eye health is integral to advancing sustainable development.
Extensive evidence shows that improving eye health contributes directly and indirectly
to several SDGs. Vision impairment profoundly impacts education and work, with substantial
implications for poverty and the economy. Improving eye health benefits quality of
life, general health, and wellbeing.
Universal health coverage is central to delivering SDG3 (good health and wellbeing).
We reason that universal health coverage is not universal without affordable, accessible,
high quality comprehensive eye care. One of the leading recommendations in the WHO
World report on vision
2
is “making eye care an integral part of universal health coverage” through implementation
of integrated people-centred eye care. However, this ambition is far from being realised.
In many regions, the scale and approach of existing service delivery are insufficient
to meet current population needs, let alone projected increases in the magnitude of
chronic eye conditions and vision impairment by 2050. In view of likely benefits to
sustainable development, increasing need, and availability of cost-effective scalable
interventions for many common eye conditions, the case for urgent action on eye health
is compelling. Global eye health needs to take its rightful place within global development
and the health agenda.
Conceptualising eye health within universal health coverage
WHO defines universal health coverage as follows: “Universal health coverage means
that all people and communities can use the promotive, preventive, curative, rehabilitative
and palliative health services they need, of sufficient quality to be effective, while
also ensuring that the use of these services does not expose the user to financial
hardship”.
184
The core components of universal health coverage are often illustrated using a cube
(appendix 1 p 64) and are intrinsically linked to health financing; the inner cube
reflects budget constraints.
185
To conceptualise eye health within universal health coverage, we have adapted the
cube (figure 16). Universal health coverage is not a fixed final goal; population
health needs change constantly and new treatment options are regularly developed,
which presents challenges for defining interventions and measuring impact.
Figure 16
Considerations for universal eye health coverage
Adapted from WHO 2015,
185
to contextualise to eye health services and include the quality component. The inner
cube has a colour gradation representing a range in the quality of delivered services;
green represents effective quality services and blue represents ineffective services.
An adaptation of the WHO universal health care “cube” which illustrates the three
dimensions of UHC: population coverage, service coverage, and affordability. An inner
cube illustrates the additional dimension of quality.
Here, we explore what the delivery of high-quality eye care involves within universal
health coverage, and the actions needed to move towards this goal by 2030. We propose
a framework for how eye health services could be integrated within the broader health
system and in non-health sectors. We highlight promising integration strategies across
levels of care and examine key enabling factors: workforce, financing, and technology.
We illustrate important issues by focusing on cataract surgery and refractive error
services, drawing together the available data to understand how these services are
currently doing in relation to universal health coverage (coverage, quality, equity,
and financial protection). Finally, we discuss cross-cutting issues integral to delivering
eye care within universal health coverage (monitoring progress, quality, access, equity,
and political prioritisation).
Selecting eye services for universal health coverage
National policy makers face complex, context-specific decisions in prioritising services
that maximise public health benefit with finite resources.
186
Cost-effectiveness is often an influential consideration, alongside need, sustainability,
affordability, and feasibility. Additionally, countries might also consider equity—giving
higher priority to services that benefit the poorest communities or those offering
greater protection from financial risk.
186
Ideally, coverage of high-priority services is extended to all before adding medium-priority
or low-priority services.
Our eye health economic literature review (section 4) highlighted the scarcity of
cost-effectiveness data, particularly for LMICs, covering few interventions. Substantially
more economic data are needed to inform countries that are deciding which eye health
services to offer within universal health coverage. Considering current data limitations,
how should eye care prioritisation choices be made? The epidemiology of eye disease
is key, with an emphasis on the leading causes of vision impairment. However, many
people presenting for eye health services have non-vision-impairing conditions and
an eye health need that requires these services.
WHO is currently developing a package of eye care interventions for multiple eye conditions,
informed by epidemiology and field experts.
187
The inclusion of interventions is guided by high quality clinical practice guidelines
and systematic reviews. Countries will be able to use these tools to inform service
inclusion decisions, method of delivery, and resource implications. However, the need
for more cost-effectiveness data to inform decisions relative to other health priorities
remains.
Although countries vary widely in terms of population needs and health system capacity,
core components necessary to meet general population eye health needs are similar
in different settings. Ideally, a minimum package of eye care within universal health
coverage would include primary eye care (promotion, prevention, and refractive services),
eye care integrated within other services (neonatal care, school eye health, non-communicable
eye disease services, care of older people), specialist ophthalmic services (to restore—eg,
cataract surgery and preserve vision—eg, glaucoma, diabetic retinopathy and age-related
macular degeneration management), and vision rehabilitation services.
Delivering integrated people-centred eye care
Delivering eye health services within universal health coverage requires multidimensional
integration, throughout and beyond the health system. Eye health needs to be included
within national health plans, policies, and financing mechanisms. It also needs to
be considered in policies and planning by other government ministries such as education,
labour, and finance.
Although we recognise that health systems vary substantially between and within regions
in terms of capacity and the stage of development, there are some broad organisational
similarities. Here, we present how eye care can be integrated into different aspects
of society and health systems including community, primary, secondary, and tertiary
levels (figure 17). Appendix 1 (pp 65–67) summarises services that could be provided
in different settings in low-resource, middle-resource, and high-resource settings.
Figure 17
Integration of eye health services within the health-care system
Schematic illustrating a framework for how different eye health services might be
integrated into the health-care system at the community, primary, secondary, and tertiary
levels. The content of this image is described in full in the main text.
The World report on vision
2
by WHO has placed renewed and welcome emphasis on a people-centred approach to eye
care delivery. Individuals and communities need to be empowered through increased
health literacy to actively engage in shaping and using services to drive demand.
Effective, timely services need to be easily accessible to the population in convenient
locations, with easy navigation through the system in cases for which more specialised
services are required. Effective health systems are characterised by strong connections
within and between levels.
A crucial component of delivering eye health within universal health coverage is effective
primary eye care, needed in all resource settings, which connects with the wider primary
health system and secondary eye health services. This Commission takes a broad view
of primary eye care, encompassing activities and interventions within community settings
and primary health facilities (general care and eye care). Primary eye care can include
promotive, preventive, diagnostic, treatment, and rehabilitative services.
Eye care in community settings
Delivering services within or close to where people live and work results in increased
access and use.188, 189 There are many effective eye health interventions that can
be delivered at community level.
Eye health education and promotion within communities can lead to improved knowledge
and service uptake.190, 191, 192 Promoting community-based facial cleanliness is integral
to trachoma elimination programmes.
21
Health promotion messages about meticulous contact lens hygiene are important in reducing
corneal infections.
193
To deliver education and promotion within integrated eye care, providers need to use
more people-centred or community-centred design approaches, recognising that people
are co-producers of health, not just users, beneficiaries, or choosers.
194
More behaviour change and co-design research is needed. Previously, many interventions
intended to improve facial cleanliness for trachoma ignored accepted theories and
findings about behaviour change.
195
A co-design process is underway in Ethiopia that seeks an in-depth understanding of
social and cultural determinants of behaviour, working with community groups to propose
and test contextually relevant strategies to promote facial cleanliness.
196
Digital communication offers new routes to share and amplify such messages.
192
Several community-level interventions have shown effectiveness. Vitamin A supplementation
and measles vaccination markedly reduced childhood cornea scarring.
197
Rubella vaccination has rendered ophthalmic complications of congenital rubella rare.
198
Mass drug administration for trachoma and onchocerciasis are delivered in community
settings and frequently involve community members in distribution (community-directed).
21
Community volunteers distributing azithromycin were integral to trachoma elimination
in Ghana.
199
Some countries train community health workers in primary eye care, including health
promotion, vision testing, and referrals. Clinical trials are few; however, they indicate
promise in identification of people with eye health needs. In Nepal, community health
workers were trained to recognise corneal abrasions and infections using a torch,
and to provide early treatment and referral, which led to improved outcomes.
200
In Kenya, community health workers have been trained to use a smartphone-guided vision
test and algorithm to identify and refer people with vision impairment and other eye
problems.
201
This approach has been tested in a cluster randomised controlled trial in Kenya,
202
and preliminary findings (unpublished) have shown that an increased number of people
with vision impairment and eye problems are attending eye clinics.
However, sustaining programmes that engage general community health workers is hard.
203
Although studies show efficacy of community health worker programmes under controlled
research conditions, long term programmatic implementation is less certain.
204
Implementation research is needed to establish approaches to sustainably embed basic
eye health in training and activities of community health workers.
Traditional eye remedies are widely used in south Asia and sub-Saharan Africa to treat
many eye conditions.205, 206, 207, 208 These remedies, frequently plant-based, are
either home-made or sourced from traditional healers.
205
They can worsen clinical outcomes through direct toxic effects, secondary infection,
or delay in seeking appropriate treatment.
206
Several studies have found that careful engagement and training programmes for traditional
healers can improve practice, reduce the use of traditional eye remedies, and promote
more rapid referral.208, 209 Such programmes are not widespread, but have potential
for impact.
Pharmacies and informal drug sellers (eg, patent medicine vendors in Nigeria), can
be the first source of health care accessed by people with eye conditions.
207
They can be an important source of health advice and simple treatments. However, in
some countries drug stores are poorly regulated, which leads to inappropriate advice
or treatments such as sale of steroid eye drops to people with corneal infections.
210
There is an opportunity in many settings to engage with pharmacists and drug stores
to promote eye health messages, safe prescribing, and appropriate referral.
Eye care in schools
Many countries have developed school eye health programmes (appendix 2 p 5).44, 45,
211 Screening approaches to identify children with vision impairment—eg, training
teachers to test vision, appear effective.78, 212, 213 Most vision impairment in school-aged
children is due to uncorrected refractive error.
214
Providing services in schools (refraction and dispensing spectacles) increases access
and uptake; low cost, high quality, ready-made spectacles can meet the needs of more
than 80% of children with uncorrected refractive error.
215
However, subsequent spectacle wear can be low; contextual interventions are required
to increase spectacle use.
216
An important consideration is how to reach children who are not in school.
217
Comprehensive school eye health programmes also include health education and promotion,
and support inclusive education for children with irreversible vision impairment.
Well-coordinated action is crucial in Asia to address myopia, with strong collaboration
between departments of health and education. This issue requires major changes in
education delivery and preventive approaches to slow down the onset of myopia.
218
For example, China is currently developing a national myopia strategy, with strong
links between health and education (appendix 2 p 6).
Preventing eye injuries
Workplace injuries are an important cause of serious ocular morbidity.
219
Minor abrasive corneal trauma during agricultural work is a frequent risk factor for
corneal infection in south Asia.
200
Using safety goggles while performing some tasks can prevent such injuries.
220
The introduction of seat belts and firework regulations reduced ocular trauma; these
should be promoted in areas where eye-related injuries remain common.221, 222
Eye care delivery in general primary health care
WHO calls for strengthening eye care delivery within primary health care to complement
work in secondary and tertiary eye care.
2
In many countries, general primary health-care workers assess, treat, and refer people
with eye problems. Primary health-care staff might also support community-based activities.
Services vary substantially between contexts; here we outline some similarities and
integration opportunities.
Longstanding work has enabled primary health-care workers to deliver primary eye care
and several training manuals have been developed.
223
However, experience is mixed; establishing primary eye care within primary health
care is not simple and requires substantial training investment and enabling environments.
General health-care workers usually receive little primary eye care training, leading
to important knowledge and skill gaps.210, 224, 225, 226, 227, 228 For example, training
primary health-care nurses to test visual acuity did not increase referral rates in
Malawi.
229
Short supply of basic equipment and insufficient ongoing support to deliver primary
eye care are frequent issues.203, 210, 224, 230, 231 Programme sustainability is challenging
in areas that depend on external non-governmental funding.
232
There are some promising strategies such as the Lady Health Worker programme
233
in Pakistan, which includes primary eye care, increasing detection, and referral from
the community; however, connecting to secondary care still remains challenging (appendix
2 p 7). In China, village doctors are trained by secondary eye care teams to identify
and refer people with vision impairment.
234
There is strong policy backing, whereby all people younger than 6 years and older
than 65 years are offered a vision check in primary health-care facilities. This policy
increases the number of people attending secondary units, which are more invested
in supporting primary eye care services. An intensive programme in Rwanda, training
health-care nurses in primary eye care, is now embedded in the general nursing curriculum
which substantially improves access to eye care services throughout the country.
235
Integration of primary eye care into primary health care services for younger children
is a major opportunity. WHO identified ten key activities to promote healthy eyes
in children.
236
These activities were tested in Africa.
237
A modification was included in the curriculum of WHO's Integrated Management of Newborn
and Childhood Illness (IMNCI)
238
in Tanzania (appendix 2 p 8). IMNCI is used in more than 100 countries to guide facility-based
management of illnesses in children younger than 5 years, in the primary care setting,
and is possibly a scalable and sustainable way to deliver interventions that address
primary eye care needs of young children.
Screening for diabetic retinopathy depends on close partnerships with general medical
services. The delivery of screening is being transformed by the increasing availability
of low cost retinal cameras operated by non-specialists, acquiring images for remote
grading. In high-income countries, established diabetic retinopathy screening and
treatment programmes deploy technicians to community settings to collect images for
remote grading and decide on the referral. In the UK, the proportion of blindness
in the working-age population, caused by diabetic retinopathy, has declined because
of improved diabetes control and the national screening programme (appendix 2 p 9).
239
Programmes are also being developed in LMIC settings. For example, in India, multiple
public pilot programmes have been developed by the Ministry of Health, showing a substantial
increase in the number of people screened at clinics for non-communicable diseases
and community health centres.
240
In sub-Saharan Africa and the Caribbean, multiple countries have developed regional
or national diabetic retinopathy screening programmes that also embed diabetic retinopathy
services within general non-communicable disease services.
241
The delivery of primary eye care by general health workers is an area that requires
systematic high-quality implementation research that analyses policies and systems
to assess strategies, which would fully embed primary eye care within primary health
care. Realistic expectations are needed in terms of the tasks that general primary
health-care workers can do alongside other duties. In this context, technological
developments hold promise in enabling task sharing.
Specialist eye health services within primary care settings
Some LMICs have permanently based mid-level ophthalmic personnel (non-physician specialised
practitioners) in larger primary health-care facilities such as community ophthalmic
nurses stationed in large district health centres in The Gambia.
242
These nurses serve approximately 30 000 people and provide a bridge between primary
health care and secondary services, supervising community-based primary eye care activities.
Similar examples are seen in Ethiopia (integrated eye care workers) or in Tanzania
(assistant medical officers in ophthalmology).
Outreach services are delivered in more remote regions by eye care teams visiting
periodically, and providing outpatient clinics and surgery.
204
In some countries these services are widely used to increase access to surgery (eg,
cataract).243, 244 Outreach services provide an opportunity for refresher training
and supervision of primary health-care staff involved in primary eye care. However,
communities can be left without access to services for extended periods, and this
method might discourage the development of local eye care services.
Primary eye care facilities or vision centres, pioneered by several large non-governmental
eye health organisations in south Asia, are satellite units operated by mid-level
ophthalmic technicians (appendix 2 p 10).
245
These units are separate from the public health system and are well integrated into
the networks of secondary and tertiary hospitals, with teleophthalmology support and
integrated electronic record systems.
246
Approximately 80–90% of people presenting to vision centres can be managed at that
level, and the remainder are referred on. However, the degree of integration with
general public health structures is suboptimal.
In high-resource and middle-resource settings, primary eye care is mainly delivered
by specialised personnel. In many high-income countries within community settings,
primary eye care and refraction services are usually provided by eye health specialists,
optometrists, or ophthalmologists in the private sector, with access to sophisticated
diagnostic equipment, particularly in urban areas.
Overall, populations are well served by easy access to a dedicated eye health workforce,
closely connected to the general primary health-care system. This Commission recommends
that, where possible, countries should move towards developing a dedicated eye health
workforce to strengthen primary eye care in the public and private sectors. Cadres
vary between countries. How these personnel are managed and integrated is an important
area for implementation research.
Refractive error services and public–private collaboration
There is an increasing need for refractive error services for adults and children
worldwide. Access to refractive error and optical services in primary care settings
is crucial. Services vary between countries and include optometrists, refraction technicians,
and ophthalmologists. A competent workforce is important, in addition to good governance
and equitable delivery, to ensure appropriate and quality spectacles for all.
In many regions, refractive error and optical services are provided by the private
sector and therefore, are largely market-driven to an extent that other eye care services
might not be. Market forces have been a major incentive for service development at
scale in some settings, providing well for population needs. However, if the distribution
of refractive error services is influenced by what providers consider a viable return
on investment, populations in areas of high deprivation could remain without access
to services.
247
The cost of spectacles can vary greatly between settings, and can involve large out-of-pocket
expenditure and be unaffordable to many people. In some countries there is a large
unregulated market of optical shops that might provide poor quality services.
248
The private sector usually does not share data on the number of refractions done and
spectacles dispensed—an information gap that needs to be addressed for countries to
be able to monitor refractive error services.
However, the private sector represents a huge opportunity to bring refractive error
services (and primary eye care more broadly) closer to communities. Indeed, given
the magnitude of uncorrected refractive error globally, eye health cannot be addressed
as part of universal health coverage without a major contribution from the private
sector. To contribute to delivering eye health within universal health coverage, more
consideration needs to be given to developing the right regulatory and market conditions
to promote high quality, affordable, and equitable services.
A strong regulatory framework for prescribing and dispensing refractive error corrections
allows for coherent health promotion messages. Users' trust in the clinical competency
and decision making of eye health workers is important for generating and sustaining
service demand. By contrast, the sale of unregulated, variable quality optical devices
(including via the expanding online market) might increase access, but at the possible
expense of quality and sustainability.
Public–private partnerships are promising ways of increasing spectacle coverage while
ensuring a safety net for those who are unable to afford private sector services.
Examples include the national Jaminan Kesehatan Nasional (JKN) scheme in Indonesia,
in which the vision test is provided by the public sector and a voucher is given to
obtain spectacles from accredited private entities. The national school eye health
programme in Trinidad and Tobago provides a government voucher for spectacles to reimburse
the private sector provider. In Rwanda, the national insurance programme includes
a sight test and a standard pair of spectacles, and more expensive spectacles will
also be subsidised. In the UK, the Scottish Government made primary eye care free
for all, at the point of use, and increased the fees paid to providers for their services.
This change increased the viability of service providers in deprived areas, despite
a lower demand for spectacles that generate more profit. Given the large and growing
problem of uncorrected refractive error, other strategies and better evidence, with
a focus on equity, are needed to improve effective coverage.
Connecting people to secondary eye care
A study
249
from Uganda illustrates several challenges in integrating eye health services into
primary health care and connecting people to secondary services (appendix 2 p 11).
This study documented the journey of people with severe corneal infections seeking
health care. Severe corneal infection is an acute painful condition requiring urgent
specialist treatment within a few days of onset to prevent permanent sight loss. Although
many people presented to a primary health-care facility within 2 days of symptom onset,
the seriousness of their condition was frequently not recognised, appropriate treatment
was not initiated, urgent referral to the hospital eye clinic was not given or followed,
and the opportunity to prevent irreversible vision loss was missed. Many people visited
multiple health facilities before reaching the eye unit for assessment and definitive
management. Other studies250, 251 have also reported that attending additional intermediate
health facilities for emergency and non-emergency conditions increases delays in accessing
treatment and the direct and indirect costs for patients. Effective referral decisions
and clearly defined pathways, ongoing supervision, and refresher training, would strengthen
primary eye care. Referrals made using an electronic system have shown notable success
in increasing the reliability and timeliness of attendance at secondary care facilities.
212
Eye care within secondary and tertiary health care
Secondary eye health services are important for diagnosing and managing the leading
causes of vision impairment, beyond uncorrected refractive error. These services include
surgery (for cataract and glaucoma), and laser and injection therapies (for diabetic
retinopathy and age-related macular degeneration). Access to rehabilitation services
remains inadequate in many regions and requires concerted action. In many countries,
secondary units support the development and supervision of primary eye care. Tertiary
facilities usually have a larger number of specialists, offering a range of subspecialty
services with more sophisticated equipment than in secondary units to manage complex
problems. Typically, ophthalmology and ophthalmic nurse training programmes are based
in tertiary facilities. In many LMICs, secondary and tertiary eye health services
have had long-term underinvestment in eye health staff, equipment, and infrastructure.
These issues are high priority and need to be addressed to deliver efficient and effective
services.
At secondary and tertiary levels, good communication and integration within the health
service is needed—eg, prevention, screening, and treatment of retinopathy of prematurity
requires close collaboration with neonatal unit teams. With the increasing availability
of low cost retinal cameras, task sharing is becoming a reality in some locations,
including a remote assessment by an ophthalmologist (appendix 2 p 12).
252
Similarly, diabetic retinopathy needs to be well integrated into primary health care,
from screening to clinical assessment, and treatment in secondary and tertiary units.
Vision rehabilitation services
Vision rehabilitation is a set of services that assists individuals who experience
disability to achieve and maintain optimal functioning. Services assist people with
activities of daily living, accident prevention, and general physical and psychological
wellbeing. People seeking vision rehabilitation face a range of challenges including,
but not limited to, scarce services, physical barriers, inadequate skills and knowledge
of the health workforce, and prohibitive costs. These barriers contribute to the global
estimate of only 15% of people who could likely benefit from these services currently
accessing them.
253
Insufficient systematic data remains a persistent issue in raising the profile of
vision rehabilitation and understanding the extent of the problem.
A nuanced tension exists between identity and recognising disability being part of
natural human diversity, the interaction of impairment with the physical and social
environment causing disability and a perception of medical care narrowly construed
as being to treat and cure disease. This tension becomes acute in determining who
ought to have responsibility for driving progress in vision related rehabilitative
services.
Concerned by the general challenges in rehabilitation, WHO convened a meeting in 2017,
Rehabilitation 2030: A call for action.
254
Participants agreed to improve the integration of rehabilitation within health systems
and strengthen intersectoral links. This shift recognised the gap produced by different
government departments who have responsibility for rehabilitation and placed an emphasis
on health to drive change as part of a continuum of care. The WHO World report on
vision calls for vision rehabilitation services to be included within eye care interventions.
Intersectoral partnerships with education, social services, and labour, are essential
to provide person-centred support with complimentary and additional support for social,
economic, and cultural participation.
Although improvements in the external environment are important for inclusion and
development, vision-related rehabilitative services are intrinsic to person-centred
health care for people living with blindness or vision impairment. Because the availability
and access to services is poor, this Commission urges a greater endeavour on the part
of eye health policy makers, practitioners, administrators, providers, and donors
to advance vision rehabilitation as an essential part of integrated people-centred
eye care. This shift will require action by WHO, governments, and eye health leadership
bodies such as the International Agency for the Prevention of Blindness to raise awareness
and build policies in collaboration with organisations for people with disabilities,
rehabilitation professionals, and other sectors.
Human resources for eye health
Aligning the health workforce and eye health needs
Delivering eye care within universal health coverage relies on an appropriately trained,
connected, and enabled workforce who are available, acceptable, and accessible.
2
Workforce competencies and configuration need to be matched to population eye health
needs. Services vary substantially in the complexity, type of equipment, facilities,
and competencies required. Workforce plans for eye health need to be included in the
overall national health workforce planning. Tools, such as the WHO Workload Indicators
of Staffing Need, can be used to systematically analyse workforce requirements and
personnel deployment to meet population needs.
An integrated eye care team within the public and private sector is needed and would
encompass community-based volunteers, delivering health messages and preventive interventions,
through to subspecialists in secondary and tertiary ophthalmology centres, providing
complex medical and surgical treatment. Workforce structures and responsibilities
differ between health systems; contributory roles include ophthalmologists, optometrists,
allied ophthalmic personnel, general health workers, counsellors, equipment technicians,
vision rehabilitation workers, managers, administrators (IT, finance, procurement,
maintenance), and community volunteers (appendix 1 p 68). Team composition varies
with population characteristics, disease patterns, and health system maturity. The
workforce needs to be well connected horizontally, within the local health system,
ensuring appropriate access points and localised care and vertically for effective
referral of more complex problems (figure 17).
WHO is calling for a change in eye health care delivery towards a more person-centred
approach, with increased emphasis on service delivery initiated in primary care.
2
This WHO vision needs a broader workforce view, involving populations and civil society
alongside the formal health sector, in contextually specific community-based activities.
To expand access to primary eye care in areas with few community-based allied ophthalmic
personnel, sharing tasks with non-eye-care health workers is necessary. This expansion
requires rigorous, competency-based training, reliable provision of essential equipment
and consumables, supportive supervision from specialist services, quality assurance,
and ongoing learning opportunities. The widespread introduction of core competency-based
skills training for eye health into general medical and nursing training is a good
starting point.
Primary eye care is preferably delivered by appropriately trained allied ophthalmic
personnel, working closely with primary health care teams, located in easily accessible
settings. Populations benefit from their expanded competencies and focus on eye health
activities. For example, community-based vision centres in India. In high-resource
and middle-resource settings, optometrists and ophthalmologists frequently provide
the first point of contact for those with symptomatic eye conditions and can potentially
provide opportunistic screening to detect asymptomatic conditions. Many LMICs need
to develop training capacity for allied ophthalmic personnel and optometrists, and
strengthen regulatory frameworks and ensure good governance.
For strong secondary and tertiary eye care services, planned investment in training
and providing equipment for ophthalmologists and the associated team, is needed. The
secondary and tertiary teams also support primary eye care, providing training and
supportive supervision. Shaping the eye health workforce requires responsive planning
and training for context specific needs.
Enabling environments to increase efficiency
Optimising productivity or efficiency of services requires personnel with the relevant
competencies and resources to be present at each level. Workforce productivity can
be a major challenge, with underuse of specialist eye health capacity, evidenced by
wide variation in the number of cataract operations done each year by ophthalmologists.255,
256 Simply increasing the workforce size is insufficient. An enabling environment
is crucial for workforce productivity, as the shortage of eye health workers is compounded
by limited access to equipment and consumables.230, 257 Maximising the effectiveness
of each team member is key to increasing overall productivity, and needs to be addressed
within a local and health system context.
There are good examples from different resource settings showing that service efficiency
can be increased using careful process analysis and well-coordinated teamwork. With
outreach teams supporting primary eye care and ensuring a steady flow of patients
for cataract surgery and hospital support teams ensuring sufficient surgical supplies,
sterile instruments, and regular equipment maintenance, the surgeon can be more productive
and average around 1500 cataract surgeries a year, which is routinely achieved in
settings such as Nepal and India.
258
These principles can be applied in other LMICs.
259
Efficiency also varies considerably between the public and private settings, with
variation in output attributed to training, personnel oversight, enabling workplace,
incentives, and good management.230, 260 More research is needed on enabling and motivation
factors that influence service volume and quality.
261
Motivation and retention are driven by many factors such as the work, responsibility,
achievement, organisational purpose, recognition and growth, compensation, security,
status, work conditions, and the relationship with the supervisor. Understanding these
factors in local contexts will help in building empowered, self-led teams. Retention,
motivation, and performance depend to a large extent on how well this improvement
is done.
Strengthening training to build quality
In many regions, education is based on outdated curricula taught in a traditional,
professional, siloed approach focused on knowledge of diseases rather than competencies.
The patient-centred approach outlined in the WHO World report on vision
2
has not always been adopted by the health education system.
124
There has been considerable development; updated and educationally sound competency-based
training curricula for ophthalmology are now available, with several international
collaborations leading to extensive exchange of knowledge.
262
There needs to be a further shift, with increasing emphasis on competency focused
learning tuned to meet population eye health needs.
Surgical training of ophthalmologists is an area of focus worldwide, with concern
about insufficient training opportunities.
263
To address these shortcomings, several initiatives are ongoing to strengthen surgical
competency training programmes. The quality of these programmes and subsequent service
provision depend on the training faculty, equipment, and opportunities to practise
under supervision. There is increased emphasis on training the trainers to empower
their approach. Programmes that are being cascaded in east Africa have transformed
training practices.
264
To improve the safety and efficiency of surgical skill acquisition, training has moved
away from the apprentice model towards the use of simulation surgery. Simulation-based
surgical education uses eye models and has been shown to rapidly and effectively increase
surgical competence.
265
This method increases confidence of the trainee surgeon and improves patient safety
by reducing complications and surgical errors. Relying on the outdated apprentice
model of surgical training is no longer appropriate. When underpinned by the principles
of adult learning and encompassing key facets of educational theory, surgical simulation
training is an important approach to bring novice eye surgeons to a competent level
before operating on patients under supervision.
Lifelong learning is essential for the workforce to maintain skills in the context
of rapid growth in medical knowledge and ever-changing health systems. In high-resource
settings, formal and informal opportunities build professionalism and competencies
in areas such as research skills, leadership, policy, and management. Equitable transferability
of these learning opportunities to a global scale is becoming increasingly recognised
through platforms such as the Orbis Cybersight programme and the International Centre
for Eye Health open education courses. Shared learning has grown with the increase
of a global online audience, particularly during the first months of the COVID-19
pandemic. These resources enable self-directed learning and lifelong educational opportunities
for eye health professionals, particularly beyond ophthalmologists.
Workforce size and distribution
Universal access to eye health can only be achieved if an appropriately skilled and
equipped eye health workforce is available and accessible to all those in need. National
and subnational analyses of workforce needs in relation to population eye health are
crucial, but currently not readily available. The International Council of Ophthalmology
(ICO) periodically assesses the global ophthalmology workforce. For 2015, they estimated
233 000 ophthalmologists in 194 countries (appendix 1 p 69).
266
Similarly, the World Council of Optometry assessed the number and distribution of
human resources for refractive services (2017–20), and reported 478 000 personnel
in 126 countries. Recognition of optometry has developed in many countries and is
either fully regulated, partly regulated, or legal recognition is underway. In some
countries, the scope of optometry has expanded from primarily refractive services
to some diagnostic and treatment services.
267
These data are challenging to collect, but data on allied ophthalmic personnel have
proven particularly difficult to collect because of the wide variability in nomenclature.
268
The overall regional prevalence of blindness appears inversely correlated with the
density of ophthalmologists per million population (figure 18). We recognise that
these data are confounded by socioeconomic factors and not all causes of blindness
are amenable to interventions by ophthalmologists. Several regions have clear shortages
of ophthalmologists who are able to do surgery for cataract and other conditions,
particularly in sub-Saharan Africa, which ranges between 1·1 and 4·4 ophthalmologists
per million population compared with a mean of 76·2 ophthalmologists per million in
high-income countries (appendix 1 p 70). Similarly, the overall prevalence of all
vision impairment appears inversely correlated to the combined density of ophthalmologists
and optometrists (figure 18). Several regions have shortages of optometrists; interregional
variation is stark, with a median of 1 per million population in low-income countries
compared with 221 per million population in high-income countries.
Figure 18
Vision impairment and eye health workforce
Shown for the Global Burden of Disease regions. (A) Age-standardised prevalence of
blindness (all ages) by the number of ophthalmologists per million population. The
circle area is proportional to the number of people who are blind. (B) Age-standardised
prevalence of vision impairment (mild, moderate, severe, and blind; all ages) by the
number of ophthalmologists and optometrists per million population. The circle area
is proportional to the number of people who have vision impairment. Data from Resnikoff
et al,
266
VLEG–GBD,
1
and World Council of Optometry.
257
Two bubble charts visualising the inverse relationship between eye health workforce
density and prevalence of blindness and vision impairment
National data on human resource density alone do not indicate access to eye care.
There are several challenges that need to be addressed to reach universal access to
eye health. First is the maldistribution of the workforce within countries. A study
268
mapping eye health workforce, in 21 sub-Saharan African countries, reported the mean
density of practitioners inside versus outside capital cities (ophthalmic surgeons
12·9 per million vs 1·7 per million, ophthalmic nurses 20·5 per million vs 7·7 per
million, refractionists [including optometrists] 16·7 per million vs 2·5 per million,
respectively). Similarly, in Latin America there is strong evidence of inequality
in the distribution of ophthalmologists, with higher density in more socially advantaged
urban geographic areas.
261
Small island states, such as those in Oceania and the Caribbean, face extreme challenges
in developing and retaining an eye health workforce (appendix 2 p 13). Second, by
only monitoring numbers, we have no information on workforce competency or scope of
service. The ICO survey
266
explored whether ophthalmologists were surgically active, finding 0·9 surgically active
ophthalmologists per million in low-income countries and 32 per million in high-income
countries.
Unmet needs, particularly in sub-Saharan Africa and parts of Asia, and future projections
indicate that the eye care workforce needs to be urgently expanded, especially because
training an ophthalmologist can take more than a decade. In the ICO survey, most countries
(60·3%) reported growing workforces; however, the annual global growth rate (2·6%)
lags behind the annual growth in the global population aged 65 years and older (2·9%),
which is set to double by 2050. How the workforce is trained, deployed, and empowered
to deliver services is equally as important as the numbers. Maximising health workforce
capacity by developing enabling environments, practices, and increasing motivation
is crucial for ophthalmic public health.
Innovating delivery: technology to support eye health
Advancing eye health services within universal health coverage, particularly in LMICs,
will require substantial expansion of service capacity. Many conditions already have
effective interventions. However, systems are failing to deliver and there needs to
be innovation in delivery. In primary health care settings, appropriate tools are
needed to enable non-specialist health workers to identify and refer people that need
services. Technological advances offer promise in enabling the larger health workforce
to support eye care delivery through task sharing.
Teleophthalmology
Teleophthalmology has been used for more than 20 years—eg, to enable consultations
for remote communities in Australia.
269
Eye health technicians in vision centres in India have been linked to ophthalmology
hub hospitals.
246
Teleophthalmology can be broadly classified as asynchronous—ie, when images are collected
by technicians for later review—or synchronous in live consultations. Asynchronous
teleophthalmology screening for retinopathy (diabetic and of prematurity) substantially
increases service coverage in a population, and reduces travel and opportunity costs
with a high degree of acceptance and satisfaction.
270
Synchronous teleophthalmology aids highly trained personnel in diagnosis and decision
making and immediate initiation of appropriate treatment, while reducing the burden
of patients travelling.
Mobile health
Rapid evolution of mobile telecommunications is profoundly impacting life, even in
remote locations. Many mobile health (mHealth) applications for eye care have been
developed, although few have achieved widespread uptake.
271
Further, insufficient regulation is a concern, with most publicly available eye care
applications being untested or unvalidated.272, 273 Several visual function testing
applications have been validated and show good performance compared with the conventional
charts used in rural settings in Kenya and Ethiopia.274, 275
By linking smartphone applications to a wider system, the effectiveness, efficiency,
and knowledge gains can be considerable. For example, a cluster randomised controlled
trial of an mHealth system for school vision screening in Kenya found that teachers
can reliably identify pupils with vision impairment using a smartphone-based visual
acuity application, which then initiates an electronic referral for full assessment.
212
This method more than doubled the uptake of secondary eye care services among those
referred, with active tracing of referred individuals, and SMS messaging to nudge
attendance. This system is being scaled up by the Kenyan Ministry of Health in several
regions. An integrated mHealth system is also being scaled up in Pakistan, enabling
community health workers to identify and refer people with eye health needs and increase
vision testing and decision support in the community (appendix 2 p 14).
Artificial intelligence
There is considerable interest in the potential of artificial intelligence and particularly
deep learning in ophthalmology.
276
This interest is driven in high-income countries by challenges in managing high volume
chronic conditions (age-related macular degeneration, diabetic retinopathy, and glaucoma).
Deep learning is particularly suited to these conditions because their diagnosis and
management is largely dependent on retinal photography (appendix 2 p 15) and optical
coherence tomography (appendix 2 p 16). Artificial intelligence has many potential
applications in eye health that could enhance delivery, optimise health system functioning,
and lead to improved patient outcomes. Examples of potential uses that are in development
include supporting point-of-care diagnostics,277, 278 surgical decision making (risk
stratification),
279
or patient management and treatment.
278
The most likely early application in public health programmes will be in screening
for diabetic retinopathy and retinopathy of prematurity.280, 281 Artificial intelligence
solutions can possibly be integrated with electronic medical records to support administrative
tasks such as identifying patients with a specific eye condition or at-risk patients.
282
Artificial intelligence can be used in clinical, epidemiological, and health system
research to incorporate data on social determinants of health, identify at-risk patient
populations, and help to prioritise scarce clinical resources.
283
This area presents an opportunity to address the link between poverty and blindness,
and the need to promote equity in eye health.
10
Finally, artificial intelligence coupled with telemedicine and mHealth could help
to reach populations with poor health system access, either because of geographical
isolation or scarcity of human resources for eye health.280, 284
There is little information on implementing artificial intelligence in eye health
delivery and even less on whether it could improve care or outcomes. Before deployment
into routine clinical practice, artificial intelligence applications require external
validation on data that were not previously used in algorithm development and should
undergo rigorous safety and efficacy testing in prospective clinical studies. In 2018,
IDx-DR was the first artificial intelligence screening product for diabetic retinopathy
to obtain approval from the FDA, after demonstrating good diagnostic accuracy in a
prospective trial
281
done in a real-world setting.
To assess the extent of translation-ready artificial intelligence (in use or soon
to be in use), this Commission did a scoping review for publications related to artificial
intelligence in eye health since 2015 to 2020 (appendix 1 p 71). We identified 1256
primary data reports, most (60%) focused on retinal imaging (20% diabetic retinopathy,
16% glaucoma, and 6% age-related macular degeneration). Only 12% of reports addressed
conditions that affect the anterior segment and 1·5% were on childhood eye conditions.
Most (90%), reported on artificial intelligence model development and internal validation.
Of 113 reports on external validation or successful deployment in clinical settings,
most were for retinal conditions (58%), facilitated by greater availability of images.
Arguably, the greatest potential for artificial intelligence to contribute to advancing
eye health would be to assist in case identification and health system efficiency,
helping people with uncorrected refractive error and cataract access services, neither
of which are currently well represented in artificial intelligence development platforms.
A substantial obstacle to artificial intelligence use in global eye health is the
availability of large well curated datasets from multiple distinct populations for
the development and validation of algorithms. Performance characteristics depend on
the data on which algorithms are trained. This Commission did a global review to identify
publicly available datasets of ophthalmic images.
285
We identified 94 (including six with data from two world regions) open access datasets
with more than 500 000 images from 23 countries; there were 13 datasets for which
the country was not specified. 34 datasets originated from populations in Europe,
21 from southeast or east Asia, 16 from North America, nine from north Africa and
the Middle East, four from south Asia, two from Latin America, and one from sub-Saharan
Africa. The most common conditions were diabetic eye disease (35 datasets), glaucoma
(19 datasets), and age-related macular degeneration (15 datasets). This under-representation
of populations in LMICs is a new manifestation of the digital divide occurring in
health, which we term health data poverty. The scarcity of representative datasets
(public and other) limits the extent to which populations can benefit from digital
health solutions and artificial intelligence systems. This limitation might lead to
pronounced bias and failure of generalisability, with a risk of underperformance or
even failure when transferred between settings and populations. We recommend that
the visibility, accessibility, and use of existing public datasets is improved and
that investment is made in developing new public datasets to support research, innovation,
and validation in regions with insufficient health data.
Sustainable financing for eye health
Better health financing is crucial to make progress towards universal health coverage.
To expand effective coverage for all, countries need to raise sufficient funds for
capital investment and ongoing service delivery costs; pool funds to spread the financial
risks and protect the most vulnerable; allocate and use funds efficiently and equitably;
and define the benefit package and rationing mechanisms.
286
Mobilising financial resources is key for eye health in LMICs, and determines the
scale, scope, and depth of coverage, quality, sustainability, and equity of eye health
programmes.
287
In many LMICs, eye health appears very underfunded. Data on eye health financing at
a global and national scale are scarce. However, the national eye health system assessments
done in the past decade indicate that in LMICs national health plans and budgets tend
not to include eye care; national eye health plans, if developed, are often insufficiently
funded, with eye health rarely considered in the allocation of resources; there is
often little or no social insurance coverage for many eye health interventions; in
many countries eye health programmes receive significant financial support from international
non-governmental organisations and other development partners; and out-of-pocket payments
for eye health are widespread.
Public spending
Public spending to increase coverage and financial protection is an important source
of eye health funding, particularly for the poorest people. However, analysis of government
expenditure on eye health is difficult as only a few countries make the data publicly
available (appendix 2 p 17), partly because national budgets and health accounts tend
not to delineate eye health explicitly and rather spread it across several categories.
288
Increased and better allocated public funding is central to making progress towards
universal health coverage by promoting coverage, equity, financial protection, and
sustainability.
Prepaid financing schemes
The inclusion of eye health services in compulsory prepaid financing (such as social
health insurance) could be an effective means to promote scale up and reach those
most in need. In countries where eye care services are included in benefit packages
under social health insurance, providers respond strongly to payment incentives, with
positive and negative consequences. For example, in Thailand, higher payment for cataract
surgery increased surgical rates.
289
However, in other settings such as the Philippines and Indonesia, payment structures
can contribute to cost escalation for schemes that have resulted in efforts to limit
surgical volumes, sometimes with potential negative consequences for equity. When
considering eye health services within social health insurance, who is covered and
from where services can be purchased are crucial to access, efficiency, coverage,
and financial protection. Specific measures might be required to ensure the most disadvantaged
are reached, as illustrated in Rwanda (appendix 2 p 18).
Out-of-pocket payments and private care
Regardless of the financing in place, out-of-pocket exemptions need to exist for the
poorest and most vulnerable communities and health insurance schemes need to provide
for poor individuals. In many LMICs, user fees are applied across the eye health sector
by all health-care providers (public, private, faith-based, non-governmental organisations)
to partly or fully cover the costs. Such out-of-pocket payments can be a barrier to
health care use, often for those needing it the most, and can push people into poverty.290,
291 Studies in sub-Saharan Africa and east Asia have found that patient costs for
cataract surgery can be as high as half of the average annual household income.292,
293, 294 Even when cataract services are included in insurance schemes, out-of-pocket
costs can remain high because of complex and often opaque arrangements on whether
or how particular items are covered.295, 296 Understanding how these costs reduce
access and contribute to financial hardship is important for eye health in universal
health coverage. Private financing (out-of-pocket, employer schemes, and private health
insurance) will continue to be a substantial source of eye health funding in many
contexts in the foreseeable future; therefore, more evidence is needed on financing
arrangements and interventions that can make eye care affordable to all.
External sources
Eye health is an important component of universal health coverage, largely neglected
by bilateral and multilateral donors. This Commission reviewed data on official development
assistance from bilateral, multilateral, and private philanthropy organisations (appendix
1 p 72). Between 2014 and 2018, the annual average external assistance for all eye
health was estimated to be approximately US$102 million, amounting to less than 0·06%
of the total global official development assistance. Around 66% of the US$102 million
was spent on supporting the elimination of neglected tropical diseases that cause
blindness, which reflects the great commitment by the US Agency for International
Development, UK Aid, and several philanthropic organisations to tackle neglected tropical
diseases. In view of the benefits to sustainable development, health, and wellbeing,
we believe that the case for increased investment in eye health is strong, taking
into consideration the crucial issues highlighted in our Grand Challenges exercise.
Several international non-governmental organisations provide substantial technical
and financial support to LMICs. There is no comprehensive database that records all
non-governmental organisation funding for eye health; therefore, estimating the total
international funding is difficult. However, an analysis
297
of annual reports suggested that 12 major non-governmental eye health organisations
provided almost US$430 million in 2013, which included grants from bilateral and multilateral
donors, and philanthropic organisations. Increased international support for eye health,
in partnership with public and private actors, and vision-related international non-governmental
organisations, would accelerate country-led efforts to move towards universal health
coverage and fulfil the promise to leave no one behind. However, external funding
needs to be considered as a supplement and not a replacement for government and other
domestic expenditures on eye health.
Innovative financing
Although alternative financing mechanisms and private finance are unlikely to address
all the unmet resource needs in eye health, they could provide substantial additional
funding to progress eye health services rapidly within universal health coverage.
The development of new alternative financing arrangements such as public–private partnerships
(eg, Onesight), development impact bonds and loans, social enterprises, and results-based
financing could help to fund the growing demand for eye care services (appendix 2
p 19). These initiatives will need to be evaluated on their ability to access new
financial resources, their costs compared with other funding schemes, the predictability
and sustainability of the financing, the effectiveness in delivering quality eye health
outcomes, the financial protection they provide, and their ability to address inequities
in access and use of eye health services.
More eye health for the money
More resources need to be raised to maximise impact, but optimising funding allocation
on eye health services is also crucial. Evidence on how to allocate funding is scarce,
so a data revolution is required to ensure “more eye health for the money”.
298
This revolution would include more and better research and programme data to inform
priority-setting and strategic purchasing. Topics for future research include costs
and cost-effectiveness of interventions, relative efficiency of various delivery models,
affordability (for governments and individuals), and financial barriers to accessing
services (including direct and indirect costs). We also need to better understand
how much funding is required and how much is being provided from different sources,
which interventions are being supported, who is benefitting from them and who is being
excluded.
Delivering financing for eye health
To improve eye health: (1) more resources from all sources are urgently required,
particularly in LMICs; (2) eye care needs to be integrated into general health financing
for universal health coverage; (3) financial resources must be used wisely and a commitment
is needed from all partners to ensure more eye health for the money; (4) countries
need to improve social health insurance schemes as eye health needs change; (5) strategic
purchasing arrangements need to be made to provide an incentive for efficiency, quality,
equity, and financial protection; (6) step-change in data and evidence is needed on
the financing of eye care, the value for money of interventions, and financial barriers
to access and use of services; and (7) alternative financing arrangements need to
be investigated.
Measuring progress in eye health
Strengthening eye health within universal health coverage requires clearly defined,
scientifically robust indicators that capture key health system inputs, outputs, outcomes,
and impacts. Indicators should provide insights to shape change and stimulate action.
In this way, the indicator framework can be intrinsically linked to priorities, design,
and continual improvement of services.
There are many potential indicators that could be used to monitor eye health services.
For example, WHO has published several lists of eye health indicators in the past
two decades: the 2002 framework for VISION 2020 included 35 indicators,
299
the 2006–11 action plan had 29 core indicators and multiple additional indicators,
300
the 2014–19 action plan included 19 indicators,
124
and in 2017 WHO produced a list of 32 eye health indicators for the African region.
301
The uptake and use of these indicators has been variable, probably because collecting
such data is challenging and expensive.
To contribute to thinking on indicators, this Commission convened an international
panel of 72 eye health system experts to participate in an indicator prioritisation
exercise (appendix 1 p 73). We developed a menu of 22 indicators covering each stage
of the results chain: inputs, outputs, outcomes, and impact (appendix 1 p 74–75).
From these, seven core indicators were selected (table 4). These indicators were considered
suitable to monitor universal access to quality affordable eye care services, including
proxy measures for accessibility and affordability, and two effective service coverage
indicators. We anticipate countries might wish to prioritise data collection for core
indicators, facilitating regional and global comparisons of eye health progress within
universal health coverage. Additional work is required to develop detailed indicator
metadata, address gaps around specific conditions (eg, glaucoma), and consider how
to measure the integration of eye health into the broader health system.
Table 4
Core indicators to monitor universal access to quality, affordable eye care services
Definition
Rationale
Data sources
Responsible entity
Comments
Accessibility of eye health services
Eye health facility density and distribution
Total numbers (public and private) of primary, secondary, tertiary, and low vision
services per million population, by place of residence (urban or rural); additional
subnational administrative or geographic divisions as relevant to setting
Place of residence should not be a barrier to accessing eye health services
Facility records, population data
Health ministry
Informs policy and planning about location of eye health services in relation to population
density; outreach programmes might be planned according to gaps in geographic access
to static services
Eye health worker density and distribution
Total numbers of ophthalmologist, optometrist, ophthalmic nurses, and other ophthalmic
personnel per million population, by place of residence (urban or rural); additional
subnational administrative or geographic divisions as relevant to setting
Availability and accessibility of eye health workers dictates access to care
Facility records, data from professional or regulatory bodies, population data
Health ministry
Informs policy and planning on recruitment and distribution of resources for eye health;
known disparities exist in the number and distribution of trained eye care personnel
between countries and by urban and rural settings within countries
Affordability of eye health services
Coverage of national health finance pooling mechanisms that include eye care services
Proportion of population covered with health finance pooling mechanisms that include
eye care services (considered individually): out-patient care, cataract, refractive
error services, glaucoma treatment, and diabetic retinopathy treatment
Cost should not be a barrier to accessing eye care; proxy for WHO, World Bank, UHC
financial risk protection indicators; catastrophic and impoverishing out-of-pocket
payments unlikely to be discriminatory for monitoring affordability of elective eye
care services
Health finance scheme reports and questionnaires
Health ministry
Informs policy about eye health financing and affordability; coverage within the lowest
wealth quintile should be reported alongside the total population to monitor equitable
coverage of eye health financing
Out-of-pocket payments for cataract surgery
Median (and range) of out-of-pocket payments made for cataract surgery as a proportion
of median monthly household (or individual) income
Cost should not be a barrier to accessing eye care. Proxy for WHO, World Bank, UHC
financial risk protection indicators; catastrophic and impoverishing out-of-pocket
payments unlikely to be discriminatory for monitoring affordability of elective eye
care services
Population-based surveys
Health ministry (surveys might be commissioned in collaboration with other stakeholders)
Informs policy about eye health financing and affordability; additional services could
be monitored in the same way
Effective coverage of cataract and refractive error services
Effective cataract surgical coverage
Among the population aged 50 years and older, people with operated cataract and good
postoperative presenting visual acuity as a proportion of all people with operated
cataract or operable cataract (disaggregated by sex or gender)
Sex-disaggregated or gender-disaggregated effective coverage measures UHC dimensions
of access, quality, and equity for the leading cause of blindness globally
Population-based surveys
Health ministry (surveys might be commissioned in collaboration with other stakeholders)
Informs policy and planning about the met and unmet need for cataract surgical services;
candidate WHO UHC tracer indicator.
Effective refractive error coverage
Adults with refractive error corrected to a predefined visual acuity threshold with
habitual correction as a proportion of all people with corrected and uncorrected refractive
error (disaggregated by sex or gender)
Sex-disaggregated or gender-disaggregated effective coverage measures UHC dimensions
of access, quality, and equity for the leading cause of vision impairment globally
Population-based surveys
Health ministry (surveys might be commissioned in collaboration with other stakeholders)
Informs policy and planning about the met and unmet need for refractive error services;
candidate WHO UHC tracer indicator
Prevalence of vision impairment
Prevalence of vision impairment
The prevalence of all cause distance and near vision impairment (WHO definitions);
disaggregation by key equity measures and by avoidable versus non-avoidable vision
impairment
Proxy measure of eye health; a measure of programmatic success. Journey towards eye
health as part of UHC
Population-based surveys
Health ministry (surveys might be commissioned in collaboration with other stakeholders)
Disaggregated vision impairment prevalence estimates inform policy makers about the
impact of eye health systems on eye health among population subgroups
Seven core indicators identified through the indicator prioritisation exercise, done
by this Commission. UHC=universal health coverage.
Ideal indicators to track outcome progress within universal health coverage capture
coverage and quality of an intervention, with disaggregation to assess equity. These
are referred to as effective service coverage indicators. WHO and the World Bank have
selected a panel of 16 tracer indicators to monitor progress towards universal health
coverage, including several effective coverage indicators.
302
A useful framework for conceptualising effective coverage and indicators in general
is the health-service coverage cascade model, first proposed by Tanahashi, and later
revised by the Effective Coverage Think Tank Group and others.303, 304 This framework
illustrates key dependencies and health system bottlenecks that prevent effective
delivery of services (appendix 1 p 76). With each step down the cascade, additional
members of the population in need do not progress towards the desired health outcome.
Ideally, effective coverage measures are outcome-adjusted, reflecting the desired
health impact. However, measuring the health outcome of interest is not always possible,
particularly in chronic diseases, for logistical or cost reasons, or because of the
delay between the intervention and realisation of the full health benefit. Therefore,
earlier steps in the cascade are sometimes necessary to consider.
Intervention or service coverage indicators measure the proportion of the population
that needs a service and receives it. This measure depends on those in need attending
a service provider that has all the necessary inputs available (staff, equipment,
consumables) to deliver the service. Considering service quality, how closely the
delivery follows guidelines indicates how likely the service is to result in the desired
health outcome. These are quality-adjusted coverage indicators. For interventions
that require ongoing acceptance and use, adherence-adjusted or acceptance-adjusted
coverage indicators can be applied. Proxy indicators are sometimes used, if service
coverage indicators are not available, and these provide a measure of health service
provision.302, 305 Measuring equity in service provision by disaggregating data and
comparing subpopulations—eg, by wealth quintiles, education, sex or gender, age, ethnicity,
and geographical location—is very important.
302
Eye health outcomes are currently not reflected by the 16 tracer indicators outlined
by WHO.
302
However, two indicators, effective cataract surgical coverage and effective refractive
error coverage, have been proposed for inclusion in the Thirteenth General Programme
Of Work 2019–23 framework
306
by WHO and endorsed in the World report on vision.
2
Both conditions are common and account for around 77% of vision impairment and these
two indicators also have a broader relevance to the health system. Cataract surgery,
one of the most frequent operations in many settings, is a marker for the provision
of surgical services and spectacle correction by refractive error services is a marker
for the provision of assistive devices.
Several indicators have been developed for cataract surgical services, which are defined
in appendix 1 (p 76).
307
Cataract surgical rate (the number of cataract operations per million population per
year) has been widely used for many years as a measure of service output. Cataract
surgical rate is used to set and track a desirable target to address the backlog and
ongoing incidence of cataract. Cataract surgical outcome is a measure of visual acuity
outcome and reflects the quality of surgery. It can be reported by the individual
surgeon, health facility, or by a programme. Cataract surgical coverage is measured
in cross-sectional population-based surveys, such as the RAAB survey. Effective cataract
surgical coverage combines the proportion of population covered and the visual acuity
outcome (figure 19).
308
The term operable cataract defines the threshold of vision impairment required for
an individual to be included in the population denominator of people with cataract,
which is used for estimating cataract surgical coverage or effective cataract surgical
coverage. RAAB surveys estimate these coverages using an operable cataract threshold
of worse than 3/60, 6/60, or 6/18. Each country determines which threshold is most
relevant to their context.
Figure 19
Effective coverage cascade for cataract surgical services
CSC=cataract surgical coverage. eCSC=effective cataract surgical coverage.
Bar chart showing the approximate proportion of the population in need of cataract
surgical services that actually receives the service. The purpose is to show how the
proportion gets smaller at each stage in the cascade of care, from initial contact
with health services to positive health outcome. For a longer description, refer to
appendix 3 in the supplementary materials.
Effective refractive error coverage was proposed and described as a method in 2019.2,
309 Effective refractive error coverage assesses the proportion of people with refractive
error who have received and use refractive error correction who achieve a specified
visual acuity threshold (eg, 6/12); it takes into consideration the met, under-met,
and unmet refractive error needs in a population (appendix 1 p 77). This method represents
a major shift in the way refractive error is reported. Surveys previously focused
only on counting unmet need (uncorrected refractive error) and excluded those who
already had access to refractive error correction. An important consideration is whether
spectacles are routinely used after being received, as reflected in the effective
coverage cascade for refractive error services (appendix 1 p 77). This issue is particularly
relevant for schoolchildren in many settings.
216
When data for effective refractive error coverage are gathered using a population-based
survey, the estimate considers people not adhering to spectacle use at that time as
having an unmet need.
Using coverage cascade models provides helpful insights into appropriate coverage
indicators and helps to identify key system blockages. Beyond effective cataract and
refractive error coverage, examining service delivery effectiveness for other leading
causes of vision impairment, such as glaucoma, diabetic retinopathy, and age-related
macular degeneration is possibly more complex. We have outlined potential approaches
for these three conditions in appendix 1 (p 78–79). Identifying the population in
need can be challenging because these conditions might be asymptomatic in the early
stages. Also, a successful outcome for each condition is to stabilise vision and prevent
further vision or functional loss, which can only be confirmed after long follow-up
between starting the service delivery and future observations. Therefore, an effective
coverage indicator might be unrealistic for these conditions, possibly necessitating
quality-adjusted service coverage indicators, at least in the medium-term.
Progress towards universal eye health coverage
Despite the reduction in age-standardised prevalence of vision impairment observed
in the past 20 years, the estimated number of people with vision impairment has risen
with the continuously expanding and ageing global population. To explore progress
towards improved eye health within universal health coverage in more depth, we focused
on cataract, a key tracer condition with more population-level data than refractive
error or other conditions.
We looked at peer-reviewed and grey literature since 2000 to 2020 for evidence on
the delivery of cataract surgery in relation to the dimensions of universal health
coverage: access, quality, financial protection, and equity (appendix 1 p 80).
310
We also analysed all available RAAB datasets from the past 20 years to calculate the
effective cataract surgical coverage, disaggregated by gender. We summarise the scope
of reported literature for key cataract markers in appendix 1 (p 81).
Cataract surgical rate was the most frequently reported indicator with data from the
past 10 years available for numerous regions. Cataract surgical rate data were available
for 175 countries since 2000. Over the same period, the median cataract surgical rate
varied considerably by GBD super region, from 494 in sub-Saharan Africa to 10 136
in high-income countries (figure 20). The global median cataract surgical rate was
1700 per million population per year from reports during the last decade (total range
95–14 188, IQR 720–3906). A desirable cataract surgical rate is context specific and
depends on the unmet need, quality of service, population structure, population cataract
incidence, and other factors.
Figure 20
Cataract surgical rate by Global Burden of Disease super region
Box and whisker plots; midlines are the median, boxes represent IQR, whiskers are
upper and lower adjacent values. Outliers are plotted as individual dots.
Box and whisker chart plotting Global Burden of Disease super-region against number
of cataract surgeries per million population per year. The purpose is to show a wide
variation, with the highest number for high-income countries and the lowest for sub-Saharan
Africa.
There were 203 national or subnational survey reports of cataract surgical coverage,
including 104 in the past decade. However, around a third of RAAB surveys done between
2000 and 2018 were not reported in the public domain, raising concerns over the selective
non-reporting of less favourable coverage. Analysis of these additional datasets would
contribute to a more complete epidemiological picture.
Cataract surgical outcome—a clinical marker of quality—was reported for 197 studies,
which were mostly cross-sectional population-based surveys with variable time intervals
between surgery and observation. We only considered surveys that reported presenting
visual acuity (vision tested using spectacles if available). During the past 10 years
most regions had two or fewer reports on cataract surgical outcome (appendix 1 p 81).
The longstanding WHO benchmark for a good outcome, following cataract surgery, is
a presenting visual acuity of 6/18 or better. This threshold was set more than 20
years ago with the expectation that it can be achieved in 80% or more surgeries.
311
Among 82 reports on presenting visual acuity since 2010, the median proportion of
people achieving 6/18 or better in the operated eye after surgery was 60% (total range
28–82%; IQR 50–68%). The median proportion of people with vision of 6/60 or worse
in the operated eye after surgery was 18% (total range 3–51%; IQR 13–25%). The distribution
of outcomes by GBD super region is shown in appendix 1 (p 83). Data from high-income
countries are reported in many ways, which prevents comparisons. However, population-based
data from Australia indicate that presenting visual acuity of 6/12 or better was achieved
in around 80% of people, and clinic-based data from the UK indicate this number is
closer to 90%.312, 313
Many surgeons audit their surgical outcomes. Collecting point-of-care outcome data
is important to drive quality improvement. However, clinical outcome data collection
is particularly challenging in LMICs, due to low postoperative follow-up rates. To
investigate the validity of early postoperative data, which is more practical to collect,
a large prospective study
314
was done in 40 centres across ten countries in Asia, Africa, and Latin America. This
study found that visual acuity measured during the first 3 days after cataract surgery
was highly correlated with vision measured at 40 days or more after surgery. Consistent
with previous findings, the final uncorrected visual acuity reached the WHO benchmark
of 6/18 or better in only 64% of cases. Outcomes improved slightly with refraction,
after which 85% had a best corrected visual acuity of 6/18 or better. Inadequate reporting
of outcomes and frequency of poor results suggest that cataract surgical quality is
not optimal and requires concerted action, with an emphasis on better integration
with refraction services and strengthening of monitoring and reporting outcomes (appendix
1 p 84). Tools such as the Better Operative Outcomes Software Tool (BOOST), a mobile
surgical outcome application, can facilitate the monitoring process.
315
The use of effective cataract surgical coverage (proportion of people aged 50 years
or older with operated cataract or operable cataract who have a good postoperative
presenting visual acuity) has only begun since 2017, with a total of 28 available
reports representing few global regions (appendix 1 p 81). To supplement these reports
and assess progress in the past two decades, we have reanalysed the data from 149
RAAB surveys from 48 countries (appendix 1 pp 84–85). We then selected the most appropriate
estimate available for each country. Some caution needs to be exercised in the interpretation
of these data as many are subnational surveys and have been extrapolated to represent
coverage in the whole country for the purposes of this analysis. Between 2000 and
2019, the median effective cataract surgical coverage for 48 countries was 43·4% (total
range 6·5–85·7%; IQR 29·4–59·2%), for an outcome of 6/18 or better and an operable
cataract threshold of worse than 6/60. Some inter-regional variation is present, although
the data from some areas are scarce (figure 21).
Figure 21
Effective cataract surgical coverage by Global Burden of Disease super region
(A) Cluster-adjusted, age-adjusted, and sex-adjusted estimates. (B) Cluster-adjusted,
age-adjusted, and sex-disaggregated estimates. Box and whisker plots; midlines are
the median, boxes represent IQR, whiskers are upper and lower adjacent values. Outliers
are plotted as individual dots. Countries within regions are represented by the most
recent national or subnational Rapid Assessment of Avoidable Blindness survey and
if two or more assessments occurred within 2 years, the median of estimates was used
(appendix 1 pp 84–85).
Box and whisker charts plotting Global Burden of Disease super-region against the
proportion of the population in need that receives effective cataract surgery. The
highest median coverage is found in high-income countries and the lowest in sub-Saharan
Africa. Women have lower median effective cataract surgical coverage rates in all
regions except Latin America and the Caribbean.
Systematic information on financial risk and protection in relation to eye health
is rare, with only six reports worldwide from the past 20 years (appendix 1 p 81).
For many people who are least able to pay, out-of-pocket payment for cataract surgery
and presumably other procedures remains common.
Equitable access to eye health services has been assessed by disaggregating data,
most frequently by gender, followed by place of residence, and socioeconomic status
(appendix 1 p 81). These variables need to be routinely included in population-based
surveys and analysed, to identify and inform the design and delivery of services for
marginalised groups. Disaggregation of larger datasets, particularly for cataract
surgical coverage, has highlighted disparities between men and women.316, 317, 318
We have disaggregated the results by gender (figure 21), showing that women consistently
have lower effective cataract surgical coverage rates. For example, data from the
Nigerian and Sri Lankan National Blindness Surveys
8
have been disaggregated by gender, marital status, and area of residence (urban or
rural), for the prevalence of cataract blindness and effective cataract surgical coverage
(appendix 1 p 85). In both countries, the effective cataract surgical coverage was
particularly low for women who were widowed living in rural areas. Further work in
the design and delivery of services is needed to ensure more equitable outcomes among
women.
There are fewer population-based data on effective refractive error coverage, which
have mostly been collected through national eye health surveys or subnational surveys
using the Rapid Assessment of Refractive Error (RARE). Several of these studies are
summarised in table 5. Only one study was from a high-income country (Australia).
The median effective refractive error coverage was 22% and the range was wide at 0–94%.
Despite few data, clearly, at least in LMICs, the effective refractive error coverage
is often low and represents a substantial unmet need. Existing data gaps need to be
urgently addressed to understand the scale of needs, to inform programme implementation,
and track progress. An updated RAAB survey protocol will be released in 2021, which
will support the collection of additional visual acuity data outlined in appendix
1 (p 77), to enable estimation of effective refractive error coverage.
319
Table 5
Population-based studies reporting effective refractive error coverage
Method
Age group, years
Effective refractive error coverage (95% CI)
*
Eritrea (Chan et al, 2013)
Subnational; RARE
15–50
22·2% (16·7–28·5)
Nigeria (Ezelum et al, 2011)
National eye health survey
≥40
3·4% (2·3– 4·4)
Tanzania (Mashayo et al, 2015)
Subnational; RARE
≥15
1·7% (0–3·3)
South Africa (Naidoo et al, 2016)
Subnational; RARE
15–35
51·4% (28·1–74·7)
Uganda (Nsubuga et al, 2016)
Subnational; RARE
15–50
6·0% (1·7–10·2)
Mozambique (Lougham et al, 2015)
Subnational; RARE
15–50
0·0%
Colombia (Casas Luque et al, 2019)
Subnational; RARE
≥15
50·9%
Iran (Fotouhi et al, 2006)
Subnational eye health survey
≥5
66·0%
Bangladesh (Bourne et al, 2004)
National eye health survey†
≥30
25·2%
Timor-Leste (Ramke et al, 2007)
Subnational; Modified RACSS‡
≥40
15·7%
Pakistan (Shah et al, 2008)
National eye health survey
≥30
15·1%
Australia (Foreman et al, 2017)
National eye health survey†
≥40
93·5% (92·0–94·8) for non-Indigenous; 82·2% (78·6–85·3) for Indigenous Australians
References can be found in appendix 1 (p 104). RACSS=Rapid Assessment of Cataract
Surgical Services. RARE=Rapid Assessment of Refractive Error.
*
95% CI given if reported.
†
An assumption of need, because the uncorrected visual acuity measurement was not given.
‡
Used a threshold of 6/18 (not 6/12) to define refractive error.
Improving quality of eye care
Delivery of high quality services leading to good health outcomes is central to universal
health coverage.320, 321 Unfortunately, high quality services are far from universal.
320
Typically, clinical outcome measures such as visual acuity are used to quantify service
effectiveness, and are tracked using population-based surveys. However, these provide
a narrow understanding of the overall quality of care; a more holistic perspective
is needed. A quality framework favoured by WHO
320
considers seven components: effectiveness, efficiency, people centredness, safety,
timeliness, equity, and integration. For the purpose of this Commission, in alignment
with the SDGs, we have added planetary health as a component. Using cataract as an
example, we examine approaches to improve the quality of eye care services.
Annually, an estimated 25 million cataract operations are done globally; making it
the second most common surgical procedure after caesarean section.322, 323 However,
from the available data on cataract surgical outcome and effective cataract surgical
coverage, there is a major challenge in delivering effective and high quality services
in many regions (figure 21). Moreover, these data present an overly optimistic view
of the outcome because they define a good outcome following cataract surgery as 6/18
or better.
311
However, 6/18 is still mild vision impairment. Since the WHO benchmark was set, cataract
surgery has developed substantially with widespread adoption of small incision procedures
and intraocular lens implantation. For these reasons, we recommend an update to the
benchmark threshold of effectiveness for a good outcome, which should be a presenting
visual acuity of 6/12 or better. This threshold would be used for reporting of surgeon-specific
cataract surgical outcome and in the analysis of effective cataract surgical coverage
in population-based surveys and would be expected to speed up efforts to improve quality
and effectiveness.
The country with the largest number of RAAB or Rapid Assessment of Cataract Surgical
Services surveys (38 between 2000 and 2015) is Vietnam. These surveys show rising
cataract surgical coverage and effective cataract surgical coverage rates over the
15-year period (figure 22). Improvement in effective cataract surgical coverage seems
partly attributable to increased use of intraocular lenses from 48% in 2000 to 98%
in 2015.
324
Notably, the effective cataract surgical coverage rates were substantially lower than
the cataract surgical coverage rates, which indicates that the quality of surgical
outcomes was not optimal. We have examined the effect of raising the effective good
outcome threshold from the current 6/18 or better, to 6/12 or better (figure 22).
We also examined the effect of changing the threshold for operable cataract, the population
denominator, from the current worse than 6/60 to worse than 6/18 and 6/12. Both threshold
changes lead to substantial reductions in effective cataract surgical coverage, which
could drive action to increase coverage and quality of services.
Figure 22
Cataract surgical coverage in Vietnam
(A) Cluster-adjusted, age-adjusted, and gender-adjusted data from subnational Rapid
Assessment of Avoidable Blindness surveys done in Vietnam in 2000–02 (n=8), 2007 (n=16),
and 2015 (n=14), estimated for an operable cataract threshold of worse than 6/60 and
a good clinical outcome of 6/18 or greater. (B) Data from 14 subnational surveys done
in Vietnam in 2015. Data are plotted for three thresholds of operable cataract and
two different levels of vision outcome: 6/18 or better and 6/12 or better. Box and
whisker plots; midlines are the median, boxes represent IQR, whiskers are upper and
lower adjacent values. Outliers are plotted as individual dots. CSC=cataract surgical
coverage. eCSC=effective cataract surgical coverage.
Box and whisker charts showing cataract surgical coverage and effective cataract surgical
coverage in Vietnam. The data show increasing coverage between 2000 and 2015 and decreasing
coverage as the visual acuity thresholds for operable cataract and good clinical outcome
are increased.
There is abundant literature tracking the incremental technical development of cataract
surgery, which usually restores vision in the absence of other ocular comorbidities.
Two most commonly used surgical techniques to treat cataract are phacoemulsification
and manual small-incision cataract surgery. Phacoemulsification is the standard of
care in high-income countries and requires sophisticated equipment and more expensive
intraocular cataract lenses and surgical consumables.
Manual small-incision cataract surgery uses a smaller incision compared with the older
technique of sutured extracapsular cataract extraction, causes less surgically-induced
astigmatism and achieves uncorrected visual acuity of 6/18 or better in more patients.325,
326 There has been a major shift from extracapsular cataract extraction to manual
small-incision cataract surgery in many LMICs. Manual small-incision cataract surgery
is now the most commonly done procedure in south Asia and sub-Saharan Africa.327,
328 Evidence from randomised controlled trials329, 330 suggest that people receiving
manual small-incision cataract surgery have a small reduction in the chance of achieving
uncorrected visual acuity of 6/18 or better after 6-8 weeks compared with phacoemulsification
(pooled risk ratio 0·90, 95% CI 0·84–0·96), probably due to more surgically-induced
astigmatism, but are likely to achieve similar levels of good best corrected visual
acuity (0·99, 0·98–1·01). Complication rates are low with both techniques. The cost
of phacoemulsification is two to four-times the cost of manual small incision cataract
surgery.329, 330
The outcome of manual small-incision cataract surgery can be improved using routine
ocular biometry to select an appropriately powered intraocular cataract lenses (which
is not the standard in some regions),
327
for meticulous adherence to the surgical technique, and for close integration of refractive
and cataract services to prescribe spectacles. These steps are expected to eliminate
the small outcome gap between phacoemulsification and manual small-incision cataract
surgery. Overall, from the public health perspective and given the unmet need and
limited financial and service capacity, this Commission cautions against recommending
LMICs to transition from small-incision cataract surgery to phacoemulsification because,
without a substantial increase in resources, this change could result in fewer people
receiving treatment for cataract.
We reviewed published literature for interventions to improve the quality of cataract
services (appendix 1 p 87).
331
We searched for intervention studies that addressed one or more of the seven dimensions
of quality, plus planetary health. We specifically excluded intraoperative intervention
studies—eg, those that compared alternative procedures or intraocular lenses—because
they have been thoroughly reviewed elsewhere.329, 332, 333 We identified 143 publications,
largely (65%) from high-income countries (appendix 1 p 88). Most studies looked at
interventions to improve efficiency and people centredness, with a smaller number
examining effectiveness, safety, and equity. Appendix 1 (p 89) summarises several
interventions found to improve efficiency, people-centredness, and effectiveness.
These findings highlight that many interventions can improve the multidimensional
quality of cataract surgery services. However, only a few of these studies were done
in LMICs. This evidence gap needs to be addressed to guide approaches and improve
service quality.
A 2018 Lancet Global Health Commission
321
on high-quality health systems proposed a set of four universal actions for improving
health care quality, which provides a useful framework for LMICs. The first universal
action is to govern for quality through strong leadership and governance with clear
policy, regulations, and accountability. This action is particularly relevant to eye
health, as in many countries services are often provided in the private sector. The
second action was to redesign service delivery to maximise the quality of care; there
needs to be a thoughtful analysis of the appropriate location and specialised teams
for service delivery to ensure the best possible outcome. Although there is a clear
need to strengthen the delivery of basic eye health services in primary care settings,
equally, specialist eye care services need to be appropriately staffed and equipped.
The third action is to transform the workforce with intense focus on relevant competency-based
training, strengthening health-care training institutions, and establishing enabling
work environments. Urgent action is needed to develop and enable the eye health workforce
to deliver quality care. The fourth action proposed is to ignite a demand for quality
within the population by sharing information about quality and seeking active patient
engagement to shape services that meet the needs of the population. This action is
particularly relevant to ophthalmic surgery, with increasing publication and awareness
of expected outcomes informing choices in some settings, with potential to extend
to other areas.
Eye health and planetary health
Climate change is occurring, primarily mediated by greenhouse-gas emissions. Global
health care is estimated to contribute to approximately 5% of all greenhouse-gas emissions.
334
Eye care is a high volume service with a large number of consultations and procedures
annually, and therefore, a substantial contributor to health-care emissions. With
the ageing population increasingly requiring eye care interventions, we need to promote
sustainable practices. We did a review to examine the extent and nature of the potential
environmental impact of eye health services (appendix 1 pp 90–91). Evidence is scarce,
with only eight reports meeting our criteria. A detailed carbon footprint of phacoemulsification
cataract surgery has been estimated for individual centres in the UK and India.61,
335 For the same procedure, the UK centre produced 20-times more CO2 emissions than
the Indian centre. To improve this field, tools are being developed to routinely measure
environmental costs associated with cataract surgery as a mark of quality, alongside
the other measures of high-quality services. Every aspect of practice can be examined
and opportunities to reduce environmental impact can be identified.
Increasing access and equity in eye care
Access to eye care is not equally distributed between and within countries, with marginalised
and socially disadvantaged populations experiencing more difficulty in accessing the
required care. This persistent inequity must be addressed for eye care to be realised
within universal health coverage. Indeed, unless equity is prioritised, inequalities
will probably increase in pursuit of universal health coverage, as the socially advantaged
are more able to use new or improved services.
336
In many high-income countries, people can access the eye care they need, although
often the most marginalised groups such as Indigenous people or other minority ethnic
groups are unable to access eye care, such as those in the USA (appendix 2 p 20).
Another example is Australia, where most non-Indigenous Australians have access to
good quality cataract surgery (effective cataract surgical coverage achieving 6/12
or better, 88·5%, 95% CI 85·2–91·2) compared with only half of Indigenous Australians
(51·6%, 42·4–60·7).
312
To explore how to improve access to eye care for these groups in high-income countries,
we did two separate scoping reviews (appendix 1 p 92).337, 338 In addition, some of
the key points for addressing eye health inequity for Indigenous Australians are described
in appendix 2 (p 21).
In these reviews we identified 41 studies reporting strategies to improve access for
Indigenous people, primarily in Australia (26 [63%]), and separately, we identified
67 studies reporting strategies for other minority ethnic groups, mainly in the USA
(60 [90%]).337, 338 Strategies focused on diabetic retinopathy services were the most
common (51% in the first review and 42% in the second). We mapped some of these strategies
against a patient-centred health-care framework to show various ways in which access
can be enabled through a pathway of having and perceiving a need for care; desiring,
seeking, reaching, and using that care; and the subsequent health consequences (figure
23).
339
The range of strategies outlined in figure 23 shows the complex nature of health-care
access from the service and patient perspective, and the breadth of possible approaches
to reduce inequity. Several of the most effective interventions addressed three or
more access dimensions concurrently, often from the patient and service perspective.
Despite the strong emphasis on reducing inequality in these approaches, only a third
of studies in each review reported engaging the target communities during the design
phase.
Figure 23
Strategies to improve access to eye care for Indigenous and other minority ethnic
groups
Identified from scoping reviews for Indigenous people and other non-dominant ethnic
groups in high-income countries, mapped to the patient-centred access framework by
Levesque et al.
339
Randomised controlled trials are shown in bold. References can be found in appendix
1 (p 102).
Schematic illustrating strategies to improve access to eye care for Indigenous and
other minority ethnic groups mapped to the patient-centred access framework by Levesque
et al.339 For a longer description, refer to appendix 3 in the supplementary materials.
A promising strategy in pursuit of universal health coverage for eye care is proportionate
universalism, which aims to improve outcomes for all population groups and specifically
targets disadvantaged groups to ensure that improvement is proportional to need at
the outset, showing the greatest benefit in these groups.
336
The benefit of this approach was shown in maternal and child health, with countries
using proportionate universalism to reduce inequality between the poorest and richest
quintiles and improving coverage at the aggregate level compared with countries using
other approaches.
340
There are examples of the need for proportionate universalism in eye health, such
as in Nigeria and Sri Lanka, where national surveys revealed that unmarried rural
women (mostly widows) had disproportionate cataract blindness.
8
The social distribution of cataract blindness in these two countries (appendix 1 page
86) highlights the need to allocate resources and action proportionate to need, with
a particular focus on identifying strategies to improve access to care for women in
rural areas with low social support.
Unfortunately, there are no published reports of proportionate universalism being
applied in eye care. Indeed, there is little robust evidence on how to reduce inequity
in eye health, including cataract services.
341
We did an umbrella review of systematic reviews on gender and eye health. Only one
of 58 included reviews described interventions to address gender inequality; the remaining
reviews reported gender differences in the prevalence of eye conditions or access
to cataract services (appendix 1 pp 93–94). To reduce this evidence gap, we did a
modified Delphi process to identify priority groups and testable strategies to reduce
inequity that can be assessed in future research (appendix 1 pp 95–96). Across two
rounds we asked 183 participants worldwide to first nominate and then prioritise the
groups which have the most difficulty and represent the largest number of people unable
to access cataract services in their region, followed by the most promising strategies
to improve access to screening and surgical services for cataract. Globally, three
groups that need to be prioritised were identified as: people living in rural or remote
areas, those with low socioeconomic status, and those with low social support. In
most regions, data are not routinely collected on these characteristics in relation
to vision loss from cataract and the access to services.
South Asia was the only region in which women were among the top three prioritised
groups, despite all regions having more women than men living with vision loss. One
explanation for women not being prioritised might be because they are not universally
disadvantaged, with some women able to access the required eye care. Married women
in Nigeria and Sri Lanka were found to be the subgroup with the lowest prevalence
of cataract blindness (appendix 1 p 86).
8
This disparity between different subgroups of women highlights the need to disaggregate
by more than one sociodemographic factor, which provides a more nuanced understanding
of the need distribution and where to target additional resources. Equity-relevant
targets are also needed. Services often aim to deliver 50% of services to women to
be equitable. However, worldwide there are more women than men with vision loss and
equity-relevant service targets would reflect the disproportionate number of women
in need of care (figure 10).
The globally prioritised strategies to improve access to screening and surgery involved
improving the availability of services, improving integration, and reducing out-of-pocket
costs, whereas participants from high-income countries prioritised efficiency, targeting
at risk groups and cultural safety (appendix 1 pp 95–97). Some of these strategies
have previously been described and evaluated, primarily those targeted to rural dwellers,
people of low socioeconomic status, or women.10, 49 A common reflection of this literature
is that a multifaceted approach is needed to address the diverse nature of barriers
faced by socially disadvantaged groups. For example, outreach screening combined with
counselling, providing transport, and low out-of-pocket costs for surgery increased
the uptake in rural Tanzania and Kenya, whereas cataract case finders in Madagascar
were not successful as the people identified with operable cataract had no means to
reach the hospital.243, 342 Access and equity are crucial areas in which to develop
better evidence in the coming decade.
Universal health coverage will not be realised without a deliberate effort to build
equity into design. This needs to be informed by a thorough understanding of the groups
that are being left behind and meaningful engagement with communities to co-design
approaches that meet needs equitably. More representative leadership in global eye
health is also needed, which was highlighted in our analysis of organisations working
in this field (appendix 1 p 98).
343
Political prioritisation of global eye health
Over the past 30 years the eye health sector, including health ministry staff, civil
society, eye health professionals, academics, and WHO, have worked hard to increase
the global profile of eye health. Some good progress has been made—several World Health
Assembly resolutions have been adopted,124, 344, 345, 346, 347 action plans implemented,
and global coalitions formed.124, 300, 348 Despite these improvements, international
and national political leaders have not sufficiently prioritised eye health, leaving
it under-resourced and poorly integrated into national health systems.
2
To analyse factors shaping global political prioritisation for eye health, we applied
the framework developed by Shiffman and Smith (panel 6; appendix 1 p 99).
349
This framework identifies four categories that shape political prioritisation in global
health: power of the actors involved, ideas they use to portray the issue, the political
context, and characteristics of the issue. The development of eye health services
in China since 1949 provides an example of the impact that evolving political prioritisation
can have on eye health service provision (appendix 2 p 22).
Panel 6
Determinants of political priority in global eye health
Actor power: strength of individuals and organisations concerned with the issue
Policy community cohesion
There is a strong degree of coalescence among the eye health community on the issue.
However, the sector needs to build partnerships outside the sector.
Leadership
The sector has produced excellent programmatic leaders but has few system leaders
or external champions for the cause.
Guiding institutions
WHO has provided some institutional leadership on vision as a health issue; however,
such leadership has been largely absent within the broader UN system.
Civil society mobilisation
Civil society organisations have mobilised international and national political authorities
to address the issue globally; however, eye health has been narrowly framed as a technical
eye care issue and involved low public engagement.
Ideas: the ways in which those involved understand and portray the issue
Internal frame
Eye health actors generally agree on the definitions, causes, and solutions to blindness
and vision impairment. However, they have not been sufficiently united in framing
the issue.
External frame
Eye health has not been portrayed in a way that resonates with external audiences,
especially with political leaders.
Political contexts: the environments in which actors operate
Policy windows
The development of Sustainable Development Goals (SDGs) was a missed opportunity and
eye health was not included. The UN Decade of Action on the SDGs and the WHO Thirteenth
General Programme of Work with triple billion targets, including universal health
coverage, provides new policy windows in which to integrate eye health.
Global governance structures
Several World Health Assembly resolutions provide high aspirations for improving eye
health. The International Agency for the Prevention of Blindness coordinates international
efforts in blindness prevention, providing an effective platform for collective action
with over 150 member organisations worldwide, including non-governmental organisations
and civil societies, corporate organisations, professional bodies, and research and
eye care institutions.
Issue characteristics: features of the problem
Credible indicators and targets
Previous indicators and targets have been clear and ambitious but not realistic and
not linked to a clear pathway for achievement, undermining their credibility. New
indicators and targets linked to universal health coverage are under development.
Severity
The scale of the burden is substantial. But eye health, when compared with other health
issues, is often regarded as a second-order issue by governments, because of the historic
scarcity of evidence on measures of impact such as mortality. The sector has not yet
managed to gain policy traction for the economic and development case.
Effective interventions
Effective interventions are available and among some of the most feasible and cost-effective
of all health-care interventions.
Many aspects suggest that global eye health is well placed to attract political support.
Vision impairment is associated with mortality (figure 6), and eye care interventions
are among some of the most feasible and cost-effective in health care. The issue is
also global; impaired eye health and the need for eye care affect large numbers of
people across all socioeconomic groups and the life course. There is broad agreement
within the global eye health community on the policy agenda; partnerships have enabled
the development and delivery of highly successful eye health programmes, such as for
trachoma control. In addition, the International Agency for the Prevention of Blindness
brings together a cohesive community of active organisations, giving the sector a
platform and voice for collective action.
However, even when global and national political commitments towards eye health have
been made, resources have not been provided at the scale and breadth required to meet
growing demand. Several factors could explain this shortcoming. The case for the importance,
severity, and ubiquity of eye health has not been made with sufficient force. Key
opportunities have been missed; one notable example is that eye health is not referred
to in the SDGs.
WHO has provided leadership, dedicated resources, and technical expertise to the great
benefit of eye health, even though the institutional priorities set by WHO have fluctuated.
Until the encouraging formation of the UN Friends of Vision group of Member States,
such institutional leadership has been largely absent in the rest of the UN system.
The missions of UNDP, UN Women, UNICEF, and the International Labour Organization
all intersect and could be enhanced by better eye health, but generally vision-related
activities have not been included in their work.
Internal and external framing of eye health has been ambiguous. Although the sector
has argued at times for integration of eye care as part of the mainstream health agenda,
many high-profile successes are positioned outside public health systems and are viewed
as vertical in approach. This ambiguity has reduced the need to compete against other
health issues and eye health has often been omitted from health system strengthening
and universal health coverage agendas.
The role of national and international non-governmental organisations and donors in
financing and delivering eye health services has sometimes had the unintended effect
of discouraging government ownership and resource allocation. In some countries, non-governmental
organisations and donors are outside of government systems, limiting the responsibility
and accountability of national actors. Some governments have come to wholly rely on
the non-government sector for eye health service delivery and therefore have not engaged
nor allocated their own resources to eye care within health system strengthening and
universal health coverage.
This problem is changing. Increasingly the eye health sector has made a concerted
effort to position vision within mainstream health policy, emphasising the need to
embed eye care in national health systems and primary health care. Crucially, the
WHO World report on vision
2
recommends that eye health should be part of every country's journey towards universal
health coverage.
The COVID-19 pandemic will probably transform the importance of health and health
systems within government policy in general. Although long-term effects will take
time to be understood, conceivably, there will be renewed emphasis on building resilient
and responsive health systems. Following the pandemic, eye health needs to be considered
as an essential part of health and associated health service packages. However, the
pandemic will probably lead to deterioration in the social determinants of eye health
for many, through increased poverty and reduced access to services in many countries.
Eye health cuts across multiple SDGs. The Decade of Action and delivery of SDGs, called
for by the 2019 UN General Assembly, presents a new opportunity to position eye health
equity as an integral part of the development agenda and to have it addressed by broader
development institutions. This action would enable the case to be made at national
level, to include eye care in economic and development plans, budgets and consolidate
its place within health plans for universal health coverage. To integrate vision in
the development agenda will require three major actions.
First, eye health needs to be clearly framed as a development issue, which would have
substantial and immediate benefits for prosperity and social progress. This Commission
shows that addressing vision impairment is a realistic and highly cost-effective way
of unlocking human potential, enabling children to gain an education and working-age
adults to get and keep a job, and improving equality for women and girls who are more
likely than men to have poor vision and less likely to receive treatment. These steps
are more likely to resonate with political leaders, donors, and international institutions.
Second, cross-sectoral partnerships need to be built, including economic development,
education, women's empowerment, business and transport, civil society, the technology,
and private sectors. These partnerships are already taking place in some regions but
will need to become much more widespread.
Third, different kinds of leadership skills and capabilities need to be developed.
The sector has produced many committed and effective leaders who excel at designing
and managing eye health programmes. However, achieving progress across the development
agenda will require leaving current approaches behind. A more innovative and adaptive
approach that engages broad networks of diverse stakeholders is required. Leaders
will need to be able to connect the whole system together.
Call to action
We call on the global community to consider the recommendations outlined in the Key
messages panel for urgent action. Vision is an enabling tool for sustainable development,
accelerating delivery of the SDGs. We have presented the benefits of vision for everyone
and supported these by evidence. Vision as an integral component of health has been
insufficiently represented in the targets of the SDGs but the Decade of Action, called
for by the 2019 UN General Assembly, presents an opportunity to reintegrate eye health
into developmental and economic plans. To achieve this transition, the sector must
build the right bridges, engage in new partnerships, and train new leaders skilled
in systems change, which will be a global challenge for the next decade.
Investing in universal eye health is a realistic, cost-effective way of unlocking
human potential by improving health and wellbeing, education, work, and the economy;
it is essential to achieving the SDGs.
Related collections
Most cited references329
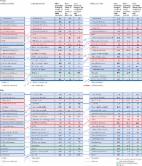
- Record: found
- Abstract: found
- Article: found
Global, regional, and national incidence, prevalence, and years lived with disability for 354 diseases and injuries for 195 countries and territories, 1990–2017: a systematic analysis for the Global Burden of Disease Study 2017
Spencer L James, Degu Abate, Kalkidan Hassen Abate … (2020)
- Record: found
- Abstract: found
- Article: not found
WITHDRAWN: Global and regional diabetes prevalence estimates for 2019 and projections for 2030 and 2045: results from the International Diabetes Federation Diabetes Atlas, 9th edition
Pouya Saeedi, Inga Petersohn, Paraskevi Salpea … (2019)
- Record: found
- Abstract: found
- Article: not found
Global prevalence of glaucoma and projections of glaucoma burden through 2040: a systematic review and meta-analysis.
Yih-Chung Tham, Xiang Li, Tien Wong … (2014)