78
views
0
recommends
+1 Recommend
1 collections
    0
    shares
      • Record: found
      • Abstract: found
      • Article: found
      Is Open Access

      COVID-19 Trends Among School-Aged Children — United States, March 1–September 19, 2020

      research-article

      Read this article at

      Bookmark
          There is no author summary for this article yet. Authors can add summaries to their articles on ScienceOpen to make them more accessible to a non-specialist audience.

          Abstract

          Approximately 56 million school-aged children (aged 5–17 years) resumed education in the United States in fall 2020.* Analysis of demographic characteristics, underlying conditions, clinical outcomes, and trends in weekly coronavirus disease 2019 (COVID-19) incidence during March 1–September 19, 2020 among 277,285 laboratory-confirmed cases in school-aged children in the United States might inform decisions about in-person learning and the timing and scaling of community mitigation measures. During May–September 2020, average weekly incidence (cases per 100,000 children) among adolescents aged 12–17 years (37.4) was approximately twice that of children aged 5–11 years (19.0). In addition, among school-aged children, COVID-19 indicators peaked during July 2020: weekly percentage of positive SARS-CoV-2 test results increased from 10% on May 31 to 14% on July 5; SARS-CoV-2 test volume increased from 100,081 tests on May 31 to 322,227 on July 12, and COVID-19 incidence increased from 13.8 per 100,000 on May 31 to 37.9 on July 19. During July and August, test volume and incidence decreased then plateaued; incidence decreased further during early September and might be increasing. Percentage of positive test results decreased during August and plateaued during September. Underlying conditions were more common among school-aged children with severe outcomes related to COVID-19: among school-aged children who were hospitalized, admitted to an intensive care unit (ICU), or who died, 16%, 27%, and 28%, respectively, had at least one underlying medical condition. Schools and communities can implement multiple, concurrent mitigation strategies and tailor communications to promote mitigation strategies to prevent COVID-19 spread. These results can provide a baseline for monitoring trends and evaluating mitigation strategies. School-aged children were stratified by age into two groups: children aged 5–11 years and adolescents aged 12–17 years. Confirmed COVID-19 cases were identified from individual-level case reports submitted by state health departments for the weeks beginning March 1–September 13, 2020. † Confirmed cases had a positive real-time reverse transcription–polymerase chain reaction (RT-PCR) test result for SARS-CoV-2, the virus that causes COVID-19. COVID-19 case data for all children were analyzed to examine demographic characteristics, underlying conditions, § hospitalization, ICU admission, and death. Trends were analyzed using CDC report date ¶ to calculate a daily 7-day moving average, aggregated by week. Analyses are descriptive; statistical comparisons were not performed. To examine trends in laboratory testing volume and percentage of positive test results, data from COVID-19 electronic laboratory data were used. SARS-CoV-2 RT-PCR test results were obtained for the weeks beginning May 31–September 13, 2020 from COVID-19 electronic laboratory reporting data submitted by state health departments (37 states); when age was unavailable in state-submitted data, information from data submitted directly by public health, commercial, and reference laboratories (13 states, Puerto Rico, and the District of Columbia) were used.** Data represent test results, not number of persons tested; specimen collection date or test order date was used for analysis. †† The weekly percentage of positive SARS-CoV-2 RT-PCR test results was calculated nationally for each U.S. Department of Health and Human Services (HHS) Region §§ as the number of positive test results divided by the sum of positive and negative test results. During March 1–September 19, 2020, a total of 277,285 laboratory-confirmed cases of COVID-19 in school-aged children were reported in the United States, including 101,503 (37%) in children aged 5–11 years and 175,782 (63%) in adolescents aged 12–17 years (Table). Overall, 50.8% were in females (aged 5–11 years = 49.4%; aged 12–17 = 51.6%). Among 161,387 (58%) school-aged children with COVID-19 and complete information on race/ethnicity, 42% were Hispanic/Latino (Hispanic), 32% were non-Hispanic White (White), and 17% were non-Hispanic Black (Black). Hispanic children accounted for 46% of cases among younger children and 39% among adolescents; White children accounted for 26% of cases in younger children and 36% in adolescents. ¶¶ Weekly incidence among school-aged children increased from March 1, peaking at 37.9 cases per 100,000 the week of July 19 (aged 5–11 years = 25.7; aged 12–17 years = 51.9), plateaued at an average of 34 per 100,000 during July 26–August 23, decreased to 22.6 per 100,000 the week of September 6, and rebounded to 26.3 per 100,000 the last week for which data are available (Figure 1) (Supplementary Figure 1, https://stacks.cdc.gov/view/cdc/94150). Trends in incidence were similar among both age groups. Incidence among adolescents was approximately double that among younger children throughout the reporting period. During May–September, average weekly incidence among adolescents was 37.4 cases per 100,000 compared with 19.0 per 100,000 for younger children. TABLE Demographic characteristics and underlying conditions among school-aged children aged 5–11 years and 12–17 years* with positive test results for SARS-CoV-2 (N = 233,474) — United States, March 1–September 19, 2020 Characteristic Age group, no. (%) All (N = 277,285) 5–11 yrs (n = 101,503) 12–17 yrs (n = 175,782) Sex† Female 140,755 (50.8) 50,096 (49.4) 90,659 (51.6) Male 136,530 (49.2) 51,407 (50.6) 85,123 (48.4) Median age, yrs 13 8 15 Symptom status Yes 161,751 (58.3) 56,917 (56.1) 104,834 (59.6) No 12,806 (4.6) 5,985 (5.9) 6,821 (3.9) Missing/Unknown 102,728 (37.0) 38,601 (38.0) 64,127 (36.5) Race/Ethnicity § Hispanic/Latino 67,275 (41.7) 27,539 (45.9) 39,736 (39.2) White, non-Hispanic 52,229 (32.4) 15,503 (25.8) 36,726 (36.2) Black, non-Hispanic 27,963 (17.3) 11,315 (18.8) 16,648 (16.4) A/PI, non-Hispanic 4,541 (2.8) 1,932 (3.2) 2,609 (2.6) AI/AN, non-Hispanic 3,044 (1.9) 1,342 (2.2) 1,702 (1.7) Multiracial/Other race 6,335 (3.9) 2,421 (4.0) 3,914 (3.9) Unknown ¶ 115,898 (N/A) 41,451 (N/A) 74,447 (N/A) Underlying condition Any 7,738 (2.8) 2,396(2.4) 5,342 (3.0) Chronic lung disease** 4,214 (54.5) 1,441 (60.1) 2,773 (51.9) Disability†† 714 (9.2) 251 (10.5) 463 (8.7) Immunosuppression 526 (6.8) 193 (8.1) 333 (6.2) Diabetes mellitus 476 (6.2) 88 (3.7) 388 (7.3) Psychological/Psychiatric 445 (5.8) 60 (2.5) 385 (7.2) Cardiovascular disease 363 (4.7) 128(5.3) 235 (4.4) Current/Former smoker§§ 334 (4.3) 11 (0.5) 323 (6.0) Severe obesity (BMI ≥40 kg/m2) 315 (4.1) 70 (2.9) 245 (4.6) Chronic kidney disease 116 (1.5) 47 (2.0) 69 (1.3) Hypertension 94 (1.2) 13 (0.5) 81 (1.5) Autoimmune 87 (1.1) 16 (0.7) 71 (1.3) Chronic liver disease 64 (0.8) 14 (0.6) 50 (0.9) Substance abuse/use 34 (0.4) 0 (0.0) 34 (0.6) Other¶¶ 1,326 (17.1) 419 (17.5) 907 (17.0) Outcome Hospitalized*** 3,240 (1.2) 1,021 (1.0) 2,219 (1.3) ICU admission††† 404 (0.1) 145 (0.1) 259 (0.1) Died§§§ 51 (<0.1) 20 (<0.1) 31 (<0.1) Abbreviations: A/PI = Asian/Pacific Islander; AI/AN = American Indian/Alaska Native; BMI = body mass index; COVID-19 = coronavirus disease 2019; ICU = intensive care unit.; N/A = not available. * Age was missing for 1.9% of all persons with positive test results; the proportion aged 5–17 years cannot be determined. † Among 281,116 persons aged 5–17 years with COVID-19, sex was missing, unknown, or other for 3,831 (1.4%). § Persons for whom ethnicity was missing (i.e., not reported as either “Hispanic” or “non-Hispanic”) were categorized has having missing race/ethnicity. ¶ Missing data were excluded from the denominator for calculating percentage of each racial/ethnic group. Missing rates did not differ by age group. Multiracial/other race includes persons reported as American Indian/Alaskan Native, Native Hawaiian or other Pacific Islander, multiracial, and persons of another race without further specification. ** Chronic lung disease includes asthma, emphysema, and chronic obstructive pulmonary disease (COPD). †† Disability includes neurologic and neurodevelopmental disorders (e.g., seizure disorders, autism spectrum disorders, and developmental delay), intellectual and physical disabilities, vision or hearing impairment, genetic disorders and inherited metabolic disorders, and blood disorders (e.g., sickle cell disease and hemophilia). §§ Checked the box on the case report form for either “current smoker” or “former smoker.” ¶¶ Other includes conditions not listed elsewhere, conditions with no specific autoimmune etiology, endocrine disorders other than diabetes (e.g., polycystic ovarian disease, hypothyroidism, and hyperthyroidism), gastrointestinal disorders (e.g., gastritis or gastroesophageal reflux), obstructive sleep apnea, allergies/atopy, anemia (etiology not specified), history of cancer in remission, and other conditions that did not fall under the specified categories. *** Hospitalization status. 5–11 years: missing/unknown = 44,300 (43.6%); 12–17 years: missing/unknown = 79,411 (45.2%). ††† ICU admission status. 5–11 years: missing/unknown = 90,405 (89.0%); 12–17 years: missing/unknown = 154,662 (88.0%). §§§ Mortality status. 5–11 years: missing/unknown = 47,006 (46.3%); 12–17 years: missing/unknown = 83,479 (47.5%). FIGURE 1 COVID-19 incidence* among school-aged children aged 5–11 years (N = 101,503) and 12–17 years (N = 175,782), by week — United States, March 1–September 19, 2020 † Sources: CDC COVID-19 case report form. https://wwwn.cdc.gov/nndss/covid-19-response.html. CDC National Notifiable Disease Surveillance System. https://wwwn.cdc.gov/nndss. Abbreviation: COVID-19 = coronavirus disease 2019. * Incidence = cases per 100,000, calculated using 2018 population from https://datacenter.kidscount.org/. † Data included through September 19, 2020, so that each week has a full 7 days of data. The figure is a line chart showing COVID-19 incidence among school-aged children aged 5–11 years (N = 101,503) and 12–17 years (N = 175,782), by week, in the United States, during March 1–September 19, 2020. 
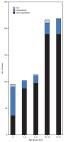
Weekly SARS-CoV-2 laboratory test volume among school-aged children more than tripled, from 100,081 tests performed during the week beginning May 31 to a peak of 322,227 during the week beginning July 12, then decreased to approximately 260,000 during August and rebounded in September; test volume was higher among adolescents than younger children (Figure 2) (Supplementary Figure 1, https://stacks.cdc.gov/view/cdc/94150) (Supplementary Figure 2, https://stacks.cdc.gov/view/cdc/94151). The percentage of positive SARS-CoV-2 laboratory test results increased for both age groups from May 31 and peaked during the week beginning July 5; percentage of positive test results then decreased among both age groups. Since August 23, the percentage of positive SARS-CoV-2 laboratory test results plateaued at 7% among adolescents and continued to decrease among younger children. FIGURE 2 Percentage of SARS-CoV-2 reverse transcription–polymerase chain reaction (RT-PCR) tests with positive results and test volume, by week for school-aged children aged 5–11 years and 12–17 years — United States, May 31–September 19, 2020* Abbreviation: COVID-19 = coronavirus disease 2019. * From COVID-19 electronic laboratory reporting data submitted by state health departments for 37 states and from data submitted directly by public health, commercial, and reference laboratories for 13 states, Puerto Rico, and the District of Columbia, using specimen collection or test order date. The data represent percentage of tests, not of individual persons, with a positive result and include RT-PCR tests but not antigen or point-of-care tests. The figure is a histogram, an epidemiologic curve showing the percentage of SARS-CoV-2 reverse transcription–polymerase chain reaction tests with positive results and test volume, by week for school-aged children aged 5–11 years and 12–17 years, in the United States, during May 31–September 19, 2020. HHS Regions 6, 4, and 9 had the highest weekly percentage of positive test results, peaking during the week of July 5 at 24% (Region 6), 18% (Region 4), and 17% (Region 9), and all declined to approximately 8% the week beginning September 13 (Supplementary Figure 2, https://stacks.cdc.gov/view/cdc/94151). In Region 1, weekly percentage of positive tests decreased from 8% during the week beginning May 31 to <2% during the week beginning September 13. In Region 9, the percentage of positive test results was similar over time in both age groups; in Regions 5 and 7, although the percentage of positive test results were initially similar in both age groups, beginning in early June (Region 7) and mid-June (Region 5), the percentage of positive test results in adolescents exceeded that among younger children. Among school-aged children with laboratory-confirmed COVID-19, 58% reported at least one symptom, 5% reported no symptoms, and information on symptoms was missing or unknown for 37% (Table). Overall, 3,240 (1.2%) school-aged children with COVID-19 were hospitalized, including 404 (0.1%) who required ICU admission. Fifty-one (<0.01%) school-aged children died of COVID-19. Among school-aged children with complete information on race/ethnicity who were hospitalized (2,473 [76%]) or admitted to an ICU (321 [80%]), Hispanic ethnicity was most commonly reported (45% and 43%, respectively), followed by Black (24% and 28%, respectively) and White (22% and 17%, respectively) races. Among school-aged children with COVID-19, at least one underlying condition was reported for 7,738 (3%), including approximately 3% of adolescents and 2% of younger children. Among those with an underlying condition, chronic lung disease, including asthma, was most commonly reported (55%), followed by disability*** (9%), immunosuppressive conditions (7%), diabetes (6%), psychological conditions (6%), cardiovascular disease (5%), and severe obesity (4%). At least one underlying condition was reported for 16% of school-aged children who were hospitalized for COVID-19, 27% of those admitted to an ICU, and 28% of those who died. Discussion As education resumes and some schools begin in-person learning for the 2020–21 academic year, it is critical to have a baseline for monitoring trends in COVID-19 infection among school-aged children. Since March, a period during which most U.S. schools conducted classes virtually or were closed for the summer, the incidence among adolescents was approximately double that in younger children. Although mortality and hospitalization in school-aged children was low, Hispanic ethnicity, Black race, and underlying conditions were more commonly reported among children who were hospitalized or admitted to an ICU, providing additional evidence that some children might be at increased risk for severe illness associated with COVID-19 ( 1 – 4 ). ††† Acute COVID-19 and multisystem inflammatory syndrome in children (MIS-C) have been reported to disproportionately affect Hispanic and Black children ( 3 , 4 ). Implementing multiple, concurrent mitigation strategies and tailored communications about the importance of promoting and reinforcing behaviors that reduce spread of COVID-19 (e.g., wearing masks, maintaining a social distance of ≥6 feet, and frequent handwashing) can reduce COVID-19 spread in schools and communities. Monitoring trends in multiple indicators of COVID-19 could inform mitigation measures to prevent COVID-19 spread. §§§ COVID-19 incidence increased from March to July, and SARS-CoV-2 test volume and weekly percentage of positive test results among school-aged children increased from late May to July. During March through May, widespread shelter-in-place orders were in effect, and most U.S. schools transitioned to online learning. In June and July, when community mitigation measures were relaxed in some areas, incidence increased more rapidly. Recent evidence that monthly COVID-19 incidence increased approximately threefold among persons aged 0–19 years since May and was highest among young adults aged 20–29 years during July, suggests that young persons might be playing an increasingly important role in community transmission ( 5 , 6 ). The percentage of positive test results in school-aged children also varied within and across HHS regions. Variations in percentage of positive tests might indicate differences in community transmission rates. School studies suggest that in-person learning can be safe in communities with low SARS-CoV-2 transmission rates ¶¶¶ ( 7 ) but might increase transmission risk in communities where transmission is already high.**** The findings in this report are subject to at least four limitations. First, these data might underestimate the actual incidence of disease among school-aged children, because testing was frequently prioritized for persons with symptoms, and asymptomatic infection in children is common ( 8 ). These data are also from a single reporting system and therefore might not represent the total number of cases and deaths in school-aged children reported in the United States ( 1 ). Second, findings on race/ethnicity, symptom status, underlying conditions, and outcomes should be interpreted with caution; these data had high rates of missing or unknown values. Third, because of delays in reporting, trend data might lag behind actual disease transmission dates. Because of missing symptom onset and specimen collection dates, COVID-19 cases are presented by the date each case was reported to CDC, and surveillance artifacts can exist as a result of batch reporting by states. †††† Finally, laboratory data presented here underrepresent the volume of laboratory tests reported in some states, because state reporting of laboratory data and case surveillance is not uniform. §§§§ These findings can provide a baseline for monitoring national trends. Monitoring at the local-level could inform decision-makers about which mitigation strategies are most effective in preventing the spread of COVID-19 in schools and communities ( 6 , 9 ). CDC’s considerations for schools outline important mitigation strategies for safer reopening for in-person learning. ¶¶¶¶ Schools and communities should implement multiple concurrent preventive strategies and adjust mitigation depending on local levels of transmission to reduce COVID-19 disease risk for students, teachers, school staff members, families and the community. Summary What is already known about this topic? Children aged <10 years can transmit SARS-CoV-2 in school settings, but less is known about COVID-19 incidence, characteristics, and health outcomes among school-aged children (aged 5–17 years) with COVID-19. What is added by this report? Since March, 277,285 COVID-19 cases in children have been reported. COVID-19 incidence among adolescents aged 12–17 years was approximately twice that in children aged 5–11 years. Underlying conditions were more common among school-aged children with severe outcomes related to COVID-19. Weekly incidence, SARS-CoV-2 test volume, and percentage of tests positive among school-aged children varied over time and by region of the United States. What are the implications for public health practice? It is important for schools and communities to monitor multiple indicators of COVID-19 among school-aged children and layer prevention strategies to reduce COVID-19 disease risk for students, teachers, school staff, and families. These results can provide a baseline for monitoring trends and evaluating mitigation strategies.

          Related collections

          Most cited references9

          • Record: found
          • Abstract: found
          • Article: found
          Is Open Access

          Coronavirus Disease 2019 in Children — United States, February 12–April 2, 2020

          On April 6, 2020, this report was posted online as an MMWR Early Release. As of April 2, 2020, the coronavirus disease 2019 (COVID-19) pandemic has resulted in >890,000 cases and >45,000 deaths worldwide, including 239,279 cases and 5,443 deaths in the United States ( 1 , 2 ). In the United States, 22% of the population is made up of infants, children, and adolescents aged * Includes infants, children, and adolescents. † Excludes 23 cases in children aged <18 years with missing report date. § Date of report available starting February 24, 2020; reported cases include any with onset on or after February 12, 2020. The figure is a combination epidemiological curve and line graph showing 2,549 cases of COVID-19 in children aged <18 years in the United States, by date reported to CDC during February 24–April 2, 2020. Among all 2,572 COVID-19 cases in children aged <18 years, the median age was 11 years (range 0–17 years). Nearly one third of reported pediatric cases (813; 32%) occurred in children aged 15–17 years, followed by those in children aged 10–14 years (682; 27%). Among younger children, 398 (15%) occurred in children aged <1 year, 291 (11%) in children aged 1–4 years, and 388 (15%) in children aged 5–9 years. Among 2,490 pediatric COVID-19 cases for which sex was known, 1,408 (57%) occurred in males; among cases in adults aged ≥18 years for which sex was known, 53% (75,450 of 143,414) were in males. Among 184 (7.2%) cases in children aged <18 years with known exposure information, 16 (9%) were associated with travel and 168 (91%) had exposure to a COVID-19 patient in the household or community. Data on signs and symptoms of COVID-19 were available for 291 of 2,572 (11%) pediatric cases and 10,944 of 113,985 (9.6%) cases among adults aged 18–64 years (Table). Whereas fever (subjective or documented), cough, and shortness of breath were commonly reported among adult patients aged 18–64 years (93% reported at least one of these), these signs and symptoms were less frequently reported among pediatric patients (73%). Among those with known information on each symptom, 56% of pediatric patients reported fever, 54% reported cough, and 13% reported shortness of breath, compared with 71%, 80%, and 43%, respectively, reporting these signs and symptoms among patients aged 18–64 years. Myalgia, sore throat, headache, and diarrhea were also less commonly reported by pediatric patients. Fifty-three (68%) of the 78 pediatric cases reported not to have fever, cough, or shortness of breath had no symptoms reported, but could not be classified as asymptomatic because of incomplete symptom information. One (1.3%) additional pediatric patient with a positive test result for SARS-CoV-2 was reported to be asymptomatic. TABLE Signs and symptoms among 291 pediatric (age <18 years) and 10,944 adult (age 18–64 years) patients* with laboratory-confirmed COVID-19 — United States, February 12–April 2, 2020 Sign/Symptom No. (%) with sign/symptom Pediatric Adult Fever, cough, or shortness of breath† 213 (73) 10,167 (93) Fever§ 163 (56) 7,794 (71) Cough 158 (54) 8,775 (80) Shortness of breath 39 (13) 4,674 (43) Myalgia 66 (23) 6,713 (61) Runny nose¶ 21 (7.2) 757 (6.9) Sore throat 71 (24) 3,795 (35) Headache 81 (28) 6,335 (58) Nausea/Vomiting 31 (11) 1,746 (16) Abdominal pain¶ 17 (5.8) 1,329 (12) Diarrhea 37 (13) 3,353 (31) *Cases were included in the denominator if they had a known symptom status for fever, cough, shortness of breath, nausea/vomiting, and diarrhea. Total number of patients by age group: <18 years (N = 2,572), 18–64 years (N = 113,985). † Includes all cases with one or more of these symptoms. § Patients were included if they had information for either measured or subjective fever variables and were considered to have a fever if “yes” was indicated for either variable. ¶ Runny nose and abdominal pain were less frequently completed than other symptoms; therefore, percentages with these symptoms are likely underestimates. Information on hospitalization status was available for 745 (29%) cases in children aged <18 years and 35,061 (31%) cases in adults aged 18–64 years. Among children with COVID-19, 147 (estimated range = 5.7%–20%) were reported to be hospitalized, with 15 (0.58%–2.0%) admitted to an ICU (Figure 2). Among adults aged 18–64 years, the percentages of patients who were hospitalized (10%–33%), including those admitted to an ICU (1.4%–4.5%), were higher. Children aged <1 year accounted for the highest percentage (15%–62%) of hospitalization among pediatric patients with COVID-19. Among 95 children aged <1 year with known hospitalization status, 59 (62%) were hospitalized, including five who were admitted to an ICU. The percentage of patients hospitalized among those aged 1–17 years was lower (estimated range = 4.1%–14%), with little variation among age groups (Figure 2). FIGURE 2 COVID-19 cases among children* aged <18 years, among those with known hospitalization status (N = 745),† by age group and hospitalization status — United States, February 12–April 2, 2020 Abbreviation: ICU = intensive care unit. * Includes infants, children, and adolescents. † Number of children missing hospitalization status by age group: <1 year (303 of 398; 76%); 1–4 years (189 of 291; 65%); 5–9 years (275 of 388; 71%); 10–14 years (466 of 682; 68%); 15–17 years (594 of 813; 73%). The figure is a bar chart showing 745 U.S. COVID-19 cases among children aged <18 years with known hospitalization status, by age group and hospitalization status during February 12–April 2, 2020. Among 345 pediatric cases with information on underlying conditions, 80 (23%) had at least one underlying condition. The most common underlying conditions were chronic lung disease (including asthma) (40), cardiovascular disease (25), and immunosuppression (10). Among the 295 pediatric cases for which information on both hospitalization status and underlying medical conditions was available, 28 of 37 (77%) hospitalized patients, including all six patients admitted to an ICU, had one or more underlying medical condition; among 258 patients who were not hospitalized, 30 (12%) patients had underlying conditions. Three deaths were reported among the pediatric cases included in this analysis; however, review of these cases is ongoing to confirm COVID-19 as the likely cause of death. Discussion Among 149,082 U.S. cases of COVID-19 reported as of April 2, 2020, for which age was known, 2,572 (1.7%) occurred in patients aged <18 years. In comparison, persons aged <18 years account for 22% of the U.S. population ( 3 ). Although infants <1 year accounted for 15% of pediatric COVID-19 cases, they remain underrepresented among COVID-19 cases in patients of all ages (393 of 149,082; 0.27%) compared with the percentage of the U.S. population aged <1 year (1.2%) ( 3 ). Relatively few pediatric COVID-19 cases were hospitalized (5.7%–20%; including 0.58%–2.0% admitted to an ICU), consistent with previous reports that COVID-19 illness often might have a mild course among younger patients ( 4 , 5 ). Hospitalization was most common among pediatric patients aged <1 year and those with underlying conditions. In addition, 73% of children for whom symptom information was known reported the characteristic COVID-19 signs and symptoms of fever, cough, or shortness of breath. These findings are largely consistent with a report on pediatric COVID-19 patients aged <16 years in China, which found that only 41.5% of pediatric patients had fever, 48.5% had cough, and 1.8% were admitted to an ICU ( 4 ). A second report suggested that although pediatric COVID-19 patients infrequently have severe outcomes, the infection might be more severe among infants ( 5 ). In the current analysis, 59 of 147 pediatric hospitalizations, including five of 15 pediatric ICU admissions, were among children aged <1 year; however, most reported U.S. cases in infants had unknown hospitalization status. In this preliminary analysis of U.S. pediatric COVID-19 cases, a majority (57%) of patients were males. Several studies have reported a majority of COVID-19 cases among males ( 4 , 9 ), and an analysis of 44,000 COVID-19 cases in patients of all ages in China reported a higher case-fatality rate among men than among women ( 10 ). However, the same report, as well as a separate analysis of 2,143 pediatric COVID-19 cases from China, detected no substantial difference in the number of cases among males and females ( 5 , 10 ). Reasons for any potential difference in COVID-19 incidence or severity between males and females are unknown. In the present analysis, the predominance of males in all pediatric age groups, including patients aged <1 year, suggests that biologic factors might play a role in any differences in COVID-19 susceptibility by sex. The findings in this report are subject to at least four limitations. First, because of the high workload associated with COVID-19 response activities on local, state, and territorial public health personnel, a majority of pediatric cases were missing data on disease symptoms, severity, or underlying conditions. Data for many variables are unlikely to be missing at random, and as such, these results must be interpreted with caution. Because of the high percentage of missing data, statistical comparisons could not be conducted. Second, because many cases occurred only days before publication of this report, the outcome for many patients is unknown, and this analysis might underestimate severity of disease or symptoms that manifested later in the course of illness. Third, COVID-19 testing practices differ across jurisdictions and might also differ across age groups. In many areas, prioritization of testing for severely ill patients likely occurs, which would result in overestimation of the percentage of patients with COVID-19 infection who are hospitalized (including those treated in an ICU) among all age groups. Finally, this analysis compares clinical characteristics of pediatric cases (persons aged <18 years) with those of cases among adults aged 18–64 years. Severe COVID-19 disease appears to be more common among adults at the high end of this age range ( 6 ), and therefore cases in young adults might be more similar to those among children than suggested by the current analysis. As the number of COVID-19 cases continues to increase in many parts of the United States, it will be important to adapt COVID-19 surveillance strategies to maintain collection of critical case information without overburdening jurisdiction health departments. National surveillance will increasingly be complemented by focused surveillance systems collecting comprehensive case information on a subset of cases across various health care settings. These systems will provide detailed information on the evolving COVID-19 incidence and risk factors for infection and severe disease. More systematic and detailed collection of underlying condition data among pediatric patients would be helpful to understand which children might be at highest risk for severe COVID-19 illness. This preliminary examination of characteristics of COVID-19 disease among children in the United States suggests that children do not always have fever or cough as reported signs and symptoms. Although most cases reported among children to date have not been severe, clinicians should maintain a high index of suspicion for COVID-19 infection in children and monitor for progression of illness, particularly among infants and children with underlying conditions. However, these findings must be interpreted with caution because of the high percentage of cases missing data on important characteristics. Because persons with asymptomatic and mild disease, including children, are likely playing a role in transmission and spread of COVID-19 in the community, social distancing and everyday preventive behaviors are recommended for persons of all ages to slow the spread of the virus, protect the health care system from being overloaded, and protect older adults and persons of any age with serious underlying medical conditions. Recommendations for reducing the spread of COVID-19 by staying at home and practicing strategies such as respiratory hygiene, wearing cloth face coverings when around others, and others are available on CDC’s coronavirus website at https://www.cdc.gov/coronavirus/2019-ncov/prevent-getting-sick/prevention.html. Summary What is already known about this topic? Data from China suggest that pediatric coronavirus disease 2019 (COVID-19) cases might be less severe than cases in adults and that children (persons aged <18 years) might experience different symptoms than adults. What is added by this report? In this preliminary description of pediatric U.S. COVID-19 cases, relatively few children with COVID-19 are hospitalized, and fewer children than adults experience fever, cough, or shortness of breath. Severe outcomes have been reported in children, including three deaths. What are the implications for public health practice? Pediatric COVID-19 patients might not have fever or cough. Social distancing and everyday preventive behaviors remain important for all age groups because patients with less serious illness and those without symptoms likely play an important role in disease transmission.
            Bookmark
            • Record: found
            • Abstract: found
            • Article: found
            Is Open Access

            Coronavirus Disease 2019 Case Surveillance — United States, January 22–May 30, 2020

            The coronavirus disease 2019 (COVID-19) pandemic resulted in 5,817,385 reported cases and 362,705 deaths worldwide through May, 30, 2020, † including 1,761,503 aggregated reported cases and 103,700 deaths in the United States. § Previous analyses during February–early April 2020 indicated that age ≥65 years and underlying health conditions were associated with a higher risk for severe outcomes, which were less common among children aged 10% of persons in this age group. TABLE 2 Reported underlying health conditions* and symptoms † among persons with laboratory-confirmed COVID-19, by sex and age group — United States, January 22–May 30, 2020 Characteristic No. (%) Total Sex Age group (yrs) Male Female ≤9 10–19 20–29 30–39 40–49 50–59 60–69 70–79 ≥80 Total population 1,320,488 646,358 674,130 20,458 49,245 182,469 214,849 219,139 235,774 179,007 105,252 114,295 Underlying health condition§ Known underlying medical condition status* 287,320 (21.8) 138,887 (21.5) 148,433 (22.0) 2,896 (14.2) 7,123 (14.5) 27,436 (15.0) 33,483 (15.6) 40,572 (18.5) 54,717 (23.2) 50,125 (28.0) 34,400 (32.7) 36,568 (32.0) Any cardiovascular disease¶ 92,546 (32.2) 47,567 (34.2) 44,979 (30.3) 78 (2.7) 164 (2.3) 1,177 (4.3) 3,588 (10.7) 8,198 (20.2) 16,954 (31.0) 21,466 (42.8) 18,763 (54.5) 22,158 (60.6) Any chronic lung disease 50,148 (17.5) 20,930 (15.1) 29,218 (19.7) 363 (12.5) 1,285 (18) 4,537 (16.5) 5,110 (15.3) 6,127 (15.1) 8,722 (15.9) 9,200 (18.4) 7,436 (21.6) 7,368 (20.1) Renal disease 21,908 (7.6) 12,144 (8.7) 9,764 (6.6) 21 (0.7) 34 (0.5) 204 (0.7) 587 (1.8) 1,273 (3.1) 2,789 (5.1) 4,764 (9.5) 5,401 (15.7) 6,835 (18.7) Diabetes 86,737 (30.2) 45,089 (32.5) 41,648 (28.1) 12 (0.4) 225 (3.2) 1,409 (5.1) 4,106 (12.3) 9,636 (23.8) 19,589 (35.8) 22,314 (44.5) 16,594 (48.2) 12,852 (35.1) Liver disease 3,953 (1.4) 2,439 (1.8) 1,514 (1.0) 5 (0.2) 19 (0.3) 132 (0.5) 390 (1.2) 573 (1.4) 878 (1.6) 1,074 (2.1) 583 (1.7) 299 (0.8) Immunocompromised 15,265 (5.3) 7,345 (5.3) 7,920 (5.3) 61 (2.1) 146 (2.0) 646 (2.4) 1,253 (3.7) 2,005 (4.9) 3,190 (5.8) 3,421 (6.8) 2,486 (7.2) 2,057 (5.6) Neurologic/Neurodevelopmental disability 13,665 (4.8) 6,193 (4.5) 7,472 (5.0) 41 (1.4) 113 (1.6) 395 (1.4) 533 (1.6) 734 (1.8) 1,338 (2.4) 2,006 (4.0) 2,759 (8.0) 5,746 (15.7) Symptom§ Known symptom status† 373,883 (28.3) 178,223 (27.6) 195,660 (29.0) 5,188 (25.4) 12,689 (25.8) 51,464 (28.2) 59,951 (27.9) 62,643 (28.6) 70,040 (29.7) 52,178 (29.1) 28,583 (27.2) 31,147 (27.3) Fever, cough, or shortness of breath 260,706 (69.7) 125,768 (70.6) 134,938 (69.0) 3,278 (63.2) 7,584 (59.8) 35,072 (68.1) 42,016 (70.1) 45,361 (72.4) 51,283 (73.2) 37,701 (72.3) 19,583 (68.5) 18,828 (60.4) Fever †† 161,071 (43.1) 80,578 (45.2) 80,493 (41.1) 2,404 (46.3) 4,443 (35.0) 20,381 (39.6) 25,887 (43.2) 28,407 (45.3) 32,375 (46.2) 23,591 (45.2) 12,190 (42.6) 11,393 (36.6) Cough 187,953 (50.3) 89,178 (50.0) 98,775 (50.5) 1,912 (36.9) 5,257 (41.4) 26,284 (51.1) 31,313 (52.2) 34,031 (54.3) 38,305 (54.7) 27,150 (52.0) 12,837 (44.9) 10,864 (34.9) Shortness of breath 106,387 (28.5) 49,834 (28.0) 56,553 (28.9) 339 (6.5) 2,070 (16.3) 13,649 (26.5) 16,851 (28.1) 18,978 (30.3) 21,327 (30.4) 16,018 (30.7) 8,971 (31.4) 8,184 (26.3) Myalgia 135,026 (36.1) 61,922 (34.7) 73,104 (37.4) 537 (10.4) 3,737 (29.5) 21,153 (41.1) 26,464 (44.1) 28,064 (44.8) 28,594 (40.8) 17,360 (33.3) 6,015 (21.0) 3,102 (10.0) Runny nose 22,710 (6.1) 9,900 (5.6) 12,810 (6.5) 354 (6.8) 1,025 (8.1) 4,591 (8.9) 4,406 (7.3) 4,141 (6.6) 4,100 (5.9) 2,671 (5.1) 923 (3.2) 499 (1.6) Sore throat 74,840 (20.0) 31,244 (17.5) 43,596 (22.3) 664 (12.8) 3,628 (28.6) 14,493 (28.2) 14,855 (24.8) 14,490 (23.1) 13,930 (19.9) 8,192 (15.7) 2,867 (10.0) 1,721 (5.5) Headache 128,560 (34.4) 54,721 (30.7) 73,839 (37.7) 785 (15.1) 5,315 (41.9) 23,723 (46.1) 26,142 (43.6) 26,245 (41.9) 26,057 (37.2) 14,735 (28.2) 4,163 (14.6) 1,395 (4.5) Nausea/Vomiting 42,813 (11.5) 16,549 (9.3) 26,264 (13.4) 506 (9.8) 1,314 (10.4) 6,648 (12.9) 7,661 (12.8) 8,091 (12.9) 8,737 (12.5) 5,953 (11.4) 2,380 (8.3) 1,523 (4.9) Abdominal pain 28,443 (7.6) 11,553 (6.5) 16,890 (8.6) 349 (6.7) 978 (7.7) 4,211 (8.2) 5,150 (8.6) 5,531 (8.8) 6,134 (8.8) 3,809 (7.3) 1,449 (5.1) 832 (2.7) Diarrhea 72,039 (19.3) 32,093 (18.0) 39,946 (20.4) 704 (13.6) 1,712 (13.5) 9,867 (19.2) 12,769 (21.3) 13,958 (22.3) 15,536 (22.2) 10,349 (19.8) 4,402 (15.4) 2,742 (8.8) Loss of smell or taste 31,191 (8.3) 12,717 (7.1) 18,474 (9.4) 67 (1.3) 1,257 (9.9) 6,828 (13.3) 6,907 (11.5) 6,361 (10.2) 5,828 (8.3) 2,930 (5.6) 775 (2.7) 238 (0.8) Abbreviation: COVID-19 = coronavirus disease 2019. * Status of underlying health conditions known for 287,320 persons. Status was classified as “known” if any of the following conditions were reported as present or absent: diabetes mellitus, cardiovascular disease (including hypertension), severe obesity (body mass index ≥40 kg/m2), chronic renal disease, chronic liver disease, chronic lung disease, immunocompromising condition, autoimmune condition, neurologic condition (including neurodevelopmental, intellectual, physical, visual, or hearing impairment), psychologic/psychiatric condition, and other underlying medical condition not otherwise specified. † Symptom status was known for 373,883 persons. Status was classified as “known” if any of the following symptoms were reported as present or absent: fever (measured >100.4°F [38°C] or subjective), cough, shortness of breath, wheezing, difficulty breathing, chills, rigors, myalgia, rhinorrhea, sore throat, chest pain, nausea or vomiting, abdominal pain, headache, fatigue, diarrhea (≥3 loose stools in a 24-hour period), or other symptom not otherwise specified on the form. § Responses include data from standardized fields supplemented with data from free-text fields. Information for persons with loss of smell or taste was exclusively extracted from a free-text field; therefore, persons exhibiting this symptom were likely underreported. ¶ Includes persons with reported hypertension. ** Includes all persons with at least one of these symptoms reported. †† Persons were considered to have a fever if information on either measured or subjective fever variables if “yes” was reported for either variable. Among 287,320 (22%) cases with data on individual underlying health conditions, those most frequently reported were cardiovascular disease (32%), diabetes (30%), and chronic lung disease (18%) (Table 2); the reported proportions were similar among males and females. The frequency of conditions reported varied by age group: cardiovascular disease was uncommon among those aged ≤39 years but was reported in approximately half of the cases among persons aged ≥70 years. Among 63,896 females aged 15–44 years with known pregnancy status, 6,708 (11%) were reported to be pregnant. Among the 1,320,488 cases, outcomes for hospitalization, ICU admission, and death were available for 46%, 14%, and 36%, respectively. Overall, 184,673 (14%) patients were hospitalized, including 29,837 (2%) admitted to the ICU; 71,116 (5%) patients died (Table 3). Severe outcomes were more commonly reported for patients with reported underlying conditions. Hospitalizations were six times higher among patients with a reported underlying condition than those without reported underlying conditions (45.4% versus 7.6%). Deaths were 12 times higher among patients with reported underlying conditions compared with those without reported underlying conditions (19.5% versus 1.6%). The percentages of males who were hospitalized (16%), admitted to the ICU (3%), and who died (6%) were higher than were those for females (12%, 2%, and 5%, respectively). The percentage of ICU admissions was highest among persons with reported underlying conditions aged 60–69 years (11%) and 70–79 years (12%). Death was most commonly reported among persons aged ≥80 years regardless of the presence of underlying conditions (with underlying conditions 50%; without 30%). TABLE 3 Reported hospitalizations,* , † intensive care unit (ICU) admissions, § and deaths ¶ among laboratory-confirmed COVID-19 patients with and without reported underlying health conditions, ** by sex and age — United States, January 22–May 30, 2020 Characteristic (no.) Outcome, no./total no. (%)†† Reported hospitalizations*,† (including ICU) Reported ICU admission§ Reported deaths¶ Among all patients Among patients with reported underlying health conditions Among patients with no reported underlying health conditions Among all patients Among patients with reported underlying health conditions Among patients with no reported underlying health conditions Among all patients Among patients with reported underlying health conditions Among patients with no reported underlying health conditions Sex Male (646,358) 101,133/646,358 (15.6) 49,503/96,839 (51.1) 3,596/42,048 (8.6) 18,394/646,358 (2.8) 10,302/96,839 (10.6) 864/42,048 (2.1) 38,773/646,358 (6.0) 21,667/96,839 (22.4) 724/42,048 (1.7) Female (674,130) 83,540/674,130 (12.4) 40,698/102,040 (39.9) 3,087/46,393 (6.7) 11,443/674,130 (1.7) 6,672/102,040 (6.5) 479/46,393 (1.0) 32,343/674,130 (4.8) 17,145/102,040 (16.8) 707/46,393 (1.5) Age group (yrs) ≤9 (20,458) 848/20,458 (4.1) 138/619 (22.3) 84/2,277 (3.7) 141/20,458 (0.7) 31/619 (5.0) 16/2,277 (0.7) 13/20,458 (0.1) 4/619 (0.6) 2/2,277 (0.1) 10–19 (49,245) 1,234/49,245 (2.5) 309/2,076 (14.9) 115/5,047 (2.3) 216/49,245 (0.4) 72/2,076 (3.5) 17/5,047 (0.3) 33/49,245 (0.1) 16/2,076 (0.8) 4/5,047 (0.1) 20–29 (182,469) 6,704/182,469 (3.7) 1,559/8,906 (17.5) 498/18,530 (2.7) 864/182,469 (0.5) 300/8,906 (3.4) 56/18,530 (0.3) 273/182,469 (0.1) 122/8,906 (1.4) 24/18,530 (0.1) 30–39 (214,849) 12,570/214,849 (5.9) 3,596/14,854 (24.2) 828/18,629 (4.4) 1,879/214,849 (0.9) 787/14,854 (5.3) 135/18,629 (0.7) 852/214,849 (0.4) 411/14,854 (2.8) 21/18,629 (0.1) 40–49 (219,139) 19,318/219,139 (8.8) 7,151/24,161 (29.6) 1,057/16,411 (6.4) 3,316/219,139 (1.5) 1,540/24,161 (6.4) 208/16,411 (1.3) 2,083/219,139 (1.0) 1,077/24,161 (4.5) 58/16,411 (0.4) 50–59 (235,774) 31,588/235,774 (13.4) 14,639/40,297 (36.3) 1,380/14,420 (9.6) 5,986/235,774 (2.5) 3,335/40,297 (8.3) 296/14,420 (2.1) 5,639/235,774 (2.4) 3,158/40,297 (7.8) 131/14,420 (0.9) 60–69 (179,007) 39,422/179,007 (22.0) 21,064/42,206 (49.9) 1,216/7,919 (15.4) 7,403/179,007 (4.1) 4,588/42,206 (10.9) 291/7,919 (3.7) 11,947/179,007 (6.7) 7,050/42,206 (16.7) 187/7,919 (2.4) 70–79 (105,252) 35,844/105,252 (34.1) 20,451/31,601 (64.7) 780/2,799 (27.9) 5,939/105,252 (5.6) 3,771/31,601 (11.9) 199/2,799 (7.1) 17,510/105,252 (16.6) 10,008/31,601 (31.7) 286/2,799 (10.2) ≥80 (114,295) 37,145/114,295 (32.5) 21,294/34,159 (62.3) 725/2,409 (30.1) 4,093/114,295 (3.6) 2,550/34,159 (7.5) 125/2,409 (5.2) 32,766/114,295 (28.7) 16,966/34,159 (49.7) 718/2,409 (29.8) Total (1,320,488) 184,673/1,320,488 (14.0) 90,201/198,879 (45.4) 6,683/88,441 (7.6) 29,837/1,320,488 (2.3) 16,974/198,879 (8.5) 1,343/88,441 (1.5) 71,116/1,320,488 (5.4) 38,812/198,879 (19.5) 1,431/88,441 (1.6) Abbreviation: COVID-19 = coronavirus disease 2019. * Hospitalization status was known for 600,860 (46%). Among 184,673 hospitalized patients, the presence of underlying health conditions was known for 96,884 (53%). † Includes reported ICU admissions. § ICU admission status was known for 186,563 (14%) patients among the total case population, representing 34% of hospitalized patients. Among 29,837 patients admitted to the ICU, the status of underlying health conditions was known for 18,317 (61%). ¶ Death outcomes were known for 480,565 (36%) patients. Among 71,116 reported deaths through case surveillance, the status of underlying health conditions was known for 40,243 (57%) patients. ** Status of underlying health conditions was known for 287,320 (22%) patients. Status was classified as “known” if any of the following conditions were noted as present or absent: diabetes mellitus, cardiovascular disease including hypertension, severe obesity body mass index ≥40 kg/m2, chronic renal disease, chronic liver disease, chronic lung disease, any immunocompromising condition, any autoimmune condition, any neurologic condition including neurodevelopmental, intellectual, physical, visual, or hearing impairment, any psychologic/psychiatric condition, and any other underlying medical condition not otherwise specified. †† Outcomes were calculated as the proportion of persons reported to be hospitalized, admitted to an ICU, or who died among total in the demographic group. Outcome underreporting could result from outcomes that occurred but were not reported through national case surveillance or through clinical progression to severe outcomes that occurred after time of report. Discussion As of May 30, a total of 1,761,503 aggregate U.S. cases of COVID-19 and 103,700 associated deaths were reported to CDC. Although average daily reported cases and deaths are declining, 7-day moving averages of daily incidence of COVID-19 cases indicate ongoing community transmission. ¶¶¶¶ The COVID-19 case data summarized here are essential statistics for the pandemic response and rely on information systems developed at the local, state, and federal level over decades for communicable disease surveillance that were rapidly adapted to meet an enormous, new public health threat. CDC aggregate counts are consistent with those presented through the Johns Hopkins University (JHU) Coronavirus Resource Center, which reported a cumulative total of 1,770,165 U.S. cases and 103,776 U.S. deaths on May 30, 2020.***** Differences in aggregate counts between CDC and JHU might be attributable to differences in reporting practices to CDC and jurisdictional websites accessed by JHU. Reported cumulative incidence in the case surveillance population among persons aged ≥20 years is notably higher than that among younger persons. The lower incidence in persons aged ≤19 years could be attributable to undiagnosed milder or asymptomatic illnesses among this age group that were not reported. Incidence in persons aged ≥80 years was nearly double that in persons aged 70–79 years. Among cases with known race and ethnicity, 33% of persons were Hispanic, 22% were black, and 1.3% were AI/AN. These findings suggest that persons in these groups, who account for 18%, 13%, and 0.7% of the U.S. population, respectively, are disproportionately affected by the COVID-19 pandemic. The proportion of missing race and ethnicity data limits the conclusions that can be drawn from descriptive analyses; however, these findings are consistent with an analysis of COVID-19–Associated Hospitalization Surveillance Network (COVID-NET) ††††† data that found higher proportions of black and Hispanic persons among hospitalized COVID-19 patients than were in the overall population ( 4 ). The completeness of race and ethnicity variables in case surveillance has increased from 20% to >40% from April 2 to June 2. Although reporting of race and ethnicity continues to improve, more complete data might be available in aggregate on jurisdictional websites or through sources like the COVID Tracking Project’s COVID Racial Data Tracker. §§§§§ The data in this report show that the prevalence of reported symptoms varied by age group but was similar among males and females. Fewer than 5% of persons were reported to be asymptomatic when symptom data were submitted. Persons without symptoms might be less likely to be tested for COVID-19 because initial guidance recommended testing of only symptomatic persons and was hospital-based. Guidance on testing has evolved throughout the response. ¶¶¶¶¶ Whereas incidence among males and females was similar overall, severe outcomes were more commonly reported among males. Prevalence of reported severe outcomes increased with age; the percentages of hospitalizations, ICU admissions, and deaths were highest among persons aged ≥70 years, regardless of underlying conditions, and lowest among those aged ≤19 years. Hospitalizations were six times higher and deaths 12 times higher among those with reported underlying conditions compared with those with none reported. These findings are consistent with previous reports that found that severe outcomes increased with age and underlying condition, and males were hospitalized at a higher rate than were females ( 2 , 4 , 5 ). The findings in this report are subject to at least three limitations. First, case surveillance data represent a subset of the total cases of COVID-19 in the United States; not every case in the community is captured through testing and information collected might be limited if persons are unavailable or unwilling to participate in case investigations or if medical records are unavailable for data extraction. Reported cumulative incidence, although comparable across age and sex groups within the case surveillance population, are underestimates of the U.S. cumulative incidence of COVID-19. Second, reported frequencies of individual symptoms and underlying health conditions presented from case surveillance likely underestimate the true prevalence because of missing data. Finally, asymptomatic cases are not captured well in case surveillance. Asymptomatic persons are unlikely to seek testing unless they are identified through active screening (e.g., contact tracing), and, because of limitations in testing capacity and in accordance with guidance, investigation of symptomatic persons is prioritized. Increased identification and reporting of asymptomatic cases could affect patterns described in this report. Similar to earlier reports on COVID-19 case surveillance, severe outcomes were more commonly reported among persons who were older and those with underlying health conditions ( 1 ). Findings in this report align with demographic and severe outcome trends identified through COVID-NET ( 4 ). Findings from case surveillance are evaluated along with enhanced surveillance data and serologic survey results to provide a comprehensive picture of COVID-19 trends, and differences in proportion of cases by racial and ethnic groups should continue to be examined in enhanced surveillance to better understand populations at highest risk. Since the U.S. COVID-19 response began in January, CDC has built on existing surveillance capacity to monitor the impact of illness nationally. Collection of detailed case data is a resource-intensive public health activity, regardless of disease incidence. The high incidence of COVID-19 has highlighted limitations of traditional public health case surveillance approaches to provide real-time intelligence and supports the need for continued innovation and modernization. Despite limitations, national case surveillance of COVID-19 serves a critical role in the U.S. COVID-19 response: these data demonstrate that the COVID-19 pandemic is an ongoing public health crisis in the United States that continues to affect all populations and result in severe outcomes including death. National case surveillance findings provide important information for targeted enhanced surveillance efforts and development of interventions critical to the U.S. COVID-19 response. Summary What is already known about this topic? Surveillance data reported to CDC through April 2020 indicated that COVID-19 leads to severe outcomes in older adults and those with underlying health conditions. What is added by this report? As of May 30, 2020, among COVID-19 cases, the most common underlying health conditions were cardiovascular disease (32%), diabetes (30%), and chronic lung disease (18%). Hospitalizations were six times higher and deaths 12 times higher among those with reported underlying conditions compared with those with none reported. What are the implications for public health practice? Surveillance at all levels of government, and its continued modernization, is critical for monitoring COVID-19 trends and identifying groups at risk for infection and severe outcomes. These findings highlight the continued need for community mitigation strategies, especially for vulnerable populations, to slow COVID-19 transmission.
              Bookmark
              • Record: found
              • Abstract: found
              • Article: found
              Is Open Access

              COVID-19–Associated Multisystem Inflammatory Syndrome in Children — United States, March–July 2020

              In April 2020, during the peak of the coronavirus disease 2019 (COVID-19) pandemic in Europe, a cluster of children with hyperinflammatory shock with features similar to Kawasaki disease and toxic shock syndrome was reported in England* ( 1 ). The patients’ signs and symptoms were temporally associated with COVID-19 but presumed to have developed 2–4 weeks after acute COVID-19; all children had serologic evidence of infection with SARS-CoV-2, the virus that causes COVID-19 ( 1 ). The clinical signs and symptoms present in this first cluster included fever, rash, conjunctivitis, peripheral edema, gastrointestinal symptoms, shock, and elevated markers of inflammation and cardiac damage ( 1 ). On May 14, 2020, CDC published an online Health Advisory that summarized the manifestations of reported multisystem inflammatory syndrome in children (MIS-C), outlined a case definition, † and asked clinicians to report suspected U.S. cases to local and state health departments. As of July 29, a total of 570 U.S. MIS-C patients who met the case definition had been reported to CDC. A total of 203 (35.6%) of the patients had a clinical course consistent with previously published MIS-C reports, characterized predominantly by shock, cardiac dysfunction, abdominal pain, and markedly elevated inflammatory markers, and almost all had positive SARS-CoV-2 test results. The remaining 367 (64.4%) of MIS-C patients had manifestations that appeared to overlap with acute COVID-19 ( 2 – 4 ), had a less severe clinical course, or had features of Kawasaki disease. § Median duration of hospitalization was 6 days; 364 patients (63.9%) required care in an intensive care unit (ICU), and 10 patients (1.8%) died. As the COVID-19 pandemic continues to expand in many jurisdictions, clinicians should be aware of the signs and symptoms of MIS-C and report suspected cases to their state or local health departments; analysis of reported cases can enhance understanding of MIS-C and improve characterization of the illness for early detection and treatment. Local and state health departments reported suspected MIS-C patients to CDC using CDC’s MIS-C case report form, which included information on patient demographics, clinical findings, and laboratory test results. Patients who met the MIS-C case definition and were reported to CDC as of July 29, 2020, were included in the analysis. Latent class analysis (LCA), a statistical modeling technique that can divide cases into groups by underlying similarities, was used to identify and describe differing manifestations in patients who met the MIS-C case definition. The indicator variables used in the LCA were the presence or absence of SARS-CoV-2–positive test results by reverse transcription–polymerase chain reaction (RT-PCR) or serology, shock, pneumonia, and involvement of organ systems (i.e., cardiovascular, dermatologic, gastrointestinal, hematologic, neurologic, renal, or respiratory). Three-class LCA was conducted using the R software package “poLCA” with 100 iterations to identify the optimal classification scheme ( 5 ). Clinical and demographic variables were reported for patients by LCA class. Chi-squared or Fisher’s exact tests were used to compare proportions of categorical variables; numeric variables, with medians and interquartile ranges, were compared using the Kruskal-Wallis rank sum test. As of July 29, 2020, a total of 570 MIS-C patients with onset dates from March 2 to July 18, 2020, had been reported from 40 state health departments, the District of Columbia, and New York City (Figure). The median patient age was 8 years (range = 2 weeks–20 years); 55.4% were male, 40.5% were Hispanic or Latino (Hispanic), 33.1% were non-Hispanic black (black), and 13.2% non-Hispanic white (white) (Table 1). Obesity was the most commonly reported underlying medical condition, occurring in 30.5% of Hispanic, 27.5% of black, and 6.6% of white MIS-C patients. FIGURE Geographic distribution of 570 reported cases of multisystem inflammatory syndrome in children — United States, March–July 2020 Abbreviations: DC = District of Columbia; NYC = New York City. The figure is a map of the United States showing the geographic distribution of 570 reported cases of multisystem inflammatory syndrome in children during March–July 2020. TABLE 1 Characteristics of patients (N = 570) reported with multisystem inflammatory syndrome in children (MIS–C) — United States, March–July 2020 Characteristic No. (%) p value Total (N = 570) Latent class analysis group* Class 1 (n = 203) Class 2 (n = 169) Class 3 (n = 198) Sex Female 254 (44.6%) 87 (42.9%) 81 (47.9%) 86 (43.4%) 0.57 Male 316 (55.4%) 116 (57.1%) 88 (52.1%) 112 (56.6%) Age (yrs), median (IQR) 8 (4–12) 9 (6–13) 10 (5–15) 6 (3–10) 1.5 cm diameter 76 (13.3%) 28 (13.8%) 18 (10.7%) 30 (15.2%) 0.43 SARS COV–2 testing Any laboratory test done 565 (99.1%) 200 (98.5%) 169 (100.0%) 196 (99.0%) 0.39 Any positive laboratory test¶¶ (% among tested) 565 (100.0%) 200 (100.0%) 169 (100.0%) 196 (100.0%) NA PCR positive/Serology negative, not done, or missing*** 147 (25.8%) 1 (0.5%) 142 (84.0%) 4 (2.0%) 1.5 cm diameter, and mucocutaneous lesions. § Percentages calculated among 510 persons with an echocardiogram performed. ¶ Thrombocytopenia was defined as a platelet count of less than 150 x 103 per μl or if thrombocytopenia was checked on the case-report form. Lymphopenia was defined as a lymphocyte count of <4,500 cells per μl for infants aged <8 months, or less than 1,500 cells per ml for persons aged ≥8 months. **Among 359 with respiratory organ system involvement, 324 (90%) also had cardiovascular system involvement. †† Information about pneumonia was collected on the case report form under signs and symptoms, complications, or chest imaging. §§ Percentages calculated among 545 persons with either an echocardiogram or chest imaging performed. ¶¶ Eight cases had a positive SARS CoV–2 antigen test result, among whom three were also positive by both PCR and serology, one was positive by PCR alone, and one was positive by serology alone. *** Among 147 cases with a positive PCR result without a positive serologic test result, 10 had a negative serologic test, and the remaining had unknown serologic testing. ††† Among 263 cases with positive serologic test result without a positive PCR result, 254 had a negative PCR result, and the remaining had unknown PCR testing. §§§ Percentages calculated among 527 persons who received treatment. ¶¶¶ 73 received a second dose of IVIG. Overall, the illness in 490 (86.0%) patients involved four or more organ systems. Approximately two thirds did not have preexisting underlying medical conditions before MIS-C onset. The most common signs and symptoms reported during illness course were abdominal pain (61.9%), vomiting (61.8%), skin rash (55.3%), diarrhea (53.2%), hypotension (49.5%), and conjunctival injection (48.4%). Most patients had gastrointestinal (90.9%), cardiovascular (86.5%), or dermatologic or mucocutaneous (70.9%) involvement. Substantial numbers of MIS-C patients had severe complications, including cardiac dysfunction (40.6%), shock (35.4%), myocarditis (22.8%), coronary artery dilatation or aneurysm (18.6%), and acute kidney injury (18.4%). The majority of patients (63.9%) were admitted to an ICU. The median length of ICU stay was 5 days (interquartile range = 3–7 days). Of the 565 (99.1%) patients who underwent SARS-CoV-2 testing, all had a positive test result by RT-PCR or serology; 46.1% had only serologic evidence of infection and 25.8% had only positive RT-PCR test results. Five patients (0.9%) did not have testing performed but had an epidemiologic link as indicated in the MIS-C case definition. Among all 570 patients, 527 (92.5%) were treated, including 424 (80.5%) who received intravenous immunoglobulin (IVIG), 331 (62.8%) who received steroids, 309 (58.6%) who received antiplatelet medication, 233 (44.2%) who received anticoagulation medication, and 221 (41.9%) who were treated with vasoactive medication. Ten (1.8%) patients were reported to have died (Table 1). LCA identified three classes of patients, each of which had significantly different illness manifestations related to some of the key indicator variables. Class 1 represented 203 (35.6%) patients who had the highest number of involved organ systems. Within this group, 99 (48.8%) had involvement of six or more organ systems; those most commonly affected were cardiovascular (100.0%) and gastrointestinal (97.5%). Compared with the other classes, patients in class 1 had significantly higher prevalences of abdominal pain, shock, myocarditis, lymphopenia, markedly elevated C-reactive protein (produced in the liver in response to inflammation), ferritin (an acute-phase reactant), troponin (a protein whose presence in the blood indicates possible cardiac damage), brain natriuretic peptide (BNP), or proBNP (indicative of heart failure) (p<0.01) (Tables 1 and 2). Almost all class 1 patients (98.0%) had positive SARS-CoV-2 serology test results with or without positive SARS-CoV-2 RT-PCR test results. These cases closely resembled MIS-C without overlap with acute COVID-19 or Kawasaki disease. TABLE 2 Reported serum laboratory values for multisystem inflammatory syndrome in children (MIS-C) cases (N = 570), by latent class analysis (LCA) group* — United States, March–July 2020   LCA class 1 LCA class 2 LCA class 3 p-value  Laboratory test No. Median IQR No. Median IQR No. Median IQR Fibrinogen, peak (mg/dL) 151 557 (449–713) 87 566 (430–662) 105 546 (426–681) 0.67 D-dimer, peak (mg/L) 158 3.0 (1.6–4.9) 106 2.6 (1.2–5.1) 128 1.7 (0.8–3.2) <0.01 Troponin, peak (ng/mL) 162 0.09 (0.02–0.48) 109 0.05 (0.01–0.30) 130 0.01 (0.01–0.08) <0.01 BNP, peak (pg/mL) 53 1,321 (414–2,528) 30 198 (76–927) 25 182 (30–616) <0.01 proBNP, peak (ng/L) 103 4,700 (1,261–13,646) 68 1,503 (247–6,846) 92 507 (176–2,153) <0.01 CRP, peak (mg/L) 166 21 (14–29) 122 16 (9–25) 144 14 (6–23) <0.01 Ferritin, peak (ng/mL) 159 610 (347–1,139) 108 422 (207–825) 132 242 (116–466) <0.01 IL-6, peak (pg/mL) 54 65 (24–258) 27 41 (21–131) 29 69 (7–118) 0.24 Platelets, nadir (103 cells/μl) 115 131 (102–203) 76 172 (103–245) 68 150 (113–237) 0.15 Lymphocytes, nadir (cells/μl) 72 695 (400–1,093) 49 1,200 (790–2,025) 42 1,420 (723–2,250) <0.01 Abbreviations: BNP = brain natriuretic peptide; CRP = C-reactive protein; IL-6 = Interleukin-6; IQR = interquartile range. * Latent class analysis (LCA) is a statistical modeling technique in which observations can be classified into latent classes based on their underlying similarities. Variables that are associated with MIS-C clinical manifestation were selected as indicator variables and included in the LCA model. Class 2 included 169 (29.6%) patients; among those in this group, 129 (76.3%) had respiratory system involvement. These patients were significantly more likely to have cough, shortness of breath, pneumonia, and acute respiratory distress syndrome (ARDS), indicating that their illnesses might have been primarily acute COVID-19 or a combination of acute COVID-19 and MIS-C. The rate of SARS-CoV-2 RT-PCR positivity (without seropositivity) in this group (84.0%) was significantly higher than that for class 1 (0.5%) or class 3 (2.0%) patients (p<0.01). The case fatality rate among class 2 patients was the highest (5.3%) among all three classes (p<0.01). Class 3 included 198 (34.7%) patients; the median age of children in this group (6 years) was younger than that of the class 1 patients (9 years) or class 2 patients (10 years) (p<0.01) (Table 1). Class 3 patients also had the highest prevalence of rash (62.6%), and mucocutaneous lesions (44.9%). Although not statistically significant (p = 0.49), the prevalence of coronary artery aneurysm and dilatations (18.2%) was higher than that in class 2 patients (15.8%), but lower than that in class 1 patients (21.1%). Class 3 patients more commonly met criteria for complete Kawasaki disease (6.6%) compared with class 1 (4.9%) and class 2 (3.0%) patients (p = 0.30), and had the lowest prevalence of underlying medical conditions, organ system involvement, complications (e.g., shock, myocarditis), and markers of inflammation and cardiac damage. Among class 3 patients, 63.1% had positive SARS-CoV-2 serology only and 33.8% had both serologic confirmation and positive RT-PCR results. Discussion Initial reports of MIS-C patients described varied clinical signs and symptoms at initial evaluation, but most cases included features of shock, cardiac dysfunction, gastrointestinal symptoms, significantly elevated markers of inflammation and cardiac damage, and positive test results for SARS-CoV-2 by serology ( 3 , 6 – 8 ). Because the case definition is nonspecific and confirmatory laboratory testing does not exist, it might be difficult to distinguish MIS-C from other conditions with overlapping clinical manifestations such as severe acute COVID-19 and Kawasaki disease ( 9 ). Latent class analysis is particularly well-suited to describe differing manifestations of a novel clinical syndrome. It divides patients into groups that might have been previously unrecognized, based on shared characteristics, allowing for an unbiased determination of disease manifestations. Patients identified in class 1 had little overlap with acute COVID-19 or Kawasaki disease, whereas patients in class 2 had clinical and laboratory manifestations that overlapped with acute COVID-19. This overlap might result from the development of MIS-C soon after symptomatic acute COVID-19 illness. However, the presence of isolated severe acute COVID-19 illness cannot be ruled out in some of these patients. Patients in class 3 generally seemed to have less severe MIS-C illness and clinical manifestations that overlapped with Kawasaki disease, and distinguishing class 3 patients from those with true Kawasaki disease could be difficult ( 4 ). As the COVID-19 pandemic spreads, and more children are exposed to SARS-CoV-2 with subsequent seroconversion, patients with Kawasaki disease might be misidentified as MIS-C because of an incidental finding of antibodies to SARS-CoV-2. Overall, the age distribution of the patients in this analysis is similar to that described elsewhere, but there are differences in the clinical manifestations and laboratory findings, perhaps due to differences in inclusion criteria ( 6 , 7 ). Increases in COVID-19 incidence might result in increased occurrence of MIS-C which might not be apparent immediately because of the 2–4-week delay in the development of MIS-C after acute SARS-CoV-2 infection ( 8 ). The proportion of Hispanic, black, and white MIS-C patients with obesity is slightly higher than that reported in the general pediatric population. ¶ Hispanic and black patients accounted for the largest proportion (73.6%) of reported MIS-C patients. Acute COVID-19 has been reported to disproportionately affect Hispanics and blacks ( 10 ). Long-standing inequities in the social determinants of health, such as housing, economic instability, insurance status, and work circumstances of patients and their family members have systematically placed social, racial, and ethnic minority populations at higher risk for COVID-19 and more severe illness, possibly including MIS-C.** The findings in this report are subject to at least four limitations. First, there is a possibility of case identification and reporting bias, including variability in diagnosis, testing, and management of patients by different jurisdictions. Second, inconsistency in completion of case report forms, with some patients still hospitalized at the time of reporting, might have affected data completeness (e.g., race and ethnicity were not reported for 18.9% of cases). Third, access to SARS-CoV-2 testing at the time of onset might have varied by regions, hospitals, and time. Finally, CDC’s case definition was broad, with the intention of being more inclusive, which might have led to the unintentional inclusion of patients whose illnesses overlapped with acute COVID-19 and Kawasaki disease. As the COVID-19 pandemic continues, with the number of cases increasing in many jurisdictions, health care providers should continue to monitor patients to identify children with a hyperinflammatory syndrome with shock and cardiac involvement. Suspected MIS-C patients should be reported to local and state health departments. Distinguishing patients with MIS-C from those with acute COVID-19 and other hyperinflammatory conditions is critical for early diagnosis and appropriate management. It is also critical for monitoring potential adverse events of a COVID-19 vaccine when one becomes widely available. Studies to define the clinical and laboratory characteristics of MIS-C should continue, including identification of parameters that will help distinguish the illness from other similar conditions. Summary What is already known about this topic? Multisystem inflammatory syndrome in children (MIS-C) is a rare but severe condition that has been reported approximately 2–4 weeks after the onset of COVID-19 in children and adolescents. What is added by this report? Most cases of MIS-C have features of shock, with cardiac involvement, gastrointestinal symptoms, and significantly elevated markers of inflammation, with positive laboratory test results for SARS-CoV-2. Of the 565 patients who underwent SARS-CoV-2 testing, all had a positive test result by RT-PCR or serology. What are the implications for public health practice? Distinguishing MIS-C from other severe infectious or inflammatory conditions poses a challenge to clinicians caring for children and adolescents. As the COVID-19 pandemic continues to expand in many jurisdictions, health care provider awareness of MIS-C will facilitate early recognition, early diagnosis, and prompt treatment.
                Bookmark

                Author and article information

                Journal
                MMWR Morb Mortal Wkly Rep
                MMWR Morb Mortal Wkly Rep
                WR
                Morbidity and Mortality Weekly Report
                Centers for Disease Control and Prevention
                0149-2195
                1545-861X
                02 October 2020
                02 October 2020
                : 69
                : 39
                : 1410-1415
                Affiliations
                CDC COVID-19 Response Team; Epidemic Intelligence Service, CDC.
                Author notes
                Corresponding author: Rebecca T. Leeb, RLeeb@ 123456CDC.gov .
                Article
                mm6939e2
                10.15585/mmwr.mm6939e2
                7537558
                33001869
                4a62c0ad-f6d3-4e1f-ba4b-3b68d0d36ff0

                All material in the MMWR Series is in the public domain and may be used and reprinted without permission; citation as to source, however, is appreciated.

                History
                Categories
                Full Report

                Comments

                Comment on this article