- Record: found
- Abstract: found
- Article: not found
Cryo-EM structures of the TMEM16A calcium-activated chloride channel
research-article
Shangyu Dang
1 ,
Shengjie Feng
2 ,
Jason Tien
2 ,
Christian J. Peters
2 ,
David Bulkley
1 ,
Marco Lolicato
3 ,
Jianhua Zhao
1 ,
Kathrin Zuberbühler
4 ,
Wenlei Ye
2 ,
Lijun Qi
2 ,
Tingxu Chen
2 ,
Charles S. Craik
4 ,
Yuh Nung Jan
1
,
2
,
5 ,
Daniel L. Minor Jr.
1
,
2
,
3
,
6
,
7 ,
Yifan Cheng
1
,
5 ,
Lily Yeh Jan
1
,
2
,
5
13 December 2017
Read this article at

There is no author summary for this article yet. Authors can add summaries to their articles on ScienceOpen to make them more accessible to a non-specialist audience.
Abstract
Calcium-activated chloride channels (CaCCs) encoded by TMEM16A
1–3
control neuronal signaling, smooth muscle contraction, airway and exocrine gland secretion,
and rhythmic movements of the gastrointestinal system
4–7
. To understand how CaCCs mediate and control anion permeation to fulfill these physiological
functions, knowledge of the mammalian TMEM16A structure and identification of its
pore-lining residues is essential. TMEM16A forms a dimer with two pores
8,9
. Thus far, CaCC structural analyses relied on homology modeling of a fungal homolog
nhTMEM16 that functions primarily as a lipid scramblase
10–12
and subnanometer-resolution electron cryo-microscopy (cryo-EM)
12
. Here, we present de novo atomic structures of the transmembrane domains of mouse
TMEM16A in nanodiscs and in lauryl maltose neopentyl glycol (LMNG) as determined by
single-particle cryo-EM. These structures reveal the ion permeation pore and represent
different functional states. The LMNG structure has one Ca2+ ion resolved within each
monomer with a constricted pore, likely corresponding to a closed state because CaCC
with single Ca2+ occupancy requires membrane depolarization to open
13
. The nanodisc structure has two Ca2+ ions per monomer and its pore in a closed conformation
likely reflects channel rundown, a gradual loss of channel activity following prolonged
CaCC activation in 1 mM Ca2+. Structure-based mutagenesis and electrophysiological
studies identified ten residues distributed along the pore that interact with permeant
anions and affect anion selectivity as well as seven pore-lining residues that cluster
near pore constrictions and regulate channel gating. Together, these data clarify
the basis of CaCC anion conduction.
Our screen of deletion constructs of the mouse TMEM16A splice variant
1
that contains exon ‘a’ but not exons ‘b-d’ identified a C-terminally truncated mutant
with high expression and stability (Extended Data Fig. 1a) and channel function (Extended
Data Fig. 1b). Its increased Ca2+ sensitivity is reminiscent of gating changes observed
in other TMEM16A truncation mutants
14,15
. Reducing negatively charged lipids via poly-L-lysine (PLL) caused desensitization
by reducing Ca2+ sensitivity without altering the plateau current (Extended Data Fig.
1c). This truncated TMEM16A including amino acids 1–903 was purified in detergent
followed by reconstitution into lipid nanodiscs (Extended Data Fig. 1d) or kept solubilized
in LMNG (Extended Data Fig. 1h) for further analyses. N-[4-(7-diethylamino-4-methyl-3-coumarinyl)phenyl]maleimide
(CPM) assay
16,17
revealed a similar melting temperature (Tm) for Ca2+-free TMEM16A while stepwise increase
of Ca2+ concentration caused Tm to gradually increase for TMEM16A in nanodisc but
not for LMNG-solubilized TMEM16A (Extended Data Fig. 1e, i); this stabilizing effect
of Ca2+ reached plateau at ~1 μM Ca2+ (Extended Data Fig. 1e), as did channel activation
(Extended Data Fig. 1b). The CPM assay thus revealed that TMEM16A in nanodiscs or
LMNG differ in their Ca2+ binding characteristics.
Negative stain electron microscopy (EM) of LMNG-solubilized TMEM16A and dodecylmaltoside
(DDM):cholesterol hemisuccinate (CHS)-solubilized TMEM16A reconstituted into lipid
nanodiscs revealed homogeneous preparations suitable for high resolution structural
studies (Extended Data Fig. 1f, g, j, k). Using single-particle cryo-EM we determined
the structures of TMEM16A to better than 4 Å nominal resolutions (Extended Data Fig.
2, 3, 4b). Local resolution analysis showed that the core transmembrane domains have
the highest (better than 4 Å) resolution and the extracellular and cytoplasmic domains
have the poorest (Extended Data Fig. 2f, 3f), suggesting conformational flexibility
of these regions. The resolution of the LMNG-solubilized TMEM16A reconstruction is
anisotropic because images of particles oriented along certain axes were lacking (Extended
Data Fig. 3c, h, i). Because the missing views are within a small angular range, there
is no distortion regarding the definition of the transmembrane helices with respect
to the membrane. The anisotropy is considerably reduced by adding particles from a
dataset in which a monoclonal fragment of antigen binding (Fab) isolated from a human
naïve Fab phage library
18,19
is bound to TMEM16A (Extended Data Fig. 3b, h, i). The final density maps allowed
reliable assignment of most of the side chains in all ten transmembrane segments and
enabled building de novo atomic models of the transmembrane segments of dimeric TMEM16A
in both nanodisc and LMNG (Fig. 1a, b; Extended Data Fig. 4a, c, d, 5a–f). Cross-validation
between the atomic model and the density maps of the transmembrane domains suggested
that the average resolutions are around 4 Å (Extended Data Fig. 2g, 3g). The nanodisc-reconstituted
TMEM16A is structurally similar to the subnanometer-resolution structure of digitonin-solubilized
TMEM16A
12
but missing part of the C-terminal cytoplasmic domain owing to the truncation construct
used in our study (Extended Data Fig. 5g–i).
To locate the pore, we used the HOLE program
20
to delineate potential water-filled profiles in these structures. By testing whether
anion selectivity could be altered by mutations of residues lining the potential pore
within each monomer or the potential pore at the dimer interface that is associated
with lipids, we identified the pore surrounded by transmembrane helices TM3–8 (Fig.
1c–e and Extended Data Fig. 6d). This pore is not exposed to the lipid bilayer as
proposed
21–24
. Similar to a previous study
12
, our cryo-EM studies revealed a pore too narrow for the passage of permeant anions.
It remains possible that some open conformation of the pore is partly lined by lipids.
A comparison of nanodisc-reconstituted and LMNG-solubilized TMEM16A density maps (Fig.
2a, b) revealed differences primarily in the positions and orientations of TM3, TM4,
and TM6 (Fig. 2c–f; Extended Data Fig. 7a–f). These pore-lining helices in the TMEM16A
channel are also displaced noticeably from the positions of the equivalent helices
of the nhTMEM16A lipid scramblase
10
. We found some helical distortions in the nanodisc-reconstituted TMEM16A starting
from G640 and extending towards the lower part of TM6 (Extended Data Fig. 4a, 7a,
b). In the LMNG reconstruction, the lower part of the TM6 could not be resolved beyond
G640 (Extended Data Fig. 4a, 7d, e). These observations are in agreement with mutagenesis
studies implicating G640 as a flexible hinge that affects channel gating
13
. Additionally, the two structures differ in the orientation of TM3 and in the arrangement
of the TM5-TM6 loop that is near the pore entrance and harbors K599 and R617 important
for anion selectivity
25
, and the TM9-TM10 loop that harbors R784 important for anion selectivity
25
and packs against the TM5-TM6 loop (Extended Data Fig. 7g–l). We observed densities
consistent with the presence of ordered lipids near the dimer interface but not near
the pore of both nanodisc-reconstituted and LMNG-solubilized TMEM16A (Fig. 1a; Extended
Data Fig. 7b, c, e, f). And the number of ordered lipids observed in the nanodisc
structure is greater than that in the LMNG structure. It is possible that lipids may
stabilize TMEM16A in the more native environment of nanodiscs.
These two structures showed a surprising difference near the putative Ca2+ binding
sites even though both structures were determined in the presence of 1 mM calcium.
Consistent with previous studies
10,26,27
, the acidic residues E650, E698, E701, E730 and D734 group together to form two Ca2+
binding sites in nanodisc-reconstructed TMEM16A (Fig. 2g, h). Comparisons of the maps
and models suggest that these residues are well organized in nanodisc-reconstructed
TMEM16A, but less so in LMNG-solubilized TMEM16A (Fig. 2h, i). The difference maps
between the experimental map and the map from the refined structure that do not contain
Ca2+ ions showed a clear omit density that we assigned as a bound Ca2+ ion, for LMNG-solubilized
TMEM16 at σ = 13 and for nanodisc-reconstituted TMEM16A at σ = 8. The location of
this bound Ca2+ ion matches well with one of the two bound Ca2+ ions in the crystal
structure of nhTMEM16A
10
. In the nanodisc structure, there is another omit density (σ = 10) nearby that may
correspond to the second bound Ca2+ ion (Fig. 2h). In contrast, in the LMNG structure,
no other significant omit density was found nearby, suggesting there is only one Ca2+
ion bound (Fig. 2h). Notably, E650 on the lower half of TM6 is not resolved in LMNG-solubilized
TMEM16A (Fig. 2h; Extended Data Fig. 4a, 7d). Our mutagenesis studies showing that
alanine substitution of E650 raises the Ca2+ concentration for half maximal activation
(EC50) and reduces the Hill coefficient from two to one
13,26
indicate that this residue in TM6 is critical for Ca2+ binding. It is therefore understandable
that the more flexible TM6 harboring E650 results in partial Ca2+ occupancy of LMNG-solubilized
TMEM16A (Fig. 2h, i), raising the possibility that some of the conformational differences
between the two structures could reflect different channel conformations. It appears
that the native-like lipid environment of nanodiscs allowed stabilization of TM6 so
that two Ca2+ ions can be fully coordinated by their binding sites (Fig. 2g, h).
Based on our structures (see Extended Data Fig. 8 for structural determination details),
mutagenesis of residues lining the pore revealed that a subset of these residues affected
anion selectivity (Fig. 3a–c). Besides R511 on TM3 and K599 on the TM5-TM6 loop important
for anion selectivity
25
, and K584 on TM5 that partially accounts for the selectivity for anions over cations
28
(Fig. 3b), we tested alanine substitutions of 24 other pore-lining residues including
N542 and D550 on TM4, N587 and V595 on TM5, Q705 and F712 on TM7, and S635 on TM6
(Fig. 3a, b and Extended Data Fig. 6d). The permeability ratios determined by replacing
external Cl− with I− or SCN− were reduced by 40% by S635A but increased by 40–130%
by the other six mutations (Fig. 3d–f). Whereas the side chains of Q705 and F712 do
not appear to be pointing into the pore, it remains an open question whether they
may reorient and face the pore as the channel opens. These ten pore-lining residues
identified thus far for their roles in anion selectivity (Fig. 3c) may reflect an
extended selectivity filter, or multiple pore regions for permeant ion interactions.
We noticed narrow constrictions of the pore of LMNG-solubilized TMEM16A (Fig. 4a–c),
likely representing a stable closed conformation. To test whether residues facing
the pore affect channel gating possibly by altering the relative stability of the
open versus closed states, we examined alanine substitutions of 21 residues including
N542 and I546 on TM4, Y589 and I592 on TM5, and F708 on TM7. These five alanine mutations
increased the apparent Ca2+ sensitivity whereas alanine substitution of V595 on TM5
and L639 on TM6 decreased the apparent Ca2+ sensitivity (Fig. 4d–f and Extended Data
Fig. 9c). In contrast to the pore-lining residues important for anion selectivity
that are spread over more than 25 Å along the length of the pore (Fig. 3c), these
seven residues affecting the Ca2+ dependence of channel activation are all located
within ~10 Å from the pore constrictions (Fig. 4c), indicating that these residues
at the constricted pore influence the stability of the channel conformation important
for gating.
TMEM16A-CaCC likely have multiple open states
2,13
and closed states
13
(Fig. 5a). With the same anion concentration on both sides of the membrane, occupancy
of the first Ca2+ binding site allows the channel to open when the membrane potential
is depolarized to positive values
13
, whereas CaCC with double Ca2+ occupancy activates in a voltage independent manner
13
. The currents conducted by the C-terminally truncated TMEM16A also displayed voltage
dependence at 30 nM Ca2+ but not 1 mM Ca2+ (Fig. 5b). Given the single Ca2+ occupancy
of TMEM16A in LMNG, this structure is in a closed conformation probably because of
the lack of depolarization. Moreover, we found that the K584Q mutation altered the
ion selectivity in low but not high Ca2+ (Extended Data Fig. 9a, b), suggestive of
multiple open states with differences in the permeation pathway
2
– a finding of potential relevance to the different mutagenesis results
8,9,28
regarding this pore-lining residue (Fig. 3a–c). The nanodisc-reconstituted TMEM16A
structure likely corresponds to a closed conformation due to channel rundown following
prolonged activation in 1 mM Ca2+ (Fig. 5c–e)
12
. Intrigued by the involvement of the hydrophobic V595 in anion selectivity, we tested
multiple substitutions and found bulky basic residues to be less effective than alanine
in enhancing the relative permeability of large anions (Extended Data Fig. 6a–d).
These studies underscore the importance of structure-based functional analyses.
In this study, we identify for the first time pore-lining residues of CaCC based on
structural analyses of TMEM16A as well as mutagenesis of these highly conserved pore-lining
residues (Extended Data Fig. 10). Unlike previous efforts searching among positively
charged residues for those involved in anion permeation
12,25,28
, we tested residues facing water-filled potential pore structures to delineate the
permeation pathway based on the involvement of pore-lining residues in anion selectivity.
For ion permeation and channel gating, we classify pore-lining residues into two groups:
one group is distributed along the entire pore and is important for anion selectivity,
and the other group is clustered together and is important for gating. For the first
group, we validated the ability of ten pore-lining residues to interact with permeant
ions by showing that mutations of these residues alter anion selectivity in this study
and in two previous studies
25,28
. Visualization of the pore-lining residues and functional assessments of their role
in anion selectivity thus firmly establishes their pore assignment. For the second
group, we demonstrate a role for seven residues facing the constricted pore in channel
gating, indicating that channel opening likely involves displacement of these residues
that affect the relative stability of the open and closed states. Our study provides
an essential framework to guide further studies of gating and anion permeation of
calcium-activated chloride channels.
METHODS
Protein expression and purification
Truncated mouse TMEM16A was C-terminally fused to a 3C consensus sequence, a Strep-tag
II peptide, and a GFP moiety and expressed in HEK293 GnTi− cells using the BacMam
system as described previously
29,30
.
Protein purification and sample processing were carried out at 4°C. For nanodisc-reconstituted
preparations, approximately 10 g of cell pellet (from about 1 L culture) was lysed
by stirring for 40 min in 200 ml hypotonic buffer containing 50 mM TrisNO3 (pH 9.0)
supplemented with 0.1 mg/ml DNase, 1× complete protease inhibitor cocktail (Roche)
and 1 mM phenylmethylsulfonyl (PMSF). The membrane fraction was collected by centrifugation
at 30,000g for 30 min, and then homogenized with a Dounce homogenizer in extraction
buffer containing 50 mM TrisNO3 (pH 9.0), 150 mM KNO3, and 10 mM CaCl2 supplemented
with 0.1 mg/ml DNase, 1× complete protease inhibitor cocktail, and 1 mM PMSF. Protein
was extracted in 200 ml extraction buffer plus 0.5% n-dodecyl-b-d-maltopyranoside
(DDM) and 0.1% cholesteryl hemisuccinate (CHS) with gentle stirring for 2 h. The insoluble
fraction was removed by centrifugation at 30,000g for 30 min. The recombinant protein
was affinity purified with an anti-GFP nanobody immobilized on CNBr-activated sepharose
resin (GE Healthcare) in wash buffer containing 10 mM TrisNO3 (pH 9.0), 150 mM KNO3,
1 mM CaCl2, 0.05% DDM, and 0.01% CHS supplemented with a 0.1 mg/ml lipid mixture containing
1-palmitoyl-2-oleoyl-sn-glycero-3-phosphocholine (POPC), 1-palmitoyl-2-oleoylsn-glycero-3-phosphoethanolamine
(POPE) and 1-palmitoyl-2-oleoyl-sn-glycero-3-phospho-L-serine (POPS) at a ratio of
3:1:1. The purified protein was recovered by incubation with 1.5 CV wash buffer containing
0.5 mM dithiothreitol (DTT) and 50 mg 3C protease overnight. To reconstitute the protein
in nanodiscs, the lipid was prepared as described previously in buffer containing
10 mM TrisNO3 and 150 mM KNO3. After purification, the protein sample was mixed with
MSP2N2 and soy PC (Avanti) at a molar ratio of TMEM16A monomer: MSP2N2: soy PC = 1:4:100.
The mixture was allowed to equilibrate for 1 h and Bio-beads SM2 (Bio-Rad) were added
to the mixture three times within 24 h to gradually remove detergents from the system.
Afterwards, the sample was filtered through a 0.45 μm filter, and reconstituted protein
was separated on a Superdex-200 column in column buffer containing 10 mM TrisNO3 (pH
9.0), 150 mM KNO3, and 1 mM CaCl2. The peak fraction was collected and concentrated
to 0.6–0.7 mg/ml using a 100 kDa MWCO Amicon Ultra filter device (Millipore). The
lipid compositions used for protein purification and nanodisc reconstitutions are
chosen based on previous studies
30,31
.
The same purification procedures were used to prepare LMNG solubilized preparations
except 5 mM LMNG was in the extraction buffer and 0.02 mM LMNG was used in the wash
buffer instead of DDM and CHS. After digestion by 3C, the protein was collected and
immediately separated on a Superdex-200 column in column buffer containing 10 mM TrisNO3
(pH 9.0), 150 mM KNO3 and 1 mM CaCl2. The peak fractions were collected and concentrated
to 1 mg/ml using 100-kDa Amicon Ultra filter device.
N-[4-(7-diethylamino-4-methyl-3-coumarinyl)phenyl] maleimide (CPM) assay of TMEM16A
stability as function of calcium concentration
To assess the stability of TMEM16A in the presence of a range of Ca2+ concentrations
via CPM assay
16
, we dialyzed TMEM16A in nanodiscs or LMNG in solutions containing buffered calcium
made (at pH7.5 buffered with HEPES) by combining Ca(OH)2 and EGTA to a ratio predicted
by CaBuf softward (KU Leuven). Calcium concentrations of the solutions containing
dialyzed TMEM16A protein preparations were subsequently measured directly against
calcium standards, using a Fluo-8 fluorescent assay in a BioTek Synergy H4 plate reader.
MSP proteins have no cysteines and empty nanodiscs generate no CPM fluorescence signals
17
, so the CPM signal measured via a fluoromax fluorometer (excitation at 387 nm, emission
at 463 nm) provides a readout of cysteine exposure upon unfolding of TMEM16A at temperature
ranging from 25°C to 75°C.
Isolation of monoclonal Fab (fragment antigen binding) for TMEM16A
To obtain Fabs to be used as fiducial markers for cryo-EM studies, TMEM16A was reconstituted
into nanodiscs to provide a native-like lipid bilayer environment for presentation
of the calcium-activated chloride channel to the recombinant Fab library. Once reconstituted,
TMEM16A in nanodiscs was used for in-solution selections. A subtractive (nanodisc
alone) and competitive panning strategy was used to find selective binders for TMEM16A,
from our fully human naïve Fab phage library
18,19
. The selections yielded 23 clones with a signal 4 times higher than the background
in an ELISA assay. Out of these 23 clones, 3 clones showed a very specific signal
for TMEM16A and almost no signal for empty nanodiscs. Clone 2F11 was then expressed
and purified, and complex formation with TMEM16A was tested with size exclusion chromatography.
Fab(2F11) and TMEM16A indeed formed a complex which was also demonstrated by two-dimensional
class averages of electron microscopy negative stain images (Extended Data Fig. 3b).
Electrophysiology
HEK293 cells were maintained at 37°C and 5% CO2 in Dulbecco’s Modified Eagle’s Medium
supplemented with 10% Fetal Bovine Serum and 1% penicillin/streptomycin, and were
passaged upon reaching confluency (every 2–4 days) by digestion with 0.05% Trypsin-EDTA.
24 hours before recording, cells were transiently transfected with TMEM16A constructs
using Lipofectamine 2000 (Invitrogen). On the morning before recording, cells were
re-plated onto poly-L-lysine coated coverslips using trypsin and allowed to settle
for at least 1 hour.
For patch clamp electrophysiology, coverslips were transferred into a recording bath
solution containing 140 mM NaCl, 10 mM HEPES, and 5 mM EGTA, with pH adjusted to 7.2
with NaOH and osmolarity adjusted to 305–315 mOsm with mannitol. All recordings were
made at room temperature. For whole cell recordings, intracellular solutions contained
140 mM NaCl, 10 mM HEPES, 1 mM CaCl2 and 2 mM MgCl2 with pH adjusted to 7.2 with NaOH
and osmolarity adjusted to 310 mOsm with mannitol. For anion selectivity measurements,
recordings from HEK293 cells transiently expressing wild-type or mutant TMEM16A under
bi-ionic conditions using whole-cell patch-clamp and subjected to one-second ramp
protocols between −80 and +80 mV. Extracellular solutions are exchanged between voltage
ramp commands and contain 140 mM NaCl, 140 mM NaI, or 140 mM NaSCN. Permeability ratios
for iodide/chloride ions (2.70 ± 0.09, N = 28 for WT; 3.73 ± 0.12, N = 11 for N542A;
5.32 ± 0.25, N = 9 for D550A; 4.85 ± 0.16, N = 7 for N587A; 4.00 ± 0.16, N = 9 for
V595A; 1.82 ± 0.08, N = 7 for S635A; 4.65 ± 0.06, N = 5 for Q705A; 4.45 ± 0.10, N
= 6 for F712A), or thiocyanate/chloride ions (5.47 ± 0.21, N = 28 for WT; 8.99 ± 0.24,
N = 8 for N542A; 13.33 ± 0.66, N = 9 for D550A; 9.10 ± 0.29, N = 7 for N587A; 9.96
± 0.30, N = 9 for V595A; 3.24 ± 0.26, N = 7 for S635A; 13.36 ± 0.32, N = 5 for Q705A;10.78
± 0.34, N = 6 for F712A), are calculated by fitting the GHK equation to currents recorded
using voltage ramps (Extended Data Fig. 6d). For Fig. 3d, the reversal potential (at
0 nA) is −46 mV for WT and −57 mV for N587A in external SCN−, −27 mV for WT and −40
mV for N587A in external I−, −2 mV for WT and 0 mV for N587A in external Cl−.
For inside out patch recording, intracellular solutions consisted of normal bath solution
supplemented with 2 mM MgCl2. Intracellular solutions with varying calcium concentrations
were generated by buffering calcium ions with EGTA at pH 7.2 and were made by combining
Ca(OH)2 and EGTA to a ratio predicted by CaBuf software (KU Leuven) and then adding
140 mM NaCl or NMDG-Cl and 10 mM HEPES to the desired volume. Calcium concentrations
were subsequently measured directly against calcium standards using a Fluo-8 or Fluo-8FF
fluorescent assay in a BioTek Synergy H4 plate reader. To assess calcium sensitivity
of channel activation via recordings from inside-out patches excised from HEK293 cells
transiently expressing wild-type or mutant TMEM16A, the membrane potential was held
at +60 mV, and patches were exposed to intracellular solutions containing 140 mM NaCl
and increasing concentrations of free Ca2+. Solutions (a)–(f) in Fig. 4d contained
150 nM, 300 nM, 400 nM, 600 nM, 5.5 μM, and 1 mM free Ca2+, respectively. Ca2+-dependent
currents from wild-type (WT) and mutant TMEM16A channels were normalized to their
maximum values and fit to the Hill equation. The EC50 values in nM (796 ± 66, N =
10 for WT; 295 ± 24, N = 10 for N542A; 148 ± 31, N = 6 for I546A; 192 ± 13, N = 6
for Y589A; 252 ± 17, N = 6 for I592A; 2036 ± 52, N = 7 for V595A; 2008 ± 63, N = 7
for L639A; 205 ± 30, N = 8 for F708A) were compared using one-way ANOVA followed by
the Bonferroni post-hoc test for significance (Extended Data Fig. 9c).
External or internal solutions using alternate anions were made by replacing NaCl
with the indicated sodium salt at equimolar concentrations. Patch pipettes were pulled
from 1.5/0.86 (OD/ID) glass and polished to 2–2.5 MΩ resistance (inside-out patch)
or 3–5 MΩ (whole cell patch). Perfusion exchange was performed using a VM-8 perfusion
apparatus with Octaflow software (ALA Scientific). Data were collected at 10 kHz sampling
rate and low pass filtered online at 1 kHz. Recordings were made using an Axon Instruments
Multiclamp 700 with Digidata 1440 and were collected into pClamp10 software. All patch
clamp seals were allowed to reach at least 3 GΩ resistance before patch rupture, but
typical seal resistance usually exceeded 10 GΩ. All recordings were made using a 1
M KCl agar bridge to prevent baseline fluctuation at the reference electrode.
For Data analysis, all offline data analysis for patch clamp recording was performed
using Graphpad Prism 6, Clampfit 10, and Microsoft Excel. Permeability ratios were
determined from bi-ionic conditions using a reduced form of the Goldman-Hodgkin-Katz
voltage equation:
E
REV
=
R
T
z
F
Ln
P
X
[
X
-
]
o
P
Cl
[
Cl
-
]
i
where P
X represents relative permeability of ion species “X” and F, R and T have their usual
thermodynamic meanings. Concentration-dependence curves for Ca2+ were generated by
fitting data to an equation of the form:
I
I
MAX
=
1
1
+
(
K
D
[
Ca
2
+
]
)
n
H
Where I/I
MAX denotes current normalized to the maximum amplitude in the highest [Ca2+] tested,
KD
denotes the dissociation constant for that ion and nH
denotes the Hill coefficient. Statistical analysis for data acquired using patch clamp
employed one-way ANOVA followed by Bonferroni post-hoc tests for statistical significance.
p < 0.01 was used as a threshold for significance.
Electron microscopy
For negative staining, 2.5 μl of purified TMEM16A at a concentration of 0.02 mg/ml
were placed on home-made continuous carbon grids glow discharged for 30 sec and coated
with 0.75% (w/v) uranyl formate for 30 sec. Grids were imaged on a Tecnai T12 microscope
(FEI Company) operated at 120 kV with a 4k×4k scintillator-based charge-coupled device
camera UltraScan 4000, (Gatan). A nominal magnification of × 52,000, corresponding
to a pixel size of 2.21 Å on the specimen, and a defocus around −1.5 μm were used
for image recording.
For cryo-EM, 2.5 μl of purified TMEM16A at a concentration of approximately 0.5 mg/ml
were applied to holey carbon grids (Quantifoil 400 mesh Cu R1.2/1.3) glow-discharged
for 30 sec. After 30 sec incubation on the grids at 4°C under 100% humidity, grids
were blotted with Whatman #4 filter paper for 6–8 sec and plunge-frozen in liquid
ethane cooled by liquid nitrogen using a FEI Mark III Vitrobot. Grids were transferred
to an FEI Titan Krios electron microscope equipped with a field emission electron
source and operated at 300 kV at the Howard Hughes Medical Institute Cryo-EM facility
at Janelia Research Campus.
Images were recorded using SerialEM
32
in super-resolution mode using a Gatan K2 Summit direct electron detector (Gatan)
at a calibrated magnification of 29,000X, yielding a physical pixel size of 1.02 Å
(0.51 Å super resolution pixel size). A dose rate of 10 electrons per physical pixel
per second and an exposure of 8 sec were used for data collection with 0.2 sec subframes
to give a total dose of 80 electrons per Å2.
Data processing
For negative-stain data, Simplified Application Managing Utilities for EM Labs (SAMUEL)
scripts
33
were used for particle picking and 2D classification. In this package, 2D classification
was carried out by ten cycles of correspondence analysis, k-means classification,
and multi-reference alignment using SPIDER operations ‘CA S’, ‘CL KM,’ and ‘AP SH’
34
.
For Cryo-EM data, drift correction was performed using MotionCor2
35
and images were binned 2×2 by Fourier cropping to a pixel size of 1.02 Å. The contrast
transfer function (CTF) was estimated using CTFFIND4
36
(LMNG) or GCTF
37
(Nanodisc) using motion-corrected sums without dose-weighting. Motion-corrected sums
with dose-weighting were used for all other image processing. RELION (1.4 and 2.1beta1,
in which the bug on gold standard refinement procedure was fixed)
38
was used for 2D classification, 3D classification, and refinement procedures.
For the LMNG dataset, around 4000 particles were manually picked and classified by
2D classification in SAMUEL to generate the templates for automatic particle picking
with samautopick.py. 533,545 particles were identified after manually inspection of
auto-picked particles. These particles were subjected to 2D classification, using
RELION 1.4. A total of 342,875 particles from 2D classes that show clear structural
features were combined and binned 4 to a pixel size of 4.08 Å for 3D classification.
The crystal structure of nhTMEM16A (PDB:4WIS) was converted to a density map with
e2pdb2mrc.py
39
and low pass filtered to 60 Å as the initial model for 3D classification and refinement
using RELION 1.4 without applied symmetry. After 3D classification, images without
binning with a pixel size of 1.02 Å were used for further auto-refinement with a C2
symmetry. Two of five classes, which gave maps with resolution better than 5 Å (4.6
Å and 4.9 Å), were combined together for another round of 3D refinement to generate
a 4.0 Å map. The resolution was further improved to 3.8 Å by adding particles from
other three classes.
The TMEM16A with Fab bound dataset was processed with the same strategy as for TMEM16A
in LMNG. Starting with 338,705 particles from automatic particle picking and 2D classification
by RELION, 132,444 particles from 4 classes that present clear side views were combined
together for 3D auto-refinement. Then the Fab density for each particle was subtracted
with script projection_subtraction.py (written by Danniel Arsanow in Cheng lab at
UCSF) based on final data.star file containing Eular angle information from 3D refinement.
The 132,444 subtracted particles without Fab density were combined with the 342,875
particles from all five 3D classes of TMEM16A in LMNG dataset and processed for 3D
auto-refinement. After refinement have converged, the final data set was subjected
to ‘post-processing’ in RELION, in which a soft mask was calculated and applied to
the two half-maps before calculating the corrected FSC and the resolution was estimated
using FSC=0.143 criterion
40
on the corrected FSC curves in Fourier space in which the influences of the mask were
removed. During this step, temperature-factor estimation and map sharpening were also
performed to get final map at resolution of 3.4 Å.
For the Nanodisc dataset, particle picking performed with the Gautomatch program (developed
by Dr. Kai Zhang, MRC Laboratory of Molecular Biology, Cambridge, UK, http://www.mrc-lmb.cam.ac.uk/kzhang/Gautomatch/)
with templates from 2D classes of the LMNG dataset generated 927,414 particles in
total. All particles were extracted and binned 4 (pixel size 4.08 Å) and 2D classified
using RELION. 341,875 particles selected from good 2D classes were un-binned with
a pixel size of 1.02 Å, and were used for 3D refinement using an initial model low
pass filtered from the LMNG structure that had been low pass filtered to a resolution
of 60 Å, giving rise to a 5.5 Å map. This 5.5 Å map was low pass filtered to 10 Å
as the initial model to apply for 3D classification without applied symmetry for all
particles with pixel size of 4.08 Å. Two of seven classes gave a map with improved
resolution (4.7 Å and 5.1 Å respectively) after 3D auto-refinement with C2 symmetry.
These two classes were combined and another 3D auto-refinement was run to generate
the map at a resolution of 4.6 Å. Similar to LMNG dataset, the ‘post-processing’ in
RELION was applied to the final data set and the final map was generated at resolution
of 3.8 Å and used for model building.
Directional FSC is calculated using home-made script (see below). Local resolution
estimates were calculated with unsharpened raw density maps using ResMap
41
.
Model building
Ab initio model building was carried out in COOT
42
for all transmembrane helices and small parts of soluble domains. Initial placement
of TM helices was made based on sequence alignment with the nhTMEM16A (PDB accession
4WIS)
10
. For major part of soluble domain, the resolutions are insufficient for assignments.
For these parts, we used homology model that was generated with swiss-model based
on a sequence alignment with the crystal structure of nhTMEM16A
10
, and refined against the EM map on MDFF
43
. For the transmembrane region, the model was refined both in real space with Phenix.real_space_refine
44
and also in Fourier space with REFMAC
45
, followed by further manual adjustment in COOT. This process was repeated until Ramachandran
validation was satisfied. Side chain assignments were further validated by using difference
densities calculated by subtracting a simulated map based on the Ca only model from
the experimental map. The model building following similar procedure was carried out
independently by four individuals and cross-validated to ensure the accuracy of assignments.
Additional validation of the final model was carried out using MolProbity
46
and EMRinger
47
.
For cross-validation, the final model was refined against one of the half maps generated
in RELION. FSC curves were then calculated between the refined model and half map
1 (‘work,’ used in test refinement), the refined model and half map 2 (‘free,’ not
used in test refinement), and the refined model and the summed map. There is no notable
gap between ‘work’ and ‘free’ FSC curves, indicating little effect of over-fitting.
In this process, the final model was displaced and then refined against the half-map
(work). Then this model was used for calculation of cross-validation. Using FSC =
0.5 criterion, the resolution estimated from cross-validation is about 4.5 Å for nanodisc-reconstituted
TMEM16A and 3.8 Å for LMNG-solubilized TMEM16A.
HOLE
20
was used to calculate the pore profile shown in Fig. 3 and Fig. 4. The narrowest point
is defined as the location of the pore with the smallest radius. For those pore-lining
residues that are not completely resolved, a solid line and a dotted line are drawn
based on positioning two rotamers that will provide the largest and smallest estimate
for the pore radius at that location. The program PyMol
48
was used to calculate surface representation of electrostatic potentials.
Difference map calculation
We used “omit density” to assign the position of one or two Ca2+ ions. It was calculated
by subtracting a map calculated based on the refined atomic model without any ligand
from the experimental density map, i.e. density – model. In this difference map, any
experimental map features not included in the atomic model, such as densities contributed
by bound ions, appear as positive densities. The map was calculated using PHENIX
44
with the command line option “phenix.real_space_diff_map” available in the 2017-07-07
nightly build: first a theoretical map was calculated from LMNG and nanodisc structures
at a resolution of 4 Å and 3.8 Å resolution, respectively, corresponding to the resolution
at which the model refinement was performed. The electron scattering factors were
used. Then the calculated map was subtracted from the respective experimental electron
density maps. The difference maps clearly show the presence of one Ca2+ ion in the
LMNG structure and two in the nanodisc one. Ca2+ ion positions were assigned based
on the residual density between the actual experimental data and the density calculated
from the model and, with a threshold of σ = 7 and σ = 10 for densities corresponding
to nanodisc and LMNG respectively (Fig. 2h).
Calculation of directional Fourier shell correlation (dFSC)
The Fourier shell correlation (FSC) between two half-maps was calculated as described
previously
49,50
, except conical shells were used instead of spherical shells to allow calculation
of the FSC in different directions. Cones with an apex angle of 20° were sampled on
a 500-point Fibonacci spherical grid where the apex of a particular cone is at the
center of the sphere and the central axis of that cone lay on the vector joining the
center of the sphere with a grid point on the surface of the sphere. This analysis
resulted in 500 1D directional FSC (dFSC) curves, which were averaged to generate
a global average dFSC curve. A 3D representation of the dFSC analysis was generated
by constructing a sphere from the cones oriented in their respective directions and
setting each conical shell of each cone to its respective dFSC value. dFSC values
were averaged in regions of overlap between cones and a 3 pixel × 3 pixel × 3 pixel
median filter was applied three times to the 3D dFSC map in UCSF Chimera
51
to reduce noise. The resolution in different directions was determined as the spatial
frequency with a dFSC value of 0.143, the same criterion as generally used for the
FSC
52
. The trend in anisotropy of resolution that is observed at FSC = 0.143 is also observed
at other FSC thresholds irrespective of the shape of the cones used in dFSC calculations.
Extended Data
Extended Data Figure 1
TMEM16A protein purification and negative staining
a, Western blot (bottom) of nine TMEM16A constructs with different N-terminal and/or
C-terminal truncations (diagramed, top). Construct 5 corresponding to mouse TMEM16A
residues 1–903 was selected for this study for the absence of the smaller fragment
of ~30 kD on the western blot as well as its high expression. b, Top, representative
trace of inside-out patch from HEK293 cells transiently transfected with wild-type
TMEM16A (WT) or Construct 5. The membrane potential was held at +60 mV, and patches
were exposed to intracellular solutions containing 140 mM NaCl and 150 nM, 300 nM,
400 nM, 600 nM, 1.8 μM, or 1 mM free Ca2+. Repeated independently four times with
similar results. Bottom, normalized chloride currents were fit to the Hill equation.
EC50 for Ca2+ sensitivity is 178 ± 14 nM for construct 5 (four independent experiments)
and 796 ± 66 nM for WT (ten independent experiments; p < 0.0001, see Extended Data
Fig. 9c). c, Top, poly-L-lysine (PLL, 30 μg/mL) treatment for 30 sec to reduce PIP2
and other lipids with negatively charged head groups caused desensitization of TMEM16A
with C-terminal truncation (a.a. 1–903) in excised inside-out patch exposed to 150
mM NaCl on both sides of the membrane, as evident from the reduction of Ca2+ sensitivity.
Repeated independently six times with similar results. Bottom, following the PLL treatment
the current amplitudes were reduced at 30 nM Ca2+ and 100 nM Ca2+ (“Inst” for the
“instantaneous” current amplitude at the start of depolarization from a holding potential
of 0 mV to +100 mV, p = 0.02 from two-way ANOVA between “Pre” and “post” PLL; “Overall”
for the current amplitude at the end of depolarization, p = 0.004 from two-way ANOVA
between “Pre” and “Post”; 6 independent experiments) but not at 1 μM Ca2+ (Sidak’s
multiple comparisons, p > 0.99 and p = 0.73 for “Inst” and “Overall”, respectively).
Mean ± SEM are shown in b and c. d, Size-exclusion chromatography of TMEM16A reconstituted
into lipid nanodiscs with MSP2N2. The peak fractions corresponding to nanodisc-reconstituted
TMEM16A (16A) and free MSP2N2 are indicated. The 16A peak fraction was examined by
SDS-polyacrylamide gel electrophoresis (SDS-PAGE). TMEM16A and MSP2N2 (MSP) monomers
are approximately 105 kDa and 46 kDa, respectively. The faint band at 210 kDa may
correspond to incompletely disassociated TMEM16A dimers. e, CPM analysis
16,17
of nanodisc-reconstituted TMEM16A in 0, 71 nM, 293 nM, 782 nM, 4120 nM or 1 mM Ca2+.
f, Raw micrographs of nanodisc-reconstituted TMEM16A examined by negative-stain EM.
g, 2D class averages of particles from negative-stain EM of TMEM16A reconstituted
into nanodiscs h, Size-exclusion chromatography of TMEM16A solubilized in LMNG. The
peak fraction was examined by SDS-PAGE. i, CPM analysis of LMNG-solubilized TMEM16A
in 0, 83 nM, 333 nM, 1122 nM, 5290 nM or 1 mM Ca2+. j, Raw micrographs of LMNG-solubilized
TMEM16A examined by negative-stain EM. Both micrographs, (f) and (j), showed mono-dispersed
and homogeneous particles. k, 2D class averages of particles from negative-stain EM
of TMEM16A solubilized in LMNG.
Extended Data Figure 2
Cryo-EM analysis of TMEM16A reconstituted in nanodiscs
a, A representative cryo-EM micrograph of nanodisc-reconstituted TMEM16A. Green circles
indicate individual particles. b, Representative 2D class averages from boxed particles
with 256-pixel box size (261.12 Å). c, Eular angle distribution of all particles included
in the final 3D reconstruction. The size of the spheres is proportional to the number
of particles seen from that specific orientation. d, FSC curves of two independently
refined maps before (blue) and after (red) post-processing in RELION. Curves with
resolution corresponding to FSC = 0.143 are shown. e, Planar slices through the unsharpened
EM density map at different levels along the channel symmetry axis. f, Local resolution
of TMEM16A as estimated by RELION and shown with pseudo-color representation of resolution.
g, Cross-validation using FSC curves of the density map calculated from the refined
model versus half map 1 (work), versus half map 2 (free), and versus summed map. h,
Directional FSC from different Fourier cones. Each curve indicates a different direction.
i, Calculated resolution from different views. The directions are indicated as x,
y, and z in the 3D resolution map. The highest and lowest resolutions are labeled
with red and blue circles respectively. The green circle shows global average resolution.
Extended Data Figure 3
Cryo-EM analysis of TMEM16A solubilized in LMNG
a, A representative cryo-EM micrograph of LMNG-solubilized TMEM16A. Green circles
indicate individual particles. b, Representative 2D class averages from boxed particles
with a 256 pixels box size (261.12 Å) and TMEM16A in complex with Fabs (bottom row,
with the two right panels showing particles after subtraction of densities for Fabs).
c, Eular angle distribution of all particles included in the final 3D reconstruction.
The size of the spheres is proportional to the number of particles visualized from
that specific orientation. d, FSC curves of two independently refined maps before
(blue) and after (red) post-processing in RELION. Curves with resolution corresponding
to FSC = 0.143 are shown. e, Planar slices through the unsharpened EM density map
at different levels along the channel symmetry axis. f, Local resolution of TMEM16A
as estimated by RELION and shown with pseudo-color representation of resolution. g,
Cross-validation using FSC curves of the density map calculated from the refined model
versus half map 1 (work), versus half map 2 (free), and versus summed map. h, Directional
FSC (dFSC) from different Fourier cones. Each curve indicates a different direction.
dFSC for TMEM16A alone in LMNG in grey (average in yellow); dFSC for combination of
TMEM16A alone and with Fabs bound in LMNG in purple (average in red). i, Calculated
resolution from different views (grey for combination of TMEM16A alone and with Fabs
bound, yellow for TMEM16A alone). The directions are indicated as x, y, and z in the
3D resolution map. The highest and lowest resolutions are labeled with red and blue
circles respectively. The green circle shows global average resolution.
Extended Data Figure 4
Cryo-EM densities of the ten transmembrane helices of TMEM16A, summary of cryo-EM
data collection and processing, and summaries of sidechain assignments
a, Representative cryo-EM densities of the ten transmembrane helices (TM1-TM10) of
nanodisc-reconstituted TMEM16A (right) or LMNG-solubilized TMEM16A (left) are superimposed
on the corresponding atomic model. The EM densities are shown in blue meshes for nanodisc-reconstituted
TMEM16A, or green meshes for LMNG-solubilized TMEM16A, and the model is show as sticks
and colored according to atom type (C: light grey; N: blue; O: red; S: yellow). b,
Summary of cryo-EM data collection and model refinement. c, Summary of sidechain assignment
of TMEM16A in nanodiscs. d, Summary of sidechain assignment of TMEM16A in LMNG.
Extended Data Figure 5
Atomic models of TMEM16A in two conformations
a–c, Ribbon diagrams of TMEM16A reconstituted in nanodiscs (in green and yellow) with
lipids (in red), overlayed with EM density map (sharpened, in light grey). Two Ca2+
ions (orange spheres) are present in each monomer. d–f, Ribbon diagrams of TMEM16A
solubilized in LMNG (in blue) with lipids (in red), overlayed with EM density map
(sharpened, in light grey). One Ca2+ ion (orange sphere) is present in each monomer
g–i, EM densities of nanodisc-reconstituted TMEM16A (unsharpened, in green and yellow)
overlayed with digitonin-solubilized TMEM16A
12
(in grey).
Extended Data Figure 6
Anion selectivity depends on residues lining the pore surrounded by TM3–8 but not
TM10 residues at the dimer interface
a, Bi-ionic conditions for assessing the effect of the V595L mutation on permeability
ratios. b, Effects of different substitutions of V595 on the permeability ratio PI-/PCl-
(2.70 ± 0.09, N = 28 for WT; 4.00 ± 0.16, N = 9 for V595A; 3.49 ± 0.21, N = 6 for
V595K; 3.81 ± 0.07, N = 7 for V595L; 3.48 ± 0.14, N = 7 for V595R). c, Effects of
different substitutions of V595 on the permeability ratio PSCN-/PCl- (5.47 ± 0.21,
N = 28 for WT; 9.96 ± 0.30, N = 9 for V595A; 6.64 ± 0.58, N = 6 for V595K; 7.86 ±
0.37, N = 7 for V595L; 6.30 ± 0.37, N = 7 for V595R). d, Permeability ratios determined
in bi-ionic conditions for TMEM16A mutants. The exact n values (independent experimental
samples from individually recorded HEK293 cells) are given for every experiment. The
P-values are generated after a Dunnett’s posthoc test following one-way ANOVA. For
these multiplicity adjusted P-values, values smaller than 0.0001 cannot be estimated
precisely; Prism’s documentation suggests this approach is the most rigorous and conservative
way to generate a P-value from a multiple comparison test
53
.
Extended Data Figure 7
Comparisons of extracellular loops and lipids in nanodisc-resonstituted and LMNG-solubilized
TMEM16A. a–c, Lipids (in red) in the nanodisc-reconstituted TMEM16A (in green and
yellow, overlayed with EM density map in light grey) (b, c), with helical distortions
of TM6 near G640 (a). d–f, Lipids (in red) in LMNG-solubilized TMEM16A (in blue, overlayed
with EM density map in light grey) (e, f), with the lower half of TM6 beyond G640
disordered and hence absent from the reconstruction (d). g–i, Extracellular domains
of nanodisc-reconstituted TMEM16A (unsharpened, in green and yellow) overlayed with
those of LMNG-solubilized TMEM16A (unsharpened, in blue). j–l, Extracellular TM5-TM6
and TM9-TM10 loops in ribbon diagrams for nanodisc-reconstituted TMEM16A (in green
and yellow) overlayed with those of LMNG-solubilized TMEM16A (in blue).
Extended Data Figure 8
Data processing of TMEM16A in nanodisc (a) or LMNG (b). a, Data processing of nanodisc-reconstituted
TMEM16A. Particle picking was performed with Gautomatch with templates from 2D classes
from the LMNG dataset and generated 927,414 particles in total. All particles were
extracted and binned 4 (pixel size is 4.08 Å) and then 2D classified. 341,875 particles
from good 2D classes were used in 3D refinement with an initial model from the LMNG
structure low pass filtered to 60 Å, giving rise to a 5.5 Å map. The 5.5 Å map was
then low pass filtered to 10 Å as the initial model for 3D classification without
applied symmetry for all particles with a 1.02 Å pixel size. Of the seven classes,
two classes (15.92% and 11.15% of the 927,414 particles) gave maps with improved resolution
(4.7 Å and 5.1 Å respectively) after 3D auto-refinement with C2 symmetry. These two
classes were combined together yielding a total of 251,851 particles, and another
3D auto-refinement was run to generate the unmasked map at a resolution of 4.6 Å.
The map was then masked to get the final map at resolution of 3.8 Å. b, Data processing
of LMNG-solubilized TMEM16A. Approximately 4000 particles were manually picked and
classified by 2D classification in SAMUEL to generate the templates for automatic
particle picking with samautopick.py. 533,545 particles were identified after manually
inspection. The crystal structure of nhTMEM16A
10
(PDB: 4WIS) was converted to mrc with e2pdb2mrc.py and low pass filtered to 60 Å as
the initial model. 44 of 200 2D classes were used for 3D auto-refinement with C2 symmetry.
Since 3D classification failed for further separation, the reported resolution of
the final map was 3.8 Å. To reduce anisotropy due to underrepresentation of side views,
this dataset was merged with another dataset for Fabs bound to TMEM16A in LMNG. Starting
with 338,705 particles from automatic particle picking, 4 of 40 2D classes (132,444
particles) were used for 3D auto-refinement. Then the Fab density for each particle
was subtracted. The 132,444 subtracted particles without Fab density were combined
with the 342,875 particles from all 5 classes of TMEM16A in LMNG dataset with resolution
of 3.8 Å and processed for 3D auto-refinement to generate the unmasked map with resolution
of 3.9 Å. This map was then masked to get the final map at resolution of 3.4 Å. Pixel
sizes are shown in parenthesis for each class.
Extended Data Figure 9
Multiple open and closed states of TMEM16A calcium-activated chloride channel (CaCC)
and involvement of pore-lining residues in channel gating. a, Reduction from 150 mM
NaCl to 15 mM NaCl in the intracellular solution containing 1 μM or 1 mM Ca2+ caused
identical shift of reversal potential of wildtype TMEM16A but not K584Q mutant channels
in excised inside-out patch held at +80 mV and subjected to a ramp to −80 mV. Repeated
independently 8 times for WT with similar results, and 5 times for K584Q with similar
results. b, The K584Q mutation altered the permeability ratio PNa+/PCl- at 1 μM but
not 1 mM Ca2+. N = 8 for WT, N = 5 for K584Q. c, Calcium sensitivity of channel activation
of wildtype and mutant TMEM16A channels (number of independent experiments and P values
are given in this table). Permeability ratios for mutants were compared to those of
wild-type (WT) using one-way ANOVA followed by the Bonferroni post-hoc test for significance;
**** designates p < 0.0001; *** designates p < 0.001; ** designates p < 0.005; data
are presented as mean ± SEM.
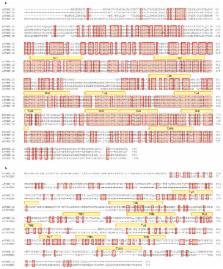
Extended Data Figure 10
Sequence alignment of TMEM16A homologues. a, Sequences of TMEM16A homologues were
analyzed by Clustal omega. Conserved residues are highlighted. Transmembrane helices
are indicated above the sequences. The residues that were shown in this study (D550,
N587, S635, Q705 and F712) and previous studies (R511, K584 and K599) to be crucial
for selectivity are marked in orange and blue respectively. The residues (I546, Y589,
I592, L639 and F708) that were shown in this study to be critical for gating are marked
in green. The residues (N542 and V595) that contributed to both selectivity and gating
property is marked in purple. The residues (E650, E698, E701, E730 and D734) important
for Ca2+ binding are marked in red. b, Sequence alignment of mouse TMEM16A and nhTMEM16.
Conserved residues are highlighted. Transmembrane helices of TMEM16A are indicated
above the sequence.
Related collections
Most cited references31
- Record: found
- Abstract: found
- Article: not found
Structure of the TRPV1 ion channel determined by electron cryo-microscopy
Maofu Liao, Erhu Cao, David Julius … (2013)
- Record: found
- Abstract: found
- Article: not found
TMEM16A confers receptor-activated calcium-dependent chloride conductance.
Young Duk Yang, Hawon Cho, Jae Koo … (2008)
- Record: found
- Abstract: found
- Article: not found
TMEM16A, a membrane protein associated with calcium-dependent chloride channel activity.
Antonella Caputo, Emanuela Caci, Loretta Ferrera … (2008)