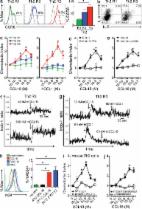
Chemokines are chemotactic cytokines that guide the directed migration of leukocytes in the steady-state and in inflammation through a subfamily of seven-transmembrane spanning G protein–coupled receptors. The CC chemokine ligand (CCL) 18 was identified in the late 1990s by several groups as a gene highly expressed in the lung and induced in alternatively activated macrophages (AAMs) and thus initially given the names PARC (pulmonary and activation-regulated chemokine), AMAC-1 (alternative macrophage activation-associated CC chemokine-1), DC-CK1 (dendritic cell chemokine 1), and macrophage inflammatory protein (MIP) 4 (Adema et al., 1997; Hieshima et al., 1997; Kodelja et al., 1998). CCL18 is highly expressed in many human chronic inflammatory diseases, which include pulmonary fibrosis and certain cancers, and a wide range of allergic diseases (Pivarcsi et al., 2004; Schutyser et al., 2005; de Nadaï et al., 2006; Chen et al., 2011; Lucendo et al., 2011). In some diseases, the level of circulating CCL18 has been demonstrated to be a biomarker for disease activity and outcome (Prasse et al., 2009). In patients with systemic sclerosis, for instance, levels of CCL18 have been associated with the complication of interstitial lung disease, and in patients with idiopathic pulmonary fibrosis and certain cancers, levels of CCL18 have been correlated with poor outcomes (Prasse et al., 2007, 2009; Chen et al., 2011). Understanding the role of CCL18 in these diseases has been hampered by the lack of an identified receptor and by the lack of a known murine orthologue. CCL18 is secreted primarily by cells of the myeloid lineage and has been identified in alveolar macrophages, tolerogenic dendritic cells, AAMs, and keratinocytes (Hieshima et al., 1997; Kodelja et al., 1998; Pivarcsi et al., 2004; Bellinghausen et al., 2012). In macrophages, CCL18 is induced by the Th2 cytokines IL-4 and IL-13, which program macrophages to differentiate into AAMs (Kodelja et al., 1998). AAMs contribute to the healing phase of acute inflammatory reactions and to tissue remodeling and fibrosis in chronic inflammatory diseases. Concordant with the spectrum of AAM activity, the abundance of CCL18 has been found to correlate with disease severity in fibrotic diseases, such as pulmonary fibrosis and scleroderma, and diseases of dysregulated macrophage biology (Schutyser et al., 2005; Prasse et al., 2007, 2009). In allergic diseases, increased CCL18 is also frequently associated with eosinophil infiltration in affected tissues (Pivarcsi et al., 2004; Schutyser et al., 2005; de Nadaï et al., 2006; Lucendo et al., 2011). CCL18 activity has been detected on peripheral blood lymphocytes (Adema et al., 1997; Hieshima et al., 1997). However, studies using cells transfected with CCR1-7, CXCR1-4, and CX3CR1 did not reveal a specific CCL18 signaling receptor but did find that CCL18 could antagonize CCR3 (Hieshima et al., 1997; Nibbs et al., 2000). Investigation into atopic dermatitis and allergic diseases enabled the first identification of a specific T cell subset that responded to CCL18, and thus provided clues to its possible chemokine receptor (Günther et al., 2005; de Nadaï et al., 2006). In atopic dermatitis, CCL18 is the most abundantly expressed chemokine in lesional skin (Pivarcsi et al., 2004; Günther et al., 2005). CCL18 bound to blood skin-tropic cutaneous leukocyte antigen expressing (CLA+) memory T cells from individuals with atopic dermatitis and induced migration of CD4+ T cell clones derived from atopic dermatitis lesional skin in vitro and into human skin transplanted in SCID mice in vivo (Günther et al., 2005). The signature homing receptors of skin-tropic T cells are CLA in combination with the chemokine receptors CCR4, CCR10, and CCR8 (Schaerli et al., 2004; Islam et al., 2011). More CCR8-expressing cells are found in inflamed skin of individuals with active atopic dermatitis compared with skin of healthy individuals (Gombert et al., 2005). In studies of human asthma, CCL18 was found to induce the migration of TCR-activated in vitro differentiated human Th2 cells (de Nadaï et al., 2006). CCL18 induced migration of human peripheral blood Th2 cells and regulatory T cells ex vivo (Bellinghausen et al., 2012; Chenivesse et al., 2012). Th2 but not Th1 cells are programmed to selectively express the chemokine receptors CCR4 and CCR8, a receptor profile shared with regulatory T cells (D’Ambrosio et al., 1998; Wei et al., 2010). Skin-homing CLA+ T cells, Th2 cells, and regulatory T cells thus all express CCR4 and CCR8. However, TCR activation is a prerequisite for functional CCR8 but not CCR4 expression on in vitro differentiated Th2 cells (D’Ambrosio et al., 1998). Here, we report that CCL18 is an endogenous agonist of the human CCR8 receptor. RESULTS AND DISCUSSION CCL18 induced migration of CCR8-transfected cells We assayed the ability of 4DE4 mouse pre–B cell lines transfected with human CCR8 to chemotax to CCL18 and observed peak migration at 10 nM (Fig. 1 a). Untransfected 4DE4 cells exhibited migration to CXCL12 (not depicted), but not to CCL18 (Fig. 1 a) or the known human CCR8 chemokine agonist CCL1 (also called I-309; Fig. 1 b). CCL1 also induced a peak migration of CCR8 transfectants at 10 nM but with a more robust response (Fig. 1 b). CCL18-induced chemotaxis in CCR8-transfected cells was inhibited by pertussis toxin (PTX), indicating that CCL18 induced the specific coupling of CCR8 to Gαi (Fig. 1 c). Checkerboard-type chemotaxis analysis revealed that CCL18 stimulated chemotaxis rather than chemokinesis (Fig. 1 d). CCL18 did not antagonize chemotaxis of CCR8-transfected cells to CCL1 when both chemokines were present in the bottom chamber in transwell chemotaxis assays (Fig. 1 e). Figure 1. CCR8 is sufficient for CCL18-induced migration. (a and b) Dose–response chemotaxis of hCCR8-transfected and untransfected 4DE4 cells to CCL18 (a) and hCCL1 (b). (c) Chemotaxis of PTX treated hCCR8-transfected cells to CCL18 (*, P 15 eosinophils per 40× high power field (hpf) in at least one esophageal biopsy (of a total six obtained from the proximal, middle, and distal esophagus) despite a minimum 6-wk course of high dose proton pump inhibitors (Liacouras et al., 2011). EoE patients in remission were on either elimination diet or on topical steroid treatment, and esophageal biopsy samples contained fewer than five eosinophils/hpf in all six biopsies. All human subject protocols were approved by the Partners Institutional Review Board. Informed consent was obtained from all study participants. Mice. C57BL/6 mice were purchased from the National Cancer Institute (Bethesda, MD). CCR8−/− mice (from S. Lira, Mount Sinai School of Medicine, New York) in the C57BL/6 background were housed under specific pathogen-free conditions. All protocols were approved by the Massachusetts General Hospital Subcommittee on Research Animal Care. Human and mouse CCR8 receptor–transfected cells. Limiting dilution clones were generated from a CCL18-responsive CCR8-transfected 4DE4 cell line (provided by J. Pease, Imperial College, London, UK) grown in low concentrations of G418 (0.1–0.4 mg/ml; Tiffany et al., 1997). We found that these clones responded better to CCL18 when grown in low G418 concentrations (and, in fact, seemed to lose activity at G418 concentrations ≥1 mg/ml) and were therefore maintained in 0.1 mg/ml G418. 4DE4 cells were provided by P. Murphy (National Institutes of Health, Bethesda, MD). hCCR8-L1.2 transfected cell line was provided by M. Locati and A. Mantovani (University of Milan, Milan, Italy). Cells were treated with 5 mM butyric acid overnight in some calcium flux, binding, and chemotaxis assays to increase surface expression of CCR8. Mouse Ccr8-transfected Baf/3 cells were generated as previously described (Islam et al., 2011). Generation of human monocyte-derived DCs. DCs were generated from PBMCs isolated from fresh human buffy coats by Histopaque-1077 density gradient (Sigma-Aldrich). PBMCs were resuspended in C10 media (RPMI complete medium with 10% fetal calf serum) and incubated for 2–3 h at 37°C and washed gently with PBS. The remaining adherent cells were cultured in 10 ml C10 media supplemented with 50 ng/ml of GM-CSF (BioLegend) and 50 ng/ml IL-4 (PeproTech) at 37°C. Additional GM-CSF and IL-4 was added on days 2, 4, and 5. On day 6, DCs were rested for 24 h after change of media, and then incubated with C10 media containing 100 ng/ml of LPS (Sigma-Aldrich) for 24–48 h. Generation of Th2 cells and induction of highly polarized Th2 cells. CD4+ T cells were isolated from Histopaque-1077 density gradient PBMCs by two negative selection columns: (1) CD4+ T cell Biotin Antibody Cocktail (Miltenyi Biotec), followed by incubation with anti-biotin microbeads (Miltenyi Biotec) to isolate CD4+ T cells; and (2) CD45RO PE (BD) staining, followed by incubation with anti-PE microbeads to isolate naive (CD45RO−) CD4+ T cells. DCs and T cells were cultured in C10 media with 50 ng/ml IL-4 and 10 µg/ml anti–IFN-γ (BioLegend) for 5 d at 37°C. At day 5, new C10 supplemented with 250 ng/ml IL-2 (Roche) was added. For repolarization of Th2 cells at day 7 to generate Th2 R2 cells, Th2 R1 cells were repolarized with irradiated human PBMCs, 1 µg/ml anti-CD3 (BioLegend), 1 µg/ml anti-CD28 (BioLegend), 50 ng/ml IL-4, and 10 µg/ml anti–IFN-γ (BioLegend). A similar procedure was used to generate Th2 R3 cells from Th2 R2 cells. Prior to assays, Th2 cells were activated with 2 µg/ml plate-bound mAb to CD3 and 1 µg/ml soluble mAb to CD28 for 24 h. Cells were then washed, replated, and rested for 4–6 h in low–IL-2 medium for migration or IL-2–free medium for calcium flux. Highly polarized and activated mouse Th2 cells were generated for chemotaxis assays in a similar manner as previously described (Islam et al., 2011). Generation and activation of human and mouse macrophages. Human monocytes were isolated from peripheral blood by negative selection with the monocyte isolation kit II (Miltenyi Biotec) and differentiated into macrophages by culturing in the presence of 50 ng/ml m-CSF (PeproTech) in C10 media for 7 d in 24- or 12-well plates. Human AAMs were obtained by culturing these macrophages in fresh C10 supplemented with 25 ng/ml IL-4 (PeproTech), 10 ng/ml IL-10 (Miltenyi Biotec), and 20 ng/ml TNF (Miltenyi Biotec) for an additional 24–72 h. Bone marrow cells isolated from femurs and tibias were cultured in non–tissue culture–treated 100-mm bacterial culture Petri dishes (Thermo Fisher Scientific) in C10 media supplemented with 10 ng/ml murine M-CSF (PeproTech) and fed with fresh media on days 4 and 8. Cells were harvested at day 8 and replated in 24- or 12-well plates in M-CSF–containing media and stimulated with 20 ng/ml IL-4, 10 ng/ml IL-10, and 20 ng/ml TNF and harvested after 24 or 72 h. Quantitation of integrin LFA-1 activation in highly polarized Th2 cells. Prior to assays, human Th2 cells were activated with 2 µg/ml plate-bound mAb to CD3 and 1 µg/ml soluble mAb to CD28 for 24 h. Cells were then washed, replated, and rested for 4–5 h in low–IL-2 medium before assays. For LFA-1 activation assays, cells were washed and stained in 1% human serum/RPMI with 10 µg/ml mAb24 (Hycult Biotech) in the presence of 200 nM CCL18, 200 nM CXCL12, or 50 ng/ml PMA or in the absence of stimulation for 30 min at 37°C, washed, and then stained with 1 µg/ml secondary goat anti–mouse PE for 20 min, washed, fixed, and acquired on a FACSCalibur. As a control, CD3/CD28-activated Th2 cells were stained with 10 µg/ml mAb24 in the presence of 200 nM CCL18 at 4°C for 30 min, followed by secondary antibody staining. As an additional control, Th2 cells that were not activated with CD3/CD28 were stimulated with 200 nM CCL18 and stained with 10 µg/ml mAb24 antibody at 37°C for 30 min followed by secondary antibody staining. CCL18 did not induce m24 epitope expression on these resting Th2 cells. Flow cytometry and intracytoplasmic cytokine staining. For CCR8 staining, cells were stained with the 433H mAb to human CCR8, which was purified from the hybridoma (American Type Culture Collection), followed by PE-conjugated goat anti–mouse IgG(H+L) (SouthernBiotech; Islam et al., 2011). Intracytoplasmic staining was performed using a standard protocol (Islam et al., 2011). Briefly, cells were stained with PE-conjugated mAb to IL-4 and allophycocyanin-conjugated mAb to IL-5 (BD), or appropriate fluorochrome-conjugated IgG1κ isotype-control (BD). Cells were acquired on a FACSCalibur and analyzed with FlowJo (9.5.2). Chemotaxis assays. CCR8-transfected cells, untransfected cells, and human Th2 cells (2.5 × 10⁴-105 per well) in RPMI containing 0.5% BSA were placed on the top of a 96-well ChemoTx chemotaxis apparatus with 5-µm pores (NeuroProbe). CCL18, human CCL1, and CXCL12 (R&D Systems) were added to the bottom well. For “checkerboard-type” chemotaxis assays, CCL18 was added to the top well in varying concentrations. The apparatus was incubated at 37°C and 5% CO2 for 3–4 h, and the cells migrating at each concentration of chemoattractant were counted using an inverted microscope at the end of the experiment or after fixation with 10% buffered formalin. The number of cells migrating at each concentration of chemokine was normalized to the number of cells migrating in the presence of medium alone (chemokinesis) to calculate the chemotactic index for each leukocyte type. PTX (Sigma-Aldrich) or the 433H neutralizing mAb to human CCR8 was used in some assays (Islam et al., 2011). Calcium flux assays. CCL18, human CCL1 and CXCL12, or vMIP-I (R&D Systems) were used in calcium flux assays. Calcium flux assays were performed on a UV laser–equipped 13-color LSR II flow cytometer (BD) as previously described (Islam et al., 2011). Indo-1 AM (Molecular Probes) fluorescence was analyzed with the UV A detector at 530/30 and UV B detector at 440/40 for free and bound probe with Indo-1 (blue) and Indo-1 (violet), respectively. Data were analyzed with standardized settings using the calcium flux kinetic software analysis platform of FlowJo (8.8). Receptor binding assays. Binding assays were performed with 100,000 cells in a total volume of 100 µl binding buffer in 0.65 µm 96-well Durapore glass fiber filter plates (EMD Millipore) that were first wetted with binding buffer before assays. Binding buffer consisted of 50 mM Hepes, 1 mM CaCl2, 5 mM MgCl2, 0.5% BSA, and 125 mM NaCl, adjusted to a pH of 7.22 for competition binding experiments with 125I-hCCL1, and adjusted to a pH of 7.4 with the addition of 0.05% sodium azide for competition binding experiments with 125I-hCCL18. Cells were grown to log phase to a concentration of 1.2–1.7 million/ml at the time of the assay. Binding assays were performed for 1.5 h with continuous shaking at 140 rpm, and were performed at room temperature and at 37°c for experiments with 125I-hCCL1 and 125I-CCL18, respectively. At the end of the assay, plates were washed four times with ice-cold binding buffer. Radioactivity was counted after addition of scintillation fluid in a TopCount NXT counter (Perkin-Elmer). 125I-hCCL1 and 125I-CCL18 were purchased from Perkin-Elmer. Because CCL18 had been reported to self-aggregate at high concentrations (Hieshima et al., 1997), we adapted published binding protocols used for other chemokines also reported to self-aggregate, such as CCL5 and CCL3, to perform our direct competition binding experiments with 125I-CCL18. Binding data were analyzed with Prism 5 (GraphPad Software). Internalization assays. Flow cytometry using the 433H CCR8 mAb was used to evaluate CCR8 receptor internalization. 5 × 10⁶ cells CCR8-transfected 4DE4 cells were resuspended in 100 µl of ice-cold culture medium in duplicate, followed by addition of varying concentrations of CCL18, hCCL1, or hCCL17 (R&D Systems). One sample was incubated for 20 min at 37°C, whereas the other was kept at 4°C before washing, staining, and receptor expression analysis by flow cytometry. Receptor expression was calculated using the following equation: 100 × [(mean fluorescence of chemokine treated cells at 37°C − mean fluorescence of negative control cells)/(mean fluorescence of chemokine treated cells at 4°C − mean fluorescence of negative control cells)], where negative control cells were buffer-treated cells. To determine the kinetics of surface and total CCR8 expression, 5 × 10⁶ cells were resuspended in 100 µl of ice-cold culture medium in duplicate, followed by the addition of 10−8 M CCL18, 10−8 M CCL1, or media at 37 or 4°C). One set of samples was directly stained for CCR8 (surface CCR8), whereas the other was fixed and permeabilized and stained for CCR8 (total CCR8). The difference between total and surface CCR8 was defined as internalized CCR8. Change in expression of CCR8 is shown as the ratio of mean fluorescence (mean fluorescence of CCR8 + ligand/mean fluorescence of negative control). As controls, no significant internalization was seen when CCR8-transfected cells were stimulated with CCL18 and hCCL1 at 4°C or in cells incubated with media at 37°C. RNA extraction and RT-PCR analysis for esophageal specimens and macrophages. Total RNA was extracted from cryopreserved esophageal biopsy samples using mirVana Isolation Kit (P/N: 1560; Ambion) according to the manufacturer’s protocol. Power SYBR green qRT-PCR assay (Applied Biosystems) was used for mRNA quantification using StepOnePlus Real-Time PCR System (Applied Biosystems). The following primers were used: CCL26, 5′-CCAAGACCTGCTGCTTCCAA-3′ and 5′-GAATTCATAGCTTCGCACCCA-3′; CRTH2, 5′-AAAAGGCTCGGGAAGGTTAAATG-3′ and 5′-ACCGGGGAACCAAGAGAGAG-3′; CCR8, 5′-GGTCATCCTGGTCCTTGTGG-3′ and 5′-CAGGGCCAGGTTCAAGAGG-3′; CCR3, 5′-GCAAGCATCTGGACCTGGTC-3′ and 5′-GGTTCATGCAGCAGTGGGA-3′; CCL1, 5′-TGCAGATCATCACCACAGCC-3′ and 5′-GTCCACATCTTCCGGCCA-3′; CCL18, 5′-TGGCAGATTCCACAAAAGTTCA-3′ and 5′-GGATGACACCTGGCTTGGG-3′; and GAPDH, 5′-GAAGGTGAAGGTCGGAGTC-3′ and 5′-GAAGATGGTGATGGGATTTC-3′. Using the comparative Ct method, relative gene expression was calculated as 2−ΔΔCt where ΔCt = Ct (gene of interest) − Ct (normalizer = GAPDH) and the ΔΔCt = Ct (sample) − Ct (calibrator = mean ΔCt of normals). Harvested mouse and human macrophages were harvested and stored in RLT buffer and purified RNA was isolated using the RNeasy kit (QIAGEN). Real-time PCR was performed as above with the mouse and human primers described below. Mouse primers: Arg1, 5′-CAGAAGAATGGAAGAGTCAG-3′ and 5′-CAGATATGCAGGGAGTCACC-3′; Ym1, 5′-TCACAGGTCTGGCAATTCTTCTG-3′ and 5′-TTTGTCCTTAGGAGGGCTTCCTCG-3′; Fizz1, 5′-GGTCCCAGTGCATATGGATGAGACCATAGA-3′ and 5′-CACCTCTTCACTCGAGGGACAGTTGGCAGC-3′; Ccl8, 5′-TCTACGCAGTGCTTCTTTGCC-3′ and 5′-AAGGGGGATCTTCAGCTTTAGTA-3′; Ccl17, 5′-CCCATGAAGACCTTCACCTC-3′ and 5′-CATCCCTGGAACACTCCACT-3′; and Gapdh, 5′-GGCAAATTCAACGGCACAGT-3′ and 5′-AGATGGTGATGGGCTTCCC-3′. Human primers: CCL18, 5′-GGTGTCATCCTCCTAACCAAGAGA-3′ and 5′-GCTGATGTATTTCTGGACCCACTT-3′; and CCL17, 5′-CCATCGTTTTTGTAACTGTGCAG-3′ and 5′-TGCATTCTTCACTCTCTTGTTGTTG-3′. Statistical analysis. Statistical analysis was performed using Student’s unpaired two-tailed t test for means, except where indicated in Fig. 1 e (two-way ANOVA to assess the effect of multiple concentrations of CCL18 on CCL1-induced chemotaxis), Fig. 3 c (two-way ANOVA to compare the binding displacement of 125I-CCL18 by multiple concentrations of cold CCL18 and cold CCL1 to that induced by the non-CCR8 ligand CCL3), and Fig. 5 e (Mann-Whitney U test for nonparametric comparison of means among normal controls, patients with inactive EoE, and patients with active EoE). Spearman’s correlation coefficients were used for nonparametric testing of statistical dependence between pairs of predefined EoE-associated variables. P < 0.05 was considered significant. Online supplemental material. Table S1 shows a summary of study subjects who underwent endoscopic biopsy after being referred for suspected reflux or EoE. Online supplemental material is available at http://www.jem.org/cgi/content/full/jem.20122842/DC1. Supplementary Material Supplemental Material