- Record: found
- Abstract: found
- Article: found
Complete Genome Sequence and Genomic Characterization of Lactobacillus acidophilus LA1 (11869BP)
data-paper
Won-Hyong Chung
1 ,
Jisu Kang
1
,
2 ,
Mi Young Lim
1 ,
Tae-joong Lim
3 ,
Sanghyun Lim
3 ,
Seong Woon Roh
4 ,
Young-Do Nam
1
,
2
08 February 2018
Read this article at
There is no author summary for this article yet. Authors can add summaries to their articles on ScienceOpen to make them more accessible to a non-specialist audience.
Abstract
Introduction
Our body has natural defense systems to protect against potentially harmful microbes,
including the physical and chemical barriers of the intestinal epithelium (Corfield
et al., 2000). The physical barrier of the intestinal epithelium protects the host
against pathogenic microbes (Anderson et al., 1993), and the intestinal mucosa coated
with mucus excretes pathogens from the intestinal tract (Corfield et al., 2000).
The gut microbiota also controls the number of enteric pathogens by producing anti-microbial
molecules, such as proteinaceous bacteriocins (Kamada et al., 2013), and by inhibiting
the proliferation of pathogens by generating organic acids-short chain fatty acids
(SCFAs) that lower the local pH (Shin et al., 2002), and by regulating the expression
of virulence genes in certain pathogenic bacteria, such as Salmonella (Gantois et
al., 2006). Moreover, the gut microbiota indirectly prevents pathogenic infection
by enhancing the functions of the host mucosal barrier and innate immune system (Kobayashi
et al., 2005). Therefore, in a healthy gastrointestinal tract, host cells and the
gut microbiota synergistically protect the host from pathogenic infections.
The human intestinal tract harbors a dense population of resident microbiota, consisting
of bacteria, archaea, viruses, and fungi. Host genetics, diet, and environmental insults
can affect the gut microbial composition (Human Microbiome Project Consortium, 2012),
and disruption of the gut microbiota can lead to invasion and overgrowth of certain
pathogenic bacteria, such as virulent Escherichia coli, Salmonella enterica serovar
Typhimurium, and Clostridium difficile (Bohnhoff et al., 1954; Rupnik et al., 2009;
Ayres et al., 2012). In particular, the use of antibiotics can lead to a temporary
or long-term reduction of bio-diversity, and this change in the gut microbiota, called
dysbiosis, increases susceptibility to microbial infection and the proliferation of
antibiotic-resistant strains (Vangay et al., 2015).
On the other hand, probiotics have been also considered for the treatment or prevention
of diverse infectious diseases, and previous studies have reported the successful
treatment of infection by pathogenic bacteria, including Escherichia, Klebsiella,
Shigella, Enterobacter, Pseudomonas, Clostridium, Helicobacter, etc., (Kabir et al.,
1997; Brashears et al., 1998; Forestier et al., 2001; Ogawa et al., 2001). Therefore,
the use of probiotics could be an alternative strategy for the treatment or prevention
of infectious disease that avoids the gut microbiota dysbiosis associated with antibiotic
treatment.
In our previous study, we reported that Lactobacillus acidophilus strain LA1 (11869BP),
an isolate from a dairy product, had preventive effects against Salmonella infection
(Kim et al., 2013). While the anti-pathogenic effects of various probiotics have been
widely demonstrated, the exact mechanism of action is not well understood. In addition,
our genomic knowledge of L. acidophilus strains is insufficient because only five
complete L. acidophilus genomes including LA1 are currently available in NCBI database
(https://www.ncbi.nlm.nih.gov/genome/). Therefore, to gain better insight into its
probiotic and Salmonella infection-preventing effects, we sequenced and analyzed the
genome of L. acidophilus LA1. The availability of this genomic information will allow
for further in-depth analysis and a better understanding of the probiotic functions
of L. acidophilus strains for the prevention of pathogenic infections.
Materials and methods
Bacterial growth, DNA extraction, and sequencing
In our previous study, we isolated L. acidophilus LA1 from a fermented dairy product
in Korea (Kim et al., 2013). To analyze the genomic content of strain LA1, we cultivated
the bacteria in MRS medium (Difco, USA) at 37°C for 18 h. Genomic DNA was extracted
and purified using the QIAamp DNA Mini Kit (Qiagen, Germany). The extracted genomic
DNA was quantified with a NanoDrop 2000 UV-Vis spectrophotometer (Thermo Scientific,
USA) and Qubit 2.0 fluorometer (Life Technologies, USA). The genome of L. acidophilus
LA1 was sequenced with the PacBio RS II (Menlo Park, USA) sequencing platform.
Gene annotation
Genome assembly was performed using HGAP 3.0 (Chin et al., 2013), with default options.
The start position of the chromosome was determined by the location of the gene encoding
the chromosomal replication initiation protein, dnaA, as well as the GC skew pattern.
Annotation of this genome was carried out with the NCBI Prokaryotic Genome Annotation
Pipeline (PGAAP) (Tatusova et al., 2016). From the ASN.1-formatted annotation file,
the protein-coding genes and rRNA genes were extracted using the NCBI toolbox (http://www.ncbi.nlm.nih.gov/IEB/ToolBox).
Coding genes were assigned to COG categories using BLASTP and the COG database (Galperin
et al., 2015), with an e-value cutoff of 1e-3.
Pan-genome comparison
Nine complete genome sequences that belong to L. acidophilus group were selected for
phylogenetic and comparative analysis: L. acidophilus NCFM (assembly accession: GCF_000011985.1),
L. acidophilus La-14 (GCF_000389675.2), L. acidophilus FSI4 (GCF_000934625.1), L.
gallinarum HFD4 (GCF_001314245.2), L. helveticus CNRZ32 (GCF_000422165.1), L. crispatus
ST1 (GCF_000091765.1), L. kefiranofaciens ZW3 (GCF_000214785.1), L. amylovorus GRL1118
(GCF_000194115.1), and L. acetotolerans NBRC 13120 (GCF_001042405.1). L. acetotolerans
NBRC 13120 was used as the out-group in the phylogenetic analysis. The three L. acidophilus
genomes (NCFM, La-14, and FSI4) and the present sequenced genome, L. acidophilus LA1,
were used for the comparative analysis.
A phylogenetic tree based on the 16S gene sequences was constructed by the maximum
likelihood method based on the Tamura-Nei model (Tamura and Nei, 1993). Orthologous
average nucleotide identity (OrthoANI) between genome sequences was computed (Lee
et al., 2016). To obtain genomic distance, the OrthoANI values were converted to distance
values with the following formula: distance = 1 – (OrthoANI/100). Evolutionary distance
was computed from the genome-distance matrix using the neighbor-joining method (Saitou
and Nei, 1987). The tree is drawn to scale, with branch lengths presented in the same
units as those for the evolutionary distances used to infer the phylogenetic tree.
The phylogenetic tree was generated using MEGA6 (Tamura et al., 2013).
A pan-genomic study was performed to investigate the functional conservation in the
sequenced genome by using GET_HOMOLOGOUS (Contreras-Moreira and Vinuesa, 2013). COG
triangles was used as the clustering method, and a minimum of 50% amino acid identity
and 50% coverage were used for the clustering threshold.
Carbohydrate active enzymes (CAZymes) were searched by using the CAZymes analysis
tool kit (Park et al., 2010; Lombard et al., 2014). Different CAZy families were used
to identify the key enzymes related to polysaccharide degradation: glycoside hydrolases
(GHs), glycosyl transferases (GTs), carbohydrate esterases (CEs), auxiliary activities
(AAs), and carbohydrate-binding modules (CBMs).
Bacteriocins were predicted with BAGEL 3 which is a web service for bacteriocin searches
that uses a bacteriocin mining tool (Van Heel et al., 2013). BAGEL 3 is based on three
types of databases: modified bacteriocins, unmodified bacteriocins, and post-translationally
modified peptides.
Unique genomic features
The CRISPR regions were identified with a CRISPR on-line detection tool, CRISPR finder
(Grissa et al., 2007). The sequences of dicers and spacers were downloaded from the
analysis server after the finding computation. Aligned pairs of spacers in L. acidophilus
NCFM and LA1 were obtained by running BLASTN without the dust masking option. The
numerical order of spacers in LA1 followed the order in NCFM. To find counterparts
for the spacers, a BLASTN search was performed against the NCBI NT and NR database
(downloaded on 16 May, 2017), with no dust option and an e-value of 0.1. The search
result was filtered with 90% identity and 80% coverage.
Prophage insert regions were detected with an on-line phage search tool, PHASTER (Arndt
et al., 2016). The genomic structure of the inserted prophage and the associated genes
were obtained from the computation result. The detected ORFs were annotated based
on the highest hit in a BLAST search against the annotated bacterial genome database
in the PHASTER system.
Results and discussion
Genome features
Overall features of the LA1 genome
We obtained the complete genome sequence of L. acidophilus LA1 using SMRT sequencing,
which showed that the genome is composed of a 1.99-Mbp circular chromosome with 34.7%
G+C content (Table 1). A total of 1,953 genes were identified in the LA1 genome, including
1,844 protein-coding genes, 76 RNA genes, and 33 pseudo genes. Four sets of ribosomal
RNA genes, including 5S, 16S, and 23S genes, were also found. Other RNA genes, including
61 tRNA genes and three non-coding RNA (or ncRNA) genes were found. We also found
ncRNA-coding sequences in L. acidophilus NCFM, even though they were not reported
in the genome annotation. We hypothesized that these ncRNAs were absent from the annotation
because of the difference in the annotation methods, since these types of ncRNA genes
were recently introduced in the annotation system (PGAAP 3.1 and above). These genomic
features of LA1 are shown in Figure 1A.
Table 1
Genome features of Lactobacillus acidophilus LA1.
Attribute
Values
Accession number
CP017062
Genome size (bp)
1,991,195
No. of sequences
1 chromosome (0 plasmid)
Assembly status
Complete
Genes
1,953
Coding genes
1,844
RNA genes
76
rRNAs (5S, 16S, 23S)
12 (4, 4, 4)
tRNAs
61
ncRNAs
3
Pseudo genes
33
CRISPRs
1
Phage insertion
1
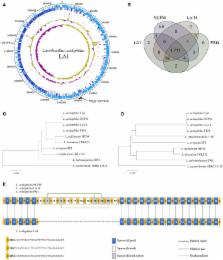
Figure 1
(A) Circular map of the Lactobacillus acidophilus LA1 genome. Tracks (from outset):
forward-strand coding CDS, reverse-strand coding CDS, pseudogenes, rRNAs, tRNAs, G+C
content, and GC skew. (B) Venn diagram of the shared gene clusters among the four
L. acidophilus genomes. (C) Phylogenetic tree of the L. acidophilus groups based on
16S rRNA genes and (D) phylogenetic tree based on genome-wide identities (ANI). (E)
Comparison of the CRISPR structure in LA1 and the other L. acidophilus genomes. Yellow
circles indicate the dicers. The blue, white, and gray boxes represent the spacers
that are aligned in LA1, the spacers deleted in LA1, and the deleted repeat spacers
in LA1, respectively. A dashed line fills the deleted region in LA1. Vertical lines
indicate aligned pairs of spacers. Green lines link the repeat spacers.
Functional classification of LA1
Functional classifications of the protein-coding genes of LA1 were categorized into
26 COG functional codes (Supplementary Figure S1, Supplementary Table S2). Of the
1,844 protein-coding genes in LA1, 1,553 were assigned to COG, and 291 genes were
not assigned. Because 135 genes were assigned multiple codes, the number of COG codes
was 1,705. The percentage of proteins with unknown function, including “General function
prediction only (R),” “Function unknown (S),” and “Not assigned (–),” was 29.3%. The
four analyzed L. acidophilus strains, including LA1, have nearly identical numbers
of functional genes, and they showed >99% genomic identity (Supplementary Table S3).
Comparative analysis of the L. acidophilus group
Phylogenetic comparison
Lactobacillus acidophilus strains including LA1 showed high conservation each other
by comparison of the L. acidophilus group (Bull et al., 2013, 2014), a subgroup of
Lactobacillus. A comparative study of the 10 complete genomes in the L. acidophilus
group was performed to confirm the genomic distance based on the 16S rRNA genes and
average nucleotide identity (ANI). The genomic similarities ranged from 75 to 99.9%,
and the similarities based on the 16S rRNA genes ranged from 94 to 100% (Supplementary
Table S3). Four L. acidophilus strains were located on the same node of the both 16S
rRNA phylogenetic and ANI trees (Figures 1C,D). Those genomes had identical 16S rRNA
sequences and very similar ANI values (≥99%); therefore, the L. acidophilus genomes
were difficult to distinguish by sequence similarity. We found different phylogenetic
relationships between the 16S rRNA sequence-based and ANI value-based phylogenetic
trees. L. gallinarum and L. helveticus were the closest to L. acidophilus on the 16S
rRNA phylogenetic tree (Figure 1C). However, L. amylovorus was the closet to L. acidophilus
on the ANI phylogenetic tree (Figure 1D). Phylogenetic studies using ANI better reflect
the functional relationship between strains than studies based on 16S rRNA sequences,
as shown by the statistics for COG categories. L. gallinarum and L. helveticus (marked
as triangles in Supplementary Figure S1) showed distinguishable profiles when compared
to the L. acidophilus genomes, and there was a greater than five-fold difference in
“Mobilome: prophages, transposons (X).”
Pan-genome analysis
To obtain better insight into the specific features of LA1, we compared LA1 to nine
complete genomes in the L. acidophilus group (Supplementary Table S1). A distinguishing
feature of the four L. acidophilus genomes (LA1, NCFM, La-14, and FSI4) was the lower
G+C content (2–3%) compared to the other species. Gene clustering was performed to
determine the differences between these 10 genomes based on COG functional annotation
(Supplementary Table S4). The genes were categorized into 3,810 functional clusters
using the pan-genome analysis program, GET_HOMOLOGOUS. The four L. acidophilus genomes
were compared by orthologous protein clustering to determine the LA1-specific genes
(Figure 1B). Among the total 1,955 gene clusters, we found 1,717 core gene clusters.
Only two gene clusters were identified as LA1 strain specific. Even though there were
high similarities between the L. acidophilus genomes, four gene clusters were absent
in the LA1 genome. Among the other L. acidophilus strains, 125 gene clusters were
unique; 56 clusters belonged to NCFM, and the 69 clusters belonged to the other strains.
Carbohydrate-active enzymes (CAZymes)
Carbohydrate active enzymes (CAZymes) analysis showed that LA1 contains 344 genes
in the five CAZymes gene families (Supplementary Table S5); 148 glycoside hydrolase
(GH) genes, 130 glycosyl transferase (GT) genes, 25 carbohydrate esterase (CE) genes,
11 auxiliary activity (AA) genes, and 30 CBMs. These numbers of carbohydrate-active
enzymes were relatively larger than those in Lactobacillus plantarum, which is an
important probiotic species. For example, L. plantarum KLDS1.0391 contains only 34
GHs, 23 GTs, 14 CEs, 2 AAs, and 21 CPMs (Jia et al., 2017). GTs that catalyze the
transfer of sugars from activated donor molecules to specific acceptors are important
for the formation of surface structures recognized by host immune systems (Mazmanian
et al., 2008). Therefore, the six-fold larger number of GT genes in L. acidophilus
LA1 compared to L. plantarum KLDS1.0391 suggests the probiotic potential of LA1, especially
for immune stimulation and pathogen defense.
Bacteriocin-related genes
Lactobacillus acidophilus genomes have three area(s) of interest (AOI) that include
one class II bacteriocin and two class III bacteriocins in common: AOI_1 (bacteriocin
III, Enterolysin A), AOI_2 (bacteriocin III, Helventicin J), and AOI_3 (bacteriocin
II, Acidocin J) (Supplementary Table S6). Enterolysin A is a cell wall-degrading bacteriocin
(Nilsen et al., 2003) with broad-spectrum antibiotic activity that acts by cleaving
stem peptide bonds and lysing peptidoglycan in cell walls (Riley and Chavan, 2007;
Khan et al., 2013). Helveticin J is antimicrobial protein that was first characterized
in L. helveticus 481 (Joerger and Klaenhammer, 1986). However, a recent report revealed
that helveticin is also found in other Lactobacillus species (Collins et al., 2017).
Acidocin J is a heat-stable class II bacteriocin, which is mainly found in L. acidophilus
(Riley and Chavan, 2007; Yang et al., 2014). In this study, Enterolysin A and Helventicin
J were found in all Lactobacillus spp. whereas Acidocin J was only encoded in L. acidophilus
genomes. In addition, all L. acidophilus genomes, except for L. acidophilus NCFM,
have the same start position for each AOI.
Unique characteristics of the LA1 genome
CRISPR region
We found a large deletion in the CRISPR region in LA1 when compared to NCFM, La-14,
and FSI4. All the genomes, except LA1, have the same structure in the CRISPR region,
with three types of 28-bp dicer sequences and 32 spacer sequences, whereas LA1 has
only 20 spacer sequences (Figure 1E). The clean-cut of 12 spacers (6–17) was observed
in this region. The CRISPR region has three types of dicers, and the deletion in LA1
was located in the middle of the array of type 2 dicers (DR2). The deleted spacers
in LA1 include five duplicated spacers of two types, one type consists of spacers
7, 14, and 15, and the other consists of spacers 9 and 16. Considering the high conservation
of the CRISPR region, this deletion may be a very recent event. Because one of the
major roles of the CRISPR region is defense against foreign DNA (Yin et al., 2013),
this shortage of spacers to detect unwanted nucleic acids in LA1 may lower its immune
power. The structural variation in the CRISPR region can be found even within the
same species, and could be used to interpret the evolutional history of a strain because
the CRISPR region may reflect the phages that have tried to invade the cell. Therefore,
the CRISPR region has been recently proposed for the identification of industrially
important microorganisms (Barrangou and Horvath, 2012). Therefore, this difference
in the CRISPR region can be used as a marker for distinguishing LA1 from other L.
acidophilus strains.
Prophage insertion
A 26-kbp prophage insert was identified in the LA1 genome at chromosomal position
863,940–890,001 (Supplementary Table S7). The position and size of the insert region
were similar to that in other L. acidophilus genomes, except for the number of proteins
encoded in that region. Despite their high similarity, the number of genes varies
from 10 to 15 (Supplementary Table S8). LA1 contains the smallest number of genes,
FSI4 has the largest number of genes, and NCFM and La-14 have the same number of genes
(12). Genes required for phage invasion, including attL (ORF1), phage integrase (ORF6),
and attR (ORF15), were found in the inserted region. LA1 showed the highest rate of
decay in the inserted phage genome, and five genes, ORF2–5 and ORF9, were degraded
when compared to FSI4.
Conclusion
Here, we sequenced and analyzed the complete genome of a probiotic strain with the
potential to prevent Salmonella infection, L. acidophilus LA1. In the current study,
we demonstrated that the LA1 genome contains the genes required for the biosynthesis
of the three bacteriocins, Enterolysin A, Helveticin J, and Acidocin J. In addition,
the six-fold larger number of GT genes in LA1 compared to the number in one of the
most well-described probiotic strains, L. plantarum KLDS1.0391, suggests the probiotic
potential of LA1, especially in terms of immune stimulation and fortification of pathogen
defense. Interestingly, one of the most unique features of LA1 when compared to the
other currently available L. acidophilus genome sequences is the large, clean-cut
of 12 spacers from the CRISPR region and the difference in the historical record of
phage infection, which can be used as a genetic marker for identification of this
industrially and medically important probiotic strain to distinguish it from genetically
related L. acidophilus strains. Considering the possible use of L. acidophilus LA1
as beneficial probiotic, the availability of the LA1 genome is an important step for
understanding its evolution and probiotic function against pathogenic bacteria.
Data access
The Lactobacillus acidophilus LA1 genome sequencing project has been deposited into
GenBank under accession number CP017062. This strain has been deposited in the Korean
Collection for Type Cultures (deposit ID: KCTC 11906BP).
Author contributions
Y-DN and SR: Designed and coordinated all the experiments; T-jL and SL: Performed
the bacterial cultivation, and DNA extraction and purification; W-HC, JK, and ML:
Performed the genome analysis; W-HC, JK, and Y-DN: prepared the manuscript; All authors
have read and approved the manuscript.
Conflict of interest statement
The authors declare that the research was conducted in the absence of any commercial
or financial relationships that could be construed as a potential conflict of interest.
Related collections
Most cited references24
- Record: found
- Abstract: found
- Article: not found
A microbial symbiosis factor prevents intestinal inflammatory disease.
Sarkis Mazmanian, June Round, Dennis Kasper (2008)

- Record: found
- Abstract: found
- Article: found
BAGEL3: automated identification of genes encoding bacteriocins and (non-)bactericidal posttranslationally modified peptides
Auke van Heel, Anne de Jong, Manuel Montalban-Lopez … (2013)
- Record: found
- Abstract: found
- Article: not found
Antibiotics, pediatric dysbiosis, and disease.
Pajau Vangay, Tonya Ward, Jeffrey Gerber … (2015)