- Record: found
- Abstract: found
- Article: found
Native T1 mapping: inter-study, inter-observer and inter-center reproducibility in hemodialysis patients
Abstract
Background
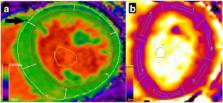
Native T1 mapping is a cardiovascular magnetic resonance (CMR) technique that associates with markers of fibrosis and strain in hemodialysis patients. The reproducibility of T1 mapping in hemodialysis patients, prone to changes in fluid status, is unknown. Accurate quantification of myocardial fibrosis in this population has prognostic potential.
Methods
Using 3 Tesla CMR, we report the results of 1) the inter-study, inter-observer and intra-observer reproducibility of native T1 mapping in 10 hemodialysis patients; 2) inter-study reproducibility of left ventricular (LV) structure and function in 10 hemodialysis patients; 3) the agreement of native T1 map and native T1 phantom analyses between two centres in 20 hemodialysis patients; 4) the effect of changes in markers of fluid status on native T1 values in 10 hemodialysis patients.
Results
Inter-study, inter-observer and intra-observer variability of native T1 mapping were excellent with co-efficients of variation (CoV) of 0.7, 0.3 and 0.4% respectively. Inter-study CoV for LV structure and function were: LV mass = 1%; ejection fraction = 1.1%; LV end-diastolic volume = 5.2%; LV end-systolic volume = 5.6%. Inter-centre variability of analysis techniques were excellent with CoV for basal and mid-native T1 slices between 0.8–1.2%. Phantom analyses showed comparable native T1 times between centres, despite different scanners and acquisition sequences (centre 1: 1192.7 ± 7.5 ms, centre 2: 1205.5 ± 5 ms). For the 10 patients who underwent inter-study testing, change in body weight (Δweight) between scans correlated with change in LV end-diastolic volume (ΔLVEDV) ( r = 0.682; P = 0.03) representing altered fluid status between scans. There were no correlations between change in native T1 between scans (ΔT1) and ΔLVEDV or Δweight ( P > 0.6). Linear regression confirmed ΔT1 was unaffected by ΔLVEDV or Δweight ( P > 0.59).
Related collections
Most cited references43
- Record: found
- Abstract: found
- Article: not found
Modified Look-Locker inversion recovery (MOLLI) for high-resolution T1 mapping of the heart.
- Record: found
- Abstract: found
- Article: found
Noncontrast T1 mapping for the diagnosis of cardiac amyloidosis.

- Record: found
- Abstract: found
- Article: found