- Record: found
- Abstract: found
- Article: found
Mapping Autophagy on to Your Metabolic Radar
research-article
Read this article at
There is no author summary for this article yet. Authors can add summaries to their articles on ScienceOpen to make them more accessible to a non-specialist audience.
Abstract
Autophagy, which literally translates into “eating one's own self,” is an evolutionarily
conserved cellular recycling program that maintains “in-house” quality control by
turning over cytoplasmic components within lysosomes (1). Although the discovery of
lysosomes dates back to the 1950s through the electron microscopic work of Christian
De Duve, recent years have seen a growing interest in autophagy research, and reports
now link compromised autophagy to a wide array of common human pathologies, for instance,
neurodegenerative disorders, metabolic alterations, microbial pathogenesis, and cancers,
to mention just a few (2). These studies support the idea that the “housekeeping”
role of autophagy, in fact, translates to key physiological functions. For instance,
recycling of oxidized proteins and aged organelles through autophagic degradation
protects against cellular toxicity and death (3). Recent findings now highlight roles
for autophagy in mobilization of diverse cellular energy stores (4) and in adipocyte
differentiation (5,6), thus presenting autophagy as an emerging player in the metabolic
arena. As novel functions for autophagy continue to unfold, it becomes critical to
be able to precisely monitor autophagy in diverse physiological systems. This article
comments on the fundamental developments on roles for autophagy in metabolic regulation
and discusses currently available methods to monitor autophagy.
AUTOPHAGY: THE MACHINERY AND REGULATORY ELEMENTS
Mammalian cells exhibit three distinct forms of autophagy to deliver cytosolic cargo
to the lysosomes, namely, macroautophagy, chaperone-mediated autophagy, and microautophagy
(1). Traditionally, autophagy was considered a one-lane system for protein turnover
and a mechanism for replenishing the intracellular amino acid pool during starvation.
However, it is now becoming increasingly clear that autophagy, in particular macroautophagy,
exhibits significant versatility in its ability to degrade mitochondria (mitophagy),
endoplasmic reticulum (reticulophagy), ribosomes (ribophagy), and peroxisomes (pexophagy)
(1). The second form of autophagy, chaperone-mediated autophagy, displays functional
selectivity for the lysosomal targeting of specific soluble cytosolic proteins with
the KFERQ signature (7) and requires the lysosome-associated membrane protein-2A receptor
(7). Microautophagy sequesters cargo within single-membraned vesicles that originate
from lysosomes per se and then pinch off within the lysosomal lumen to degrade the
contents (8). Macroautophagy will remain the prime focus of this article.
Following early studies that displayed similarities between yeast and mammalian macroautophagy
(hereafter autophagy) (9), extensive studies in yeast revealed more than 30 atg genes
that orchestrate autophagy. These Atg proteins form distinct functional complexes
that regulate each step of the process, including induction of autophagy, generation
of the nucleation complex, autophagosome formation, and cargo recognition (1). Although
in most mammalian cells autophagy occurs at basal levels, stress or starvation strongly
upregulate this pathway (4). Autophagy requires the de novo formation of the nucleation
complex, which in turn requires Beclin (Atg6 in yeast) to dissociate from its binding
partner Bcl-2 (1,4) (Fig. 1). The release of Beclin allows it to form a transient
complex with Atg14, vacuolar protein sorting (vps) 15, and the lipid kinase vps34
that generate the functional class III phosphatidylinositol 3-kinase (PI3K) complex
(1) (Fig. 1). The lipid kinase activity of this complex produces phosphatidylinositol
3-phosphate that facilitates the targeting of additional Atg molecules to the nucleation
complex. Recruitment of membranes through the shuttling of Atg9, the sole transmembrane
Atg, to the nucleation complex promotes formation of the limiting membrane (10). The
activation of two independent ubiquitin-like conjugation cascades, the Atg5-Atg12
and the light chain-3 (LC3) systems contributes to membrane elongation and autophagosome
formation (1) (Fig. 1). Briefly, activation of the ubiquitin-like Atg12 requires Atg7,
a crucial E1-like activating enzyme that catalyzes the covalent binding of Atg5 with
Atg12. Subsequent interactions between Atg5-Atg12 and Atg16 recruit these molecules
to the limiting membrane (11). In parallel, LC3 is first processed by the cysteine
protease Atg4 to expose a COOH-terminal glycine (12), following which Atg7-activated
LC3 is transferred to Atg3. In ensuing reactions requiring Atg5-Atg12 (13), LC3 is
lipidated to membrane-associated phosphatidylethanolamine. The limiting membrane eventually
seals upon itself to sequester cargo within double-membraned autophagosomes (1). The
fusion of autophagosomes with lysosomes allows the acquisition of a battery of hydrolases
and proton pumps that facilitate lumen acidification and cargo hydrolysis. The individual
constituents of the degraded cargo are transferred back to the cytosol via lysosomal
permeases and transporters.
FIG. 1.
Molecular constituents of autophagy. Autophagy requires more than 30 Atg proteins
that orchestrate the formation of a de novo limiting membrane, which sequesters cytosolic
cargo and then seals upon itself to form an autophagosome. The fusion of autophagosomes
to lysosomes leads to cargo degradation and release of nutrients into the cytosol.
JNK, Jun NH2-terminal kinase 1; PE, phosphatidylethanolamine; P, phosphorylation of
JNK.
The quest for elements in the nutritional regulation of autophagy has revealed a complex
signaling network that converges upon the mammalian target of rapamycin complex 1
(mTORC1) (14) (Fig. 2). These findings form the basis for the use of rapamycin, a
known inhibitor of mTORC1, to activate autophagy. Studies in yeast have shown that
nutrient-activated TOR blocks autophagy by phosphorylating Atg13 (1), thus impairing
formation of the Atg1-Atg13 complex that is required for Atg9 shuttling. In mammals,
mTORC1-mediated ULK1 (Atg1 in yeast) phosphorylation traps the Atg13-FIP200-ULK1 complex
into an inactive form that blocks autophagy (15) (Fig. 2). In contrast, energy depletion
is sensed by AMP-activated protein kinase (AMPK) that activates autophagy not only
through its ability to impair mTORC1 activity but also via direct phosphorylation
of ULK1 (16) (Fig. 2), which recruits it to the site of autophagosome formation. Recent
studies reveal additional mechanisms that allow mTORC1 to fine-tune its regulatory
effect on autophagy. For example, mTORC1 inhibits death-associated protein 1 (DAP1),
a negative regulator of autophagy, which prevents the uncontrolled upregulation of
autophagy during starvation (17) (Fig. 2). Furthermore, cells circumvent the inhibitory
effect of mTORC1 on autophagy by raising levels of sestrins that upregulate autophagy
by activating AMPK (18).
FIG. 2.
Autophagy is regulated by mTOR and AMPK signaling. Nutrient availability and growth
factors activate mTOR that phosphorylates ULK1 to inhibit autophagy by trapping the
ULK1-FIP200-Atg13 complex in an inactive state. Starvation reduces mTOR activity,
which releases its inhibition on autophagy and on DAP1, the activation of which prevents
uncontrolled activation of autophagy during starvation. Energy depletion activates
AMPK that phosphorylates ULK1 at distinct residues to activate autophagy. Cells may
bypass chronic mTOR activation by upregulating sestrins that upregulate autophagy
by increasing AMPK activity.
AUTOPHAGY AND THE METABOLIC CONNECTION
A rapidly evolving area of research investigates roles for autophagy in metabolic
regulation, and some of these studies have highlighted metabolic functions of autophagy
in liver, adipose tissue, and pancreas. Until recently, mobilization of lipids was
attributed to cytosolic lipases; however, studies now demonstrate a role for autophagosomes
in the “in-bulk” delivery of lipids to lysosomes for degradation (19). Studies in
cultured hepatocytes lacking the autophagy gene atg7 or following pharmacological
inhibition of autophagy revealed marked accumulation of cellular lipid droplets and
reduced rates of β-oxidation (19). The liver-specific deletion of atg7 in mice increased
hepatic triglycerides, which did not occur from increased lipogenesis, since inhibiting
autophagy did not modify triglyceride biosynthesis. This ability to degrade lipids
by autophagy, termed lipophagy, may in fact be a generalized mechanism to turnover
lipids in cells as diverse as neurons (20,21) and macrophages (22). A recent study
in hypothalamic agouti-related peptide neurons revealed a role for starvation-induced
lipophagy in the generation of neuronal free fatty acids that increased agouti-related
peptide levels and food intake (21).
Although starvation and acute lipid loading of cells activate lipophagy (19,21), chronic
high-fat feeding inhibits autophagic turnover of lipids, at least as observed in liver
(19) (Fig. 3A
). This sets up a relentless cycle that promotes steatosis, the hepatic manifestation
of the metabolic syndrome (Fig. 3B
). Subsequent studies have now shown that livers from both dietary and genetic mouse
models of obesity display decreased autophagy resulting in endoplasmic reticulum stress–mediated
insulin resistance (23) (Fig. 4). Although, the mechanism for reduced autophagy as
a consequence of chronic lipid stress is not entirely clear, it is plausible that
reactive intermediates in the background of lipid accumulation may modify membrane
lipid chemistry to affect autophagosome-lysosome fusion, as recently observed in fibroblasts
and liver (24). In addition, activation of nuclear factor-κB, which has been shown
to reduce autophagy in macrophages (25) and initiate fatty acid–induced hepatic inflammation
(26) or the hyperactivation of mTOR during obesity (27), may also block autophagy
and promote hepatic insulin resistance (Fig. 4). Jun NH2-terminal kinase 1 contributes
to hepatocellular injury and insulin resistance (28), and it is conceivable that increases
in reactive intermediates in autophagy-deficient steatotic livers may dysregulate
Jun NH2-terminal kinase signaling and affect insulin sensitivity (Fig. 4). It remains
to be seen whether decreased autophagy and its consequences on cellular energy balance
(4) may be a key element determining the development of insulin resistance during
aging.
FIG. 3.
Autophagic degradation of lipid droplets. Autophagy degrades hepatocellular lipid
droplets under basal conditions or following an acute exposure to lipids by delivering
droplets to lysosomes. A: Breakdown of lipid droplets releases free fatty acids that
undergo β-oxidation in the mitochondria. B: Chronic lipid stimulus impairs delivery
of lipids to lysosomes and promotes hepatic steatosis.
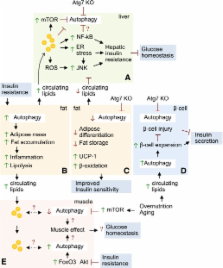
FIG. 4.
Hypothetical links between autophagy and insulin resistance. A: Inhibition of autophagy
leads to lipid accumulation that promotes hepatic insulin resistance by activating
inflammatory signaling pathways and endoplasmic reticulum stress. Excessive lipids,
activated nuclear factor-κB, and the hyperactivation of mTOR during obesity inhibit
autophagy and further lead to hepatic steatosis and insulin resistance. B: Obesity
activates autophagy in the adipose tissue to promote fat accumulation and inflammation,
which increases circulating lipids that accumulate in ectopic sites, such as liver
and muscle. C: Blocking adipose-selective autophagy switches adipose differentiation
into brown adipose-like tissue that increases fat oxidation and improves insulin sensitivity.
D: Induction of β-cell autophagy in response to chronic lipid stress promotes β-cell
expansion and insulin secretion. Blocking β-cell–selective autophagy results in β-cell
injury and reduced insulin secretion. E: Dysregulated skeletal muscle autophagy may
occur from excessive lipid accumulation or disturbed Akt and mTOR signaling, which
may affect muscle control of glucose homeostasis.
The demonstration of autophagy-regulated lipid mobilization questions the existence
of lipophagy in adipose tissue, an organ dedicated to fat storage. In clear contrast
to findings in liver, inhibiting autophagy in adipose tissues reduced adipose lipid
content and markedly improved glucose tolerance (5,6) (Fig. 4). Analyses in autophagy-deficient
3T3-L1 preadipocytes revealed decreased triglyceride content, reduced levels of key
adipogenic transcription factors, CCAAT/enhancer-binding protein α and β (5), and
the failure to differentiate into adipocytes. A possible explanation for reduced adiposity
in the adipose-selective autophagy-deficient mice was acquisition of brown adipose-like
features within their white adipose tissues (5,6). In fact, loss of autophagy in white
adipose tissues resulted in increased expression of brown adipose markers, increased
mitochondrial content, and raised β-oxidation rates (5) (Fig. 4). These findings demonstrate
a central role for autophagy in regulation of energy balance through effects on adipose
differentiation and function. Interestingly, studies examining autophagy levels in
the different fat depots in humans now correlate increased autophagic activity to
expansion of subcutaneous and omental fats in obese individuals (29). Remarkably,
autophagy was excessively raised in the omental fat, and particularly so in insulin-resistant
individuals (29) (Fig. 4). These results suggest that while autophagy is required
for adipose differentiation and lipid droplet biogenesis during early development
(5,6), it may also function to maintain adipose mass and lipid storage during adulthood.
The regulatory function of autophagy is not limited to lipid metabolism but also extends
to the maintenance of glucose homeostasis, particularly in glycogenolysis. The existence
of cytosolic and lysosomal enzymes to breakdown glycogen points to important roles
for autophagy in regulating cellular glycogen stores, and indeed, glucagon that regulates
glycogen metabolism was the first identified hormone to activate autophagy. One physiological
scenario in which autophagy is acutely required is during childbirth, wherein neonatal
livers induce autophagy to mobilize glycogen stores to increase availability of glucose.
In fact, the presence of lysosomal glucose-6-phosphatase facilitates the availability
of glucose by modulating its efflux into the cytosol. Apart from roles for autophagy
in glycogenolysis in liver, the documentation of diverse muscle diseases characterized
by accumulation of glycogen granules, for instance, Danon disease (30), X-linked vacuolar
myopathy with excessive autophagy (31), and Pompe disease (32), indicate the involvement
of dysfunctional autophagy in these pathologies. A common feature to all of these
diseases is accumulation of glycogen granules, although these diseases differ in the
cellular mechanism that contributes to glycogen accumulation. For instance, Danon
disease occurs from mutations in the LAMP2 gene (33), and reduced LAMP2 function alters
autophagosome-lysosome fusion (34) and impairs glycogen delivery to lysosomes. In
contrast, Pompe disease patients are deficient in lysosomal acid α-glucosidase and
thus are unable to break down glycogen delivered to the lysosomes. Although these
associations reveal an important link between autophagy and glycogenolysis in the
maintenance of muscle “quality control,” it is unclear how autophagy per se regulates
muscle function and how changes in autophagy in response to environmental stressors,
such as overnutrition, affect muscle function especially during insulin resistance
and diabetes. According to a previous report, control of autophagy through Akt-regulated/FoxO3-dependent
transcriptional upregulation of autophagy genes modulates muscle protein turnover
(35). Therefore, altered Akt signaling during obesity and insulin resistance (36)
may affect autophagy function in the muscle that, in turn, may interfere with muscle
functions including those related to control of blood glucose levels (Fig. 4). In
contrast, hyperactivation of mTOR during overnutrition and aging may inhibit autophagy
(14) to affect muscle function (Fig. 4). Further detailed investigations will be required
to provide clarity into the roles for autophagy in the muscle, and how defective autophagy
modifies muscle function and contributes to the development of insulin resistance
and diabetes.
Autophagy may also modulate glucose homeostasis through its effects on the pancreatic
β-cell (37). Although, the pancreas is relatively resistant to upregulating autophagy
during starvation, β-cell–selective deletion of atg7 results in progressive β-cell
injury and reduced insulin secretion (Fig. 4). A possibility exists that autophagic
turnover of insulin-positive secretory granules may be a requirement for insulin secretion.
In fact, studies in secretory-deficient Rab3-deficient β-cells reveal maintained intracellular
insulin levels as a consequence of increased lysosomal insulin degradation (38). Studies
in db/db mice with diet-induced obesity and insulin resistance have revealed increased
autophagosome formation and β-cell expansion, and a possibility exists that autophagy
protects against chronic lipid stress in the pancreas in these settings (Fig. 4),
particularly since β-cell autophagy–deficient rodents failed to display similar increases
in β-cell mass (37). It cannot be excluded that loss of inhibitory inputs from reduced
insulin signaling may promote β-cell autophagy in this scenario.
METHODS TO MONITOR AUTOPHAGY
The inherent challenges to follow autophagy originate from the dynamic nature of this
pathway. Autophagy maintains a basal flux of substrates to lysosomes that accelerates
during stress or starvation, and thus, analyzing static levels of autophagosome markers
may not provide information on autophagy activity. In contrast, measuring autophagic
flux that reveals the net amount of substrate delivered to lysosomes per unit time
will provide information on whether autophagy is active or suppressed. This section
discusses essential assays for tracking autophagy and classifies these into assays
that determine steady-state autophagosome content and those that reveal functional
information regarding autophagic flux.
MEASURING STEADY-STATE AUTOPHAGOSOME CONTENT
Electron microscopy.
Transmission electron microscopy (TEM) remains the gold standard for the qualitative
detection of autophagic components. TEM studies led to the discovery of lysosomes
and have been instrumental in tracking cellular sources of autophagosomes. In fact,
the elucidation that distinct endoplasmic reticulum regions, termed omegasomes, contribute
to autophagosomes came through TEM studies (39). The ultrastructural definition of
an autophagosome is a double-membraned vesicle that contains engulfed cytoplasmic
contents. During the early stages of autophagy, the maintained morphology of sequestered
material within double-membraned structures and the electron dense appearance of cargo
contrasted to the cytosol help in identifying autophagosomes. The identification of
autophagolysosomes or amphisomes, which are single-membraned structures originating
from fusion of autophagosomes with lysosomes or endosomes, respectively, may also
be relatively easy during early stages of degradation. However, once advanced degradation
sets in, it may be difficult to distinguish sequestered intracellular contents from
those phagocytosed from the outside of the cell or distinguishing autolysosomes from
vacuoles of unclear origin. The power of TEM lies in the direct visualization of autophagosome
morphology; however, TEM studies may not accurately reveal information regarding autophagic
flux. Additional drawbacks include lack of objectivity and the requirement of a certain
level of expertise to reproducibly distinguish between distinct autophagic structures,
the lack of which often results in misinterpretation of data, as detailed in a recent
review (40). Although immunolabeling of LC3 using gold-conjugated secondary antibodies
may facilitate identification of autophagosomes (41), TEM still needs to be supplemented
with autophagic flux studies to reveal the true dynamics of the pathway.
Biochemical detection of LC3-II.
A number of approaches, for instance dyes such as monodansylcadaverine, have been
used to label autophagosomes and erroneously considered as readouts for autophagic
activity. Monodansylcadaverine was initially considered a specific autophagosome marker
but was subsequently found to label additional organelles (42). Additionally, the
acidophilic dye LysoTracker, which stains cellular acidic compartments, or biochemical
detection of lysosomal membrane proteins LAMP1 or LAMP-2 isoforms or luminal cathepsins,
may not reflect autophagic activity, as it is mistakenly considered to. The use of
expression analyses for autophagy genes, including LC3 or Atg proteins, may not represent
induction of autophagy, since it is generally considered that autophagy proteins are
present in excess and that autophagy activation is primarily a posttranslational event.
LC3 is the most reliable autophagosome marker (43) that exists in two forms: the soluble
cytosolic LC3-I form that becomes lipidated to become the autophagosome-bound LC3-II
during activation of autophagy (Fig. 1). The hydrophobicity of lipidated LC3-II allows
its rapid migration on a SDS-PAGE (Fig. 5), and thus, LC3-II should not be considered
as the processed form of LC3-I. LC3-II reproducibly follows the entire autophagic
process from the limiting membrane to the lysosome; consequently, levels of LC3-II
faithfully reflect autophagosome number, or more appropriately autophagic membranes
positive for LC3-II (44). A common misinterpretation regarding LC3-II readouts is
the consideration that increases in LC3-II reflect increased autophagic activity.
Because the net cellular LC3-II content is a function of the amount of autophagosomes
generated and the amount degraded, steady state LC3-II levels may only represent the
absolute autophagosome content. Additionally, a number of studies have now reported
the presence of a population of LC3-II that is generated independently of autophagosome
formation. For instance, knockdowns of critical components of the functional PI3K
complex, such as Atg14, vps34, or Beclin in a number of mammalian systems have significantly
reduced autophagic activity without reducing LC3-II levels (15,45). Therefore, it
remains imperative that analyses of steady state levels of LC3-II should be supplemented
with functional autophagic flux assays.
FIG. 5.
Representative immunoblots for LC3. Steady state LC3 levels in NIH3T3 cells and mouse
embryonic fibroblasts (MEF) cultured in serum-supplemented Dulbecco's modified Eagle's
medium (Fed) or in response to serum removal for 2 h (Stv). The effect of serum starvation
is increased levels of LC3-II (lanes 2 and 4), reflecting increased autophagosome
content.
Immunofluorescence.
Light microscopic approaches to detect autophagosomes are now being used widely in
cultured cells and in vivo systems, including Drosophila melanogaster (46), Caenorhabditis
elegans (47), and mice (48). In principle, the analyses for autophagosome number rely
on quantifying either endogenous LC3 signal by indirect immunofluorescence or by examining
the signal of green fluorescent protein (GFP) (49) or mCherry (50) tagged to LC3.
Detecting endogenous LC3 offers advantages in terms of reducing cellular manipulation
and decreasing potential artifacts from an overexpression system. Regardless of the
approach, LC3 either appears as a diffuse cytosolic signal representing soluble cytosolic
LC3-I or as autophagosome-associated LC3-II puncta (Fig. 6). In certain systems, reduced
endogenous signal may require an exogenous LC3 construct, in which case some critical
considerations should be taken into account. For instance, the use of stable GFP-LC3
transformants may be beneficial over transient transfections because this will allow
the selection of clones offering highest signal-to-noise ratios. This may facilitate
selecting clones expressing physiological levels of GFP-LC3 that will preclude LC3
aggregation often observed in GFP-LC3–expressed systems. In experiments requiring
GFP-LC3 overexpression, it may be important to include controls such as the use of
GFP-LC3 C-terminus glycine mutants (GFP-LC3G120A) that are defective for LC3 lipidation
(51). This will allow one to distinguish between true increases in GFP-LC3 puncta
as opposed to the lack of it in these mutants (51). A second consideration is determining
what amounts to a LC3 puncta. As with all visual readouts, quantifying LC3 puncta
is prone to errors from lack of objectivity; consequently, quantification may be performed
by experiment-blind personnel via algorithms that define puncta size by thresholding
(52). Because most cells display minimal amounts of LC3 puncta even under basal conditions,
it may be inappropriate to express results as percent cells positive for LC3 puncta.
Under most circumstances results may be expressed as average LC3 puncta count per
cell or per cell area, although in the latter case caution should be exercised to
exclude artifacts arising from GFP-LC3 aggregates. LC3 quantification may be used
for in vivo analyses, although endogenous LC3 is particularly difficult to detect
in muscle. Alternatively, transfecting GFP-LC3 construct by in vivo electroporation
or else the use of conventional GFP-LC3 and tissue-specific transgenic mice may be
useful (53).
FIG. 6.
Representative indirect immunofluorescence for LC3. Indirect immunofluorescence for
endogenous LC3 in hypothalamic GT1–7 cells cultured in serum-supplemented medium (Fed)
or following serum removal for 2 h (Stv). Distinct LC3 puncta (white arrows) are observed
in response to serum removal and are in green (fluorescein isothiocyanate). Nuclei
are in blue (diaminido phenylindol). (A high-quality digital representation of this
figure is available in the online issue.)
FUNCTIONAL AUTOPHAGIC FLUX ASSAYS
Monitoring autophagic flux in cells and in tissues.
Autophagic flux assays are typically based on the principle that LC3-II is turned
over within lysosomes. The exposure of cells to lysosomal inhibitors that dissipate
lysosomal pH or to lysosomal protease inhibitors will result in accumulation of LC3-II
in lysosomes. The difference in levels of LC3-II in presence or absence of these inhibitors
will reflect the net amount of LC3-II delivered to lysosomes, which in turn will be
the measure of autophagy activity (Fig. 7). For instance, the use of lysosomal inhibitors
during starvation will increase lysosomal accumulation of LC3-II over and above those
observed under basal fed conditions, indicating increased autophagy during starvation
(Fig. 7). The LC3-II flux assay, although a reliable indicator of autophagic activity,
may still be less sensitive in cells exhibiting higher basal rates of autophagic flux.
Modifying autophagosome formation by pharmacological or genetic means (Fig. 8) may
serve as control experiments to confirm results obtained from the LC3-II flux assay.
In addition to LC3-II, turnover of a second autophagy substrate, p62 (54), which gains
access to autophagosomes through its ability to bind to LC3-II, may also be used to
determine autophagic flux in a manner similar to LC3-II. However, in contrast to LC3-II,
p62 molecules that are bound to polyubiquitinated substrates are degraded through
the proteasome (55), and consequently, p62 flux may be used as support for results
obtained from the LC3-II flux assay. The LC3-II flux assay may also be used for in
vivo analyses, for instance, intraperitoneal administration of leupeptin or colchicine
may be appropriate for examining LC3-II flux in liver (56) and muscle (57), respectively.
An alternate approach is the ex vivo flux assay, wherein fresh tissue explants may
be incubated with or without lysosomal inhibitors, and this approach may be used reproducibly
in liver and oxygenated muscle tissue (E.Y., unpublished data). Since increases in
LC3 and p62 gene expression during starvation might complicate data analyses, the
use of additional assays for autophagy activity (detailed below) may verify results
from flux assays.
FIG. 7.
Schematic representation of the LC3 flux assay. A: Experimental plan for the LC3 flux
assay: Cells cultured in serum-supplemented (Fed) or serum-starved medium (Stv) treated
in presence or absence of inhibitors of lysosomal degradation (Inh) for 2 h, following
which cell lysates are subjected to immunoblotting for LC3. B: Cartoon depicting immunoblots
and densitometry for LC3-II from cells harvested according to plan in A. C: Calculations
for determination of net LC3 flux. Densitometric values of samples are subtracted
from corresponding inhibitor-treated value, and these represent residual amounts of
LC3-II within lysosomes. Higher values correspond to increased autophagic flux.
FIG. 8.
Methods to modulate autophagy. Autophagosome formation can be blocked by pharmacological
agents that inhibit class III PI3K (3MA, wortmannin) or through deletion of autophagy
genes (atg5 or atg7). Autophagosome-lysosome fusion can be inhibited by agents that
affect microtubule function (vinblastine, nocodazole) or that interfere with lysosomal
pH (bafilomycin). Lysosomal degradation is blocked by dissipating lysosomal pH (ammonium
chloride, bafilomycin) or by inhibiting lysosomal proteases (leupeptin, pepstatin,
E64d). Autophagy may be activated by inhibiting mTOR (rapamycin, torin 1) or through
mechanisms independent of mTOR (lithium, trehalose). PE, phosphatidylethanolamine;
P-mTOR, phosphorylated mTOR.
Analyses for lysosomal delivery of fluorescent probes.
A second approach to analyzing autophagic flux relies on the fact that GFP fluorescence
is typically quenched upon delivery to the lysosome despite its relative resistance
to degradation, whereas red fluorescent protein (RFP) and mCherry maintain their fluorescence
in lysosomes (58). The opposing qualities of these proteins have allowed the construction
of a novel chimeric mRFP-GFP-LC3 probe for monitoring autophagic flux (59). With this
construct, under basal conditions, autophagosomes are observed as a yellow signal
(merged mRFP and GFP signal), whereas autophagolysosomes appear red (from the quenching
of GFP). The induction of autophagy can be easily tracked by observing for increases
in both the yellow and red signal; however, conditions that reduce fusion of autophagosomes
with lysosomes will typically increase the yellow signal. Because the method relies
on lysosomal pH, it should be kept in mind that this approach may not be used in conjunction
with agents that neutralize lysosomal pH, and additionally, conditions that alter
lysosomal acidification may adversely affect results obtained from this assay. The
relative resistance of GFP against degradation in lysosomes has led to another approach
for determination of autophagic flux. Increased free GFP in lysosomes generated from
cleavage of GFP-LC3 and the degradation of LC3 (the appearance of a free GFP band
of reduced molecular weight by immunoblotting) will also indicate increased autophagic
flux (60).
Analyses of long half-life protein degradation.
The degradation rates of proteins of long half-life have often been used as a measure
of autophagic flux in cultured cells (20,21). In principle, cells are treated with
3H-leucine for prolonged periods of time to allow for the incorporation of radioactive
label into proteins, following which cells are maintained in radioactivity-free medium
to ensure complete removal of short-lived radiolabeled proteins by the proteasome.
Autophagy is then induced, and the release of radiolabeled amino acids from proteolysis
of radiolabeled proteins is quantified. The incorporation of pharmacological modulators
of autophagy during the “chase,” in particular the use of 3-methyladenine (3MA) that
blocks autophagosome formation, reveals 3MA-sensitive proteolysis, which is an index
of the amount of protein degradation occurring through this pathway. Although, this
approach is quantitative, one caveat is that the success of the assay depends on the
efficiency of 3MA to block autophagy that may vary depending on experimental conditions
or the cells in which experiments are performed.
CONCLUDING REMARKS
Autophagy is a crucial mechanism that governs many aspects of cell function, including
regulation of cellular metabolism and energy balance, and alterations in autophagy
have been linked to the development of insulin resistance. Although there are no specific
autophagy assays tailored for diabetes research, combining multiple approaches may
provide precise information regarding autophagic activity in these conditions. Although
existing methods to follow autophagy in vivo are rudimentary, it is expected that
more accurate means and specific reagents will emerge for the better understanding
of this key degradation mechanism with the long-term goal of developing new therapies
for cure or disease prevention through the modulation of autophagy.
Related collections
Most cited references25
- Record: found
- Abstract: found
- Article: not found
LC3 conjugation system in mammalian autophagy
Isei Tanida, Takashi Ueno, Eiki Kominami (2004)
- Record: found
- Abstract: found
- Article: not found
A subdomain of the endoplasmic reticulum forms a cradle for autophagosome formation.
- Record: found
- Abstract: found
- Article: not found
The Atg12-Atg5 conjugate has a novel E3-like activity for protein lipidation in autophagy.
Takao Hanada, Nobuo Noda, Yoshinori Satomi … (2007)