16
views
0
recommends
+1 Recommend
0 collections
    0
    shares
      • Record: found
      • Abstract: found
      • Article: found
      Is Open Access

      A comparison of methods for calculating general practice level socioeconomic deprivation

      research-article

      Read this article at

      Bookmark
          There is no author summary for this article yet. Authors can add summaries to their articles on ScienceOpen to make them more accessible to a non-specialist audience.

          Abstract

          Background

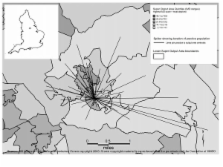
          A measure of the socioeconomic deprivation experienced by the registered patient population of a general practice is of interest because it can be used to explore the association between deprivation and a wide range of other variables measured at practice level. If patient level geographical data are available a population weighted mean area-based deprivation score can be calculated for each practice. In the absence of these data, an area-based deprivation score linked to the practice postcode can be used as an estimate of the socioeconomic deprivation of the practice population. This study explores the correlation between Index of Multiple Deprivation 2004 (IMD) scores linked to general practice postcodes (main surgery address alone and main surgery plus any branch surgeries), practice population weighted mean IMD scores, and practice level mortality (aged 1 to 75 years, all causes) for 38 practices in Rotherham UK.

          Results

          Population weighted deprivation scores correlated with practice postcode based scores (main surgery only, Pearson r = 0.74, 95% CI 0.54 to 0.85; main plus branch surgeries, r = 0.79, 95% CI 0.63 to 0.89). All cause mortality aged 1 to 75 correlated with deprivation (main surgery postcode based measure, r = 0.50, 95% CI 0.22 to 0.71; main plus branch surgery based score, r = 0.55, 95% CI 0.28 to 0.74); population weighted measure, r = 0.66, 95% CI 0.43 to 0.81).

          Conclusion

          Practice postcode linked IMD scores provide a valid proxy for a population weighted measure in the absence of patient level data. However, by using them, the strength of association between mortality and deprivation may be underestimated.

          Related collections

          Most cited references21

          • Record: found
          • Abstract: found
          • Article: not found

          Invited commentary: ecologic studies--biases, misconceptions, and counterexamples.

          Many authors have pointed out that relative-risk estimates derived from ecologic data are vulnerable to biases not found in estimates derived from individual-level data. Nevertheless, biases in ecologic studies still are often dealt with in the same manner as biases in other observational studies, and so are not given adequate treatment. This commentary reviews and illustrates some of the more recent findings about bias in ecologic estimates. Special attention is given to problems of ecologic confounder control when individual risks follow a nonlinear model, and to misconceptions about ecologic bias that have appeared in the literature.
            Bookmark
            • Record: found
            • Abstract: not found
            • Book: not found

            An introduction to medical statistics

              Bookmark
              • Record: found
              • Abstract: found
              • Article: not found

              Underprivileged areas: validation and distribution of scores.

              Underprivileged areas were identified by weighting several census variables that relate to social conditions, by using weights determined by means of a questionnaire sent to one in 10 of the general practitioners in the United Kingdom. The weighted variables were added (after statistical manipulation) to give a score for each of the 9265 electoral wards in England and Wales. Blank ward maps were sent to general practitioners in five family practitioner committee areas and they were asked to shade the wards according to the degree to which the population increased their workload or the pressure on their services. Maps of these same areas were then prepared by using the calculated scores with the cut off points between the worst, the intermediate, and the best areas as on those used by the general practitioners. The two sets of maps were then compared to determine how well the maps that were based on scores agreed with the general practitioners' maps showing their assessment of the variation of workload in their areas. Overall, 6.3% of the wards differed in shading in any way between the two sets of maps. In the three areas where the general practitioners shaded complete wards and did not report having difficulties with shading only 1.2% of the wards differed. It may be possible to use these "underprivileged area" scores to indicate where problems occur for general practitioners and to extend this work to other primary health care workers.
                Bookmark

                Author and article information

                Journal
                Int J Health Geogr
                International Journal of Health Geographics
                BioMed Central (London )
                1476-072X
                2006
                4 July 2006
                : 5
                : 29
                Affiliations
                [1 ]Rotherham Primary Care Trust, Oak House, Moorhead Way, Bramley, Rotherham, S66 1YY, UK
                [2 ]Public Health GIS Unit, School of Health and Related Research, The University of Sheffield, Regent Court, 30 Regent Street, Sheffield S1 4DA, UK
                Article
                1476-072X-5-29
                10.1186/1476-072X-5-29
                1524946
                16820054
                9d057370-81cf-4cd3-91bd-32a982edd090
                Copyright © 2006 Strong et al; licensee BioMed Central Ltd.

                This is an Open Access article distributed under the terms of the Creative Commons Attribution License ( http://creativecommons.org/licenses/by/2.0), which permits unrestricted use, distribution, and reproduction in any medium, provided the original work is properly cited.

                History
                : 16 June 2006
                : 4 July 2006
                Categories
                Research

                Public health
                Public health

                Comments

                Comment on this article