- Record: found
- Abstract: found
- Article: found
CONSORT 2010 Explanation and Elaboration: updated guidelines for reporting parallel group randomised trials
other

David Moher
1
,
,
Sally Hopewell
2 ,
Kenneth F Schulz
3 ,
Victor Montori
4 ,
Peter C Gøtzsche
5 ,
P J Devereaux
6 ,
Diana Elbourne
7 ,
Matthias Egger
8 ,
Douglas G Altman
2
23 March 2010
Read this article at
There is no author summary for this article yet. Authors can add summaries to their articles on ScienceOpen to make them more accessible to a non-specialist audience.
Abstract
Abstract
Overwhelming evidence shows the quality of reporting of randomised controlled trials
(RCTs) is not optimal. Without transparent reporting, readers cannot judge the reliability
and validity of trial findings nor extract information for systematic reviews. Recent
methodological analyses indicate that inadequate reporting and design are associated
with biased estimates of treatment effects. Such systematic error is seriously damaging
to RCTs, which are considered the gold standard for evaluating interventions because
of their ability to minimise or avoid bias.
A group of scientists and editors developed the CONSORT (Consolidated Standards of
Reporting Trials) statement to improve the quality of reporting of RCTs. It was first
published in 1996 and updated in 2001. The statement consists of a checklist and flow
diagram that authors can use for reporting an RCT. Many leading medical journals and
major international editorial groups have endorsed the CONSORT statement. The statement
facilitates critical appraisal and interpretation of RCTs.
During the 2001 CONSORT revision, it became clear that explanation and elaboration
of the principles underlying the CONSORT statement would help investigators and others
to write or appraise trial reports. A CONSORT explanation and elaboration article
was published in 2001 alongside the 2001 version of the CONSORT statement.
After an expert meeting in January 2007, the CONSORT statement has been further revised
and is published as the CONSORT 2010 Statement. This update improves the wording and
clarity of the previous checklist and incorporates recommendations related to topics
that have only recently received recognition, such as selective outcome reporting
bias.
This explanatory and elaboration document—intended to enhance the use, understanding,
and dissemination of the CONSORT statement—has also been extensively revised. It presents
the meaning and rationale for each new and updated checklist item providing examples
of good reporting and, where possible, references to relevant empirical studies. Several
examples of flow diagrams are included.
The CONSORT 2010 Statement, this revised explanatory and elaboration document, and
the associated website (www.consort-statement.org) should be helpful resources to
improve reporting of randomised trials.
“The whole of medicine depends on the transparent reporting of clinical trials.”1
Well designed and properly executed randomised controlled trials (RCTs) provide the
most reliable evidence on the efficacy of healthcare interventions, but trials with
inadequate methods are associated with bias, especially exaggerated treatment effects.2
3 4 5 Biased results from poorly designed and reported trials can mislead decision
making in health care at all levels, from treatment decisions for a patient to formulation
of national public health policies.
Critical appraisal of the quality of clinical trials is possible only if the design,
conduct, and analysis of RCTs are thoroughly and accurately described in the report.
Far from being transparent, the reporting of RCTs is often incomplete,6 7 8 9 compounding
problems arising from poor methodology.10 11 12 13 14 15
Incomplete and inaccurate reporting
Many reviews have documented deficiencies in reports of clinical trials. For example,
information on the method used in a trial to assign participants to comparison groups
was reported in only 21% of 519 trial reports indexed in PubMed in 2000,16 and only
34% of 616 reports indexed in 2006.17 Similarly, only 45% of trial reports indexed
in PubMed in 200016 and 53% in 200617 defined a primary end point, and only 27% in
2000 and 45% in 2006 reported a sample size calculation. Reporting is not only often
incomplete but also sometimes inaccurate. Of 119 reports stating that all participants
were included in the analysis in the groups to which they were originally assigned
(intention-to-treat analysis), 15 (13%) excluded patients or did not analyse all patients
as allocated.18 Many other reviews have found that inadequate reporting is common
in specialty journals16 19 and journals published in languages other than English.20
21
Proper randomisation reduces selection bias at trial entry and is the crucial component
of high quality RCTs.22 Successful randomisation hinges on two steps: generation of
an unpredictable allocation sequence and concealment of this sequence from the investigators
enrolling participants (see box 1).2 23
Box 1: Treatment allocation. What’s so special about randomisation?
The method used to assign interventions to trial participants is a crucial aspect
of clinical trial design. Random assignment is the preferred method; it has been successfully
used regularly in trials for more than 50 years.24 Randomisation has three major advantages.25
First, when properly implemented, it eliminates selection bias, balancing both known
and unknown prognostic factors, in the assignment of treatments. Without randomisation,
treatment comparisons may be prejudiced, whether consciously or not, by selection
of participants of a particular kind to receive a particular treatment. Second, random
assignment permits the use of probability theory to express the likelihood that any
difference in outcome between intervention groups merely reflects chance.26 Third,
random allocation, in some situations, facilitates blinding the identity of treatments
to the investigators, participants, and evaluators, possibly by use of a placebo,
which reduces bias after assignment of treatments.27 Of these three advantages, reducing
selection bias at trial entry is usually the most important.28
Successful randomisation in practice depends on two interrelated aspects—adequate
generation of an unpredictable allocation sequence and concealment of that sequence
until assignment occurs.2 23 A key issue is whether the schedule is known or predictable
by the people involved in allocating participants to the comparison groups.29 The
treatment allocation system should thus be set up so that the person enrolling participants
does not know in advance which treatment the next person will get, a process termed
allocation concealment.2 23 Proper allocation concealment shields knowledge of forthcoming
assignments, whereas proper random sequences prevent correct anticipation of future
assignments based on knowledge of past assignments.
Unfortunately, despite that central role, reporting of the methods used for allocation
of participants to interventions is also generally inadequate. For example, 5% of
206 reports of supposed RCTs in obstetrics and gynaecology journals described studies
that were not truly randomised.23 This estimate is conservative, as most reports do
not at present provide adequate information about the method of allocation.20 23 30
31 32 33
Improving the reporting of RCTs: the CONSORT statement
DerSimonian and colleagues suggested that “editors could greatly improve the reporting
of clinical trials by providing authors with a list of items that they expected to
be strictly reported.”34 Early in the 1990s, two groups of journal editors, trialists,
and methodologists independently published recommendations on the reporting of trials.35
36 In a subsequent editorial, Rennie urged the two groups to meet and develop a common
set of recommendations 37; the outcome was the CONSORT statement (Consolidated Standards
of Reporting Trials).38
The CONSORT statement (or simply CONSORT) comprises a checklist of essential items
that should be included in reports of RCTs and a diagram for documenting the flow
of participants through a trial. It is aimed at primary reports of RCTs with two group,
parallel designs. Most of CONSORT is also relevant to a wider class of trial designs,
such as non-inferiority, equivalence, factorial, cluster, and crossover trials. Extensions
to the CONSORT checklist for reporting trials with some of these designs have been
published,39 40 41 as have those for reporting certain types of data (harms 42), types
of interventions (non-pharmacological treatments 43, herbal interventions44), and
abstracts.45
The objective of CONSORT is to provide guidance to authors about how to improve the
reporting of their trials. Trial reports need be clear, complete, and transparent.
Readers, peer reviewers, and editors can also use CONSORT to help them critically
appraise and interpret reports of RCTs. However, CONSORT was not meant to be used
as a quality assessment instrument. Rather, the content of CONSORT focuses on items
related to the internal and external validity of trials. Many items not explicitly
mentioned in CONSORT should also be included in a report, such as information about
approval by an ethics committee, obtaining informed consent from participants, and,
where relevant, existence of a data safety and monitoring committee. In addition,
any other aspects of a trial that are mentioned should be properly reported, such
as information pertinent to cost effectiveness analysis.46 47 48
Since its publication in 1996, CONSORT has been supported by more than 400 journals
(www.consort-statement.org) and several editorial groups, such as the International
Committee of Medical Journal Editors.49 The introduction of CONSORT within journals
is associated with improved quality of reports of RCTs.17 50 51 However, CONSORT is
an ongoing initiative, and the CONSORT statement is revised periodically.3 CONSORT
was last revised nine years ago, in 2001.52 53 54 Since then the evidence base to
inform CONSORT has grown considerably; empirical data have highlighted new concerns
regarding the reporting of RCTs, such as selective outcome reporting.55 56 57 A CONSORT
Group meeting was therefore convened in January 2007, in Canada, to revise the 2001
CONSORT statement and its accompanying explanation and elaboration document. The revised
checklist is shown in table 1 and the flow diagram, not revised, in fig 1.52 53 54
Table 1
CONSORT 2010 checklist of information to include when reporting a randomised trial*
Section/Topic
Item No
Checklist item
Reported on page No
Title and abstract
1a
Identification as a randomised trial in the title
1b
Structured summary of trial design, methods, results, and conclusions (for specific
guidance see CONSORT for abstracts45 65)
Introduction
Background and objectives
2a
Scientific background and explanation of rationale
2b
Specific objectives or hypotheses
Methods
Trial design
3a
Description of trial design (such as parallel, factorial) including allocation ratio
3b
Important changes to methods after trial commencement (such as eligibility criteria),
with reasons
Participants
4a
Eligibility criteria for participants
4b
Settings and locations where the data were collected
Interventions
5
The interventions for each group with sufficient details to allow replication, including
how and when they were actually administered
Outcomes
6a
Completely defined pre-specified primary and secondary outcome measures, including
how and when they were assessed
6b
Any changes to trial outcomes after the trial commenced, with reasons
Sample size
7a
How sample size was determined
7b
When applicable, explanation of any interim analyses and stopping guidelines
Randomisation:
Sequence generation
8a
Method used to generate the random allocation sequence
8b
Type of randomisation; details of any restriction (such as blocking and block size)
Allocation concealment mechanism
9
Mechanism used to implement the random allocation sequence (such as sequentially numbered
containers), describing any steps taken to conceal the sequence until interventions
were assigned
Implementation
10
Who generated the random allocation sequence, who enrolled participants, and who assigned
participants to interventions
Blinding
11a
If done, who was blinded after assignment to interventions (for example, participants,
care providers, those assessing outcomes) and how
11b
If relevant, description of the similarity of interventions
Statistical methods
12a
Statistical methods used to compare groups for primary and secondary outcomes
12b
Methods for additional analyses, such as subgroup analyses and adjusted analyses
Results
Participant flow (a diagram is strongly recommended)
13a
For each group, the numbers of participants who were randomly assigned, received intended
treatment, and were analysed for the primary outcome
13b
For each group, losses and exclusions after randomisation, together with reasons
Recruitment
14a
Dates defining the periods of recruitment and follow-up
14b
Why the trial ended or was stopped
Baseline data
15
A table showing baseline demographic and clinical characteristics for each group
Numbers analysed
16
For each group, number of participants (denominator) included in each analysis and
whether the analysis was by original assigned groups
Outcomes and estimation
17a
For each primary and secondary outcome, results for each group, and the estimated
effect size and its precision (such as 95% confidence interval)
17b
For binary outcomes, presentation of both absolute and relative effect sizes is recommended
Ancillary analyses
18
Results of any other analyses performed, including subgroup analyses and adjusted
analyses, distinguishing pre-specified from exploratory
Harms
19
All important harms or unintended effects in each group (for specific guidance see
CONSORT for harms42)
Discussion
Limitations
20
Trial limitations, addressing sources of potential bias, imprecision, and, if relevant,
multiplicity of analyses
Generalisability
21
Generalisability (external validity, applicability) of the trial findings
Interpretation
22
Interpretation consistent with results, balancing benefits and harms, and considering
other relevant evidence
Other information
Registration
23
Registration number and name of trial registry
Protocol
24
Where the full trial protocol can be accessed, if available
Funding
25
Sources of funding and other support (such as supply of drugs), role of funders
*We strongly recommend reading this statement in conjunction with the CONSORT 2010
Explanation and Elaboration for important clarifications on all the items. If relevant,
we also recommend reading CONSORT extensions for cluster randomised trials,40 non-inferiority
and equivalence trials,39 non-pharmacological treatments,43 herbal interventions,44
and pragmatic trials.41 Additional extensions are forthcoming: for those and for up
to date references relevant to this checklist, see www.consort-statement.org.
Fig 1 Flow diagram of the progress through the phases of a parallel randomised trial
of two groups (that is, enrolment, intervention allocation, follow-up, and data analysis)52
53 54
The CONSORT 2010 Statement: explanation and elaboration
During the 2001 CONSORT revision, it became clear that explanation and elaboration
of the principles underlying the CONSORT statement would help investigators and others
to write or appraise trial reports. The CONSORT explanation and elaboration article58
was published in 2001 alongside the 2001 version of the CONSORT statement. It discussed
the rationale and scientific background for each item and provided published examples
of good reporting. The rationale for revising that article is similar to that for
revising the statement, described above. We briefly describe below the main additions
and deletions to this version of the explanation and elaboration article.
The CONSORT 2010 Explanation and Elaboration: changes
We have made several substantive and some cosmetic changes to this version of the
CONSORT explanatory document (full details are highlighted in the 2010 version of
the CONSORT statement59). Some reflect changes to the CONSORT checklist; there are
three new checklist items in the CONSORT 2010 checklist—such as item 24, which asks
authors to report where their trial protocol can be accessed. We have also updated
some existing explanations, including adding more recent references to methodological
evidence, and used some better examples. We have removed the glossary, which is now
available on the CONSORT website (www.consort-statement.org). Where possible, we describe
the findings of relevant empirical studies. Many excellent books on clinical trials
offer fuller discussion of methodological issues.60 61 62 Finally, for convenience,
we sometimes refer to “treatments” and “patients,” although we recognise that not
all interventions evaluated in RCTs are treatments and not all participants are patients.
Checklist items
Title and abstract
Item 1a. Identification as a randomised trial in the title.
Example—“Smoking reduction with oral nicotine inhalers: double blind, randomised clinical
trial of efficacy and safety.”63
Explanation—The ability to identify a report of a randomised trial in an electronic
database depends to a large extent on how it was indexed. Indexers may not classify
a report as a randomised trial if the authors do not explicitly report this information.64
To help ensure that a study is appropriately indexed and easily identified, authors
should use the word “randomised” in the title to indicate that the participants were
randomly assigned to their comparison groups.
Item 1b. Structured summary of trial design, methods, results, and conclusions
For specific guidance see CONSORT for abstracts.45 65
Explanation—Clear, transparent, and sufficiently detailed abstracts are important
because readers often base their assessment of a trial on such information. Some readers
use an abstract as a screening tool to decide whether to read the full article. However,
as not all trials are freely available and some health professionals do not have access
to the full trial reports, healthcare decisions are sometimes made on the basis of
abstracts of randomised trials.66
A journal abstract should contain sufficient information about a trial to serve as
an accurate record of its conduct and findings, providing optimal information about
the trial within the space constraints and format of a journal. A properly constructed
and written abstract helps individuals to assess quickly the relevance of the findings
and aids the retrieval of relevant reports from electronic databases.67 The abstract
should accurately reflect what is included in the full journal article and should
not include information that does not appear in the body of the paper. Studies comparing
the accuracy of information reported in a journal abstract with that reported in the
text of the full publication have found claims that are inconsistent with, or missing
from, the body of the full article.68 69 70 71 Conversely, omitting important harms
from the abstract could seriously mislead someone’s interpretation of the trial findings.42
72
A recent extension to the CONSORT statement provides a list of essential items that
authors should include when reporting the main results of a randomised trial in a
journal (or conference) abstract (see table 2).45 We strongly recommend the use of
structured abstracts for reporting randomised trials. They provide readers with information
about the trial under a series of headings pertaining to the design, conduct, analysis,
and interpretation.73 Some studies have found that structured abstracts are of higher
quality than the more traditional descriptive abstracts74 75 and that they allow readers
to find information more easily.76 We recognise that many journals have developed
their own structure and word limit for reporting abstracts. It is not our intention
to suggest changes to these formats, but to recommend what information should be reported.
Table 2
Items to include when reporting a randomised trial in a journal abstract
Item
Description
Authors
Contact details for the corresponding author
Trial design
Description of the trial design (such as parallel, cluster, non-inferiority)
Methods:
Participants
Eligibility criteria for participants and the settings where the data were collected
Interventions
Interventions intended for each group
Objective
Specific objective or hypothesis
Outcome
Clearly defined primary outcome for this report
Randomisation
How participants were allocated to interventions
Blinding (masking)
Whether participants, care givers, and those assessing the outcomes were blinded to
group assignment
Results:
Numbers randomised
Number of participants randomised to each group
Recruitment
Trial status
Numbers analysed
Number of participants analysed in each group
Outcome
For the primary outcome, a result for each group and the estimated effect size and
its precision
Harms
Important adverse events or side effects
Conclusions
General interpretation of the results
Trial registration
Registration number and name of trial register
Funding
Source of funding
Introduction
Item 2a. Scientific background and explanation of rationale
Example—“Surgery is the treatment of choice for patients with disease stage I and
II non-small cell lung cancer (NSCLC) … An NSCLC meta-analysis combined the results
from eight randomised trials of surgery versus surgery plus adjuvant cisplatin-based
chemotherapy and showed a small, but not significant (p=0.08), absolute survival benefit
of around 5% at 5 years (from 50% to 55%). At the time the current trial was designed
(mid-1990s), adjuvant chemotherapy had not become standard clinical practice … The
clinical rationale for neo-adjuvant chemotherapy is three-fold: regression of the
primary cancer could be achieved thereby facilitating and simplifying or reducing
subsequent surgery; undetected micro-metastases could be dealt with at the start of
treatment; and there might be inhibition of the putative stimulus to residual cancer
by growth factors released by surgery and by subsequent wound healing … The current
trial was therefore set up to compare, in patients with resectable NSCLC, surgery
alone versus three cycles of platinum-based chemotherapy followed by surgery in terms
of overall survival, quality of life, pathological staging, resectability rates, extent
of surgery, and time to and site of relapse.”77
Explanation—Typically, the introduction consists of free flowing text, in which authors
explain the scientific background and rationale for their trial, and its general outline.
It may also be appropriate to include here the objectives of the trial (see item 2b).The
rationale may be explanatory (for example, to assess the possible influence of a drug
on renal function) or pragmatic (for example, to guide practice by comparing the benefits
and harms of two treatments). Authors should report any evidence of the benefits and
harms of active interventions included in a trial and should suggest a plausible explanation
for how the interventions might work, if this is not obvious.78
The Declaration of Helsinki states that biomedical research involving people should
be based on a thorough knowledge of the scientific literature.79 That is, it is unethical
to expose humans unnecessarily to the risks of research. Some clinical trials have
been shown to have been unnecessary because the question they addressed had been or
could have been answered by a systematic review of the existing literature.80 81 Thus,
the need for a new trial should be justified in the introduction. Ideally, it should
include a reference to a systematic review of previous similar trials or a note of
the absence of such trials.82
Item 2b. Specific objectives or hypotheses
Example—“In the current study we tested the hypothesis that a policy of active management
of nulliparous labour would: 1. reduce the rate of caesarean section, 2. reduce the
rate of prolonged labour; 3. not influence maternal satisfaction with the birth experience.”83
Explanation—Objectives are the questions that the trial was designed to answer. They
often relate to the efficacy of a particular therapeutic or preventive intervention.
Hypotheses are pre-specified questions being tested to help meet the objectives. Hypotheses
are more specific than objectives and are amenable to explicit statistical evaluation.
In practice, objectives and hypotheses are not always easily differentiated. Most
reports of RCTs provide adequate information about trial objectives and hypotheses.84
Methods
Item 3a. Description of trial design (such as parallel, factorial) including allocation
ratio
Example—“This was a multicenter, stratified (6 to 11 years and 12 to 17 years of age,
with imbalanced randomisation [2:1]), double-blind, placebo-controlled, parallel-group
study conducted in the United States (41 sites).”85
Explanation—The word “design” is often used to refer to all aspects of how a trial
is set up, but it also has a narrower interpretation. Many specific aspects of the
broader trial design, including details of randomisation and blinding, are addressed
elsewhere in the CONSORT checklist. Here we seek information on the type of trial,
such as parallel group or factorial, and the conceptual framework, such as superiority
or non-inferiority, and other related issues not addressed elsewhere in the checklist.
The CONSORT statement focuses mainly on trials with participants individually randomised
to one of two “parallel” groups. In fact, little more than half of published trials
have such a design.16 The main alternative designs are multi-arm parallel, crossover,
cluster,40 and factorial designs. Also, most trials are set to identify the superiority
of a new intervention, if it exists, but others are designed to assess non-inferiority
or equivalence.39 It is important that researchers clearly describe these aspects
of their trial, including the unit of randomisation (such as patient, GP practice,
lesion). It is desirable also to include these details in the abstract (see item 1b).
If a less common design is employed, authors are encouraged to explain their choice,
especially as such designs may imply the need for a larger sample size or more complex
analysis and interpretation.
Although most trials use equal randomisation (such as 1:1 for two groups), it is helpful
to provide the allocation ratio explicitly. For drug trials, specifying the phase
of the trial (I-IV) may also be relevant.
Item 3b. Important changes to methods after trial commencement (such as eligibility
criteria), with reasons
Example—“Patients were randomly assigned to one of six parallel groups, initially
in 1:1:1:1:1:1 ratio, to receive either one of five otamixaban … regimens … or an
active control of unfractionated heparin … an independent Data Monitoring Committee
reviewed unblinded data for patient safety; no interim analyses for efficacy or futility
were done. During the trial, this committee recommended that the group receiving the
lowest dose of otamixaban (0·035 mg/kg/h) be discontinued because of clinical evidence
of inadequate anticoagulation. The protocol was immediately amended in accordance
with that recommendation, and participants were subsequently randomly assigned in
2:2:2:2:1 ratio to the remaining otamixaban and control groups, respectively.”86
Explanation—A few trials may start without any fixed plan (that is, are entirely exploratory),
but the most will have a protocol that specifies in great detail how the trial will
be conducted. There may be deviations from the original protocol, as it is impossible
to predict every possible change in circumstances during the course of a trial. Some
trials will therefore have important changes to the methods after trial commencement.
Changes could be due to external information becoming available from other studies,
or internal financial difficulties, or could be due to a disappointing recruitment
rate. Such protocol changes should be made without breaking the blinding on the accumulating
data on participants’ outcomes. In some trials, an independent data monitoring committee
will have as part of its remit the possibility of recommending protocol changes based
on seeing unblinded data. Such changes might affect the study methods (such as changes
to treatment regimens, eligibility criteria, randomisation ratio, or duration of follow-up)
or trial conduct (such as dropping a centre with poor data quality).87
Some trials are set up with a formal “adaptive” design. There is no universally accepted
definition of these designs, but a working definition might be “a multistage study
design that uses accumulating data to decide how to modify aspects of the study without
undermining the validity and integrity of the trial.”88 The modifications are usually
to the sample sizes and the number of treatment arms and can lead to decisions being
made more quickly and with more efficient use of resources. There are, however, important
ethical, statistical, and practical issues in considering such a design.89 90
Whether the modifications are explicitly part of the trial design or in response to
changing circumstances, it is essential that they are fully reported to help the reader
interpret the results. Changes from protocols are not currently well reported. A review
of comparisons with protocols showed that about half of journal articles describing
RCTs had an unexplained discrepancy in the primary outcomes.57 Frequent unexplained
discrepancies have also been observed for details of randomisation, blinding,91 and
statistical analyses.92
Item 4a. Eligibility criteria for participants
Example—“Eligible participants were all adults aged 18 or over with HIV who met the
eligibility criteria for antiretroviral therapy according to the Malawian national
HIV treatment guidelines (WHO clinical stage III or IV or any WHO stage with a CD4
count <250/mm3) and who were starting treatment with a BMI <18.5. Exclusion criteria
were pregnancy and lactation or participation in another supplementary feeding programme.”93
Explanation—A comprehensive description of the eligibility criteria used to select
the trial participants is needed to help readers interpret the study. In particular,
a clear understanding of these criteria is one of several elements required to judge
to whom the results of a trial apply—that is, the trial’s generalisability (applicability)
and relevance to clinical or public health practice (see item 21).94 A description
of the method of recruitment, such as by referral or self selection (for example,
through advertisements), is also important in this context. Because they are applied
before randomisation, eligibility criteria do not affect the internal validity of
a trial, but they are central to its external validity.
Typical and widely accepted selection criteria relate to the nature and stage of the
disease being studied, the exclusion of persons thought to be particularly vulnerable
to harm from the study intervention, and to issues required to ensure that the study
satisfies legal and ethical norms. Informed consent by study participants, for example,
is typically required in intervention studies. The common distinction between inclusion
and exclusion criteria is unnecessary; the same criterion can be phrased to include
or exclude participants.95
Despite their importance, eligibility criteria are often not reported adequately.
For example, eight published trials leading to clinical alerts by the National Institutes
of Health specified an average of 31 eligibility criteria in their protocols, but
only 63% of the criteria were mentioned in the journal articles, and only 19% were
mentioned in the clinical alerts.96 Similar deficiencies were found for HIV clinical
trials.97 Among 364 reports of RCTs in surgery, 25% did not specify any eligibility
criteria.98
Item 4b. Settings and locations where the data were collected
Example—“The study took place at the antiretroviral therapy clinic of Queen Elizabeth
Central Hospital in Blantyre, Malawi, from January 2006 to April 2007. Blantyre is
the major commercial city of Malawi, with a population of 1 000 000 and an estimated
HIV prevalence of 27% in adults in 2004.”93
Explanation—Along with the eligibility criteria for participants (see item 4a) and
the description of the interventions (see item 5), information on the settings and
locations is crucial to judge the applicability and generalisability of a trial. Were
participants recruited from primary, secondary, or tertiary health care or from the
community? Healthcare institutions vary greatly in their organisation, experience,
and resources and the baseline risk for the condition under investigation. Other aspects
of the setting (including the social, economic, and cultural environment and the climate)
may also affect a study’s external validity.
Authors should report the number and type of settings and describe the care providers
involved. They should report the locations in which the study was carried out, including
the country, city if applicable, and immediate environment (for example, community,
office practice, hospital clinic, or inpatient unit). In particular, it should be
clear whether the trial was carried out in one or several centres (“multicentre trials”).
This description should provide enough information so that readers can judge whether
the results of the trial could be relevant to their own setting. The environment in
which the trial is conducted may differ considerably from the setting in which the
trial’s results are later used to guide practice and policy.94 99 Authors should also
report any other information about the settings and locations that could have influenced
the observed results, such as problems with transportation that might have affected
patient participation or delays in administering interventions.
Item 5. The interventions for each group with sufficient details to allow replication,
including how and when they were actually administered
Examples—“In POISE, patients received the first dose of the study drug (ie, oral extended-release
metoprolol 100 mg or matching placebo) 2-4 h before surgery. Study drug administration
required a heart rate of 50 bpm or more and a systolic blood pressure of 100 mm Hg
or greater; these haemodynamics were checked before each administration. If, at any
time during the first 6 h after surgery, heart rate was 80 bpm or more and systolic
blood pressure was 100 mm Hg or higher, patients received their first postoperative
dose (extended-release metoprolol 100 mg or matched placebo) orally. If the study
drug was not given during the first 6 h, patients received their first postoperative
dose at 6 h after surgery. 12 h after the first postoperative dose, patients started
taking oral extended-release metoprolol 200 mg or placebo every day for 30 days. If
a patient’s heart rate was consistently below 45 bpm or their systolic blood pressure
dropped below 100 mm Hg, study drug was withheld until their heart rate or systolic
blood pressure recovered; the study drug was then restarted at 100 mg once daily.
Patients whose heart rate was consistently 45-49 bpm and systolic blood pressure exceeded
100 mm Hg delayed taking the study drug for 12 h.”100
“Patients were randomly assigned to receive a custom-made neoprene splint to be worn
at night or to usual care. The splint was a rigid rest orthosis recommended for use
only at night. It covered the base of the thumb and the thenar eminence but not the
wrist (Figure 1). Splints were made by 3 trained occupational therapists, who adjusted
the splint for each patient so that the first web could be opened and the thumb placed
in opposition with the first long finger. Patients were encouraged to contact the
occupational therapist if they felt that the splint needed adjustment, pain increased
while wearing the splint, or they had adverse effects (such as skin erosion). Because
no treatment can be considered the gold standard in this situation, patients in the
control and intervention groups received usual care at the discretion of their physician
(general practitioner or rheumatologist). We decided not to use a placebo because,
to our knowledge, no placebo for splinting has achieved successful blinding of patients,
as recommended.”101
Explanation—Authors should describe each intervention thoroughly, including control
interventions. The description should allow a clinician wanting to use the intervention
to know exactly how to administer the intervention that was evaluated in the trial.102
For a drug intervention, information would include the drug name, dose, method of
administration (such as oral, intravenous), timing and duration of administration,
conditions under which interventions are withheld, and titration regimen if applicable.
If the control group is to receive “usual care” it is important to describe thoroughly
what that constitutes. If the control group or intervention group is to receive a
combination of interventions the authors should provide a thorough description of
each intervention, an explanation of the order in which the combination of interventions
are introduced or withdrawn, and the triggers for their introduction if applicable.
Specific extensions of the CONSORT statement address the reporting of non-pharmacologic
and herbal interventions and their particular reporting requirements (such as expertise,
details of how the interventions were standardised).43 44 We recommend readers consult
the statements for non-pharmacologic and herbal interventions as appropriate.
Item 6a. Completely defined pre-specified primary and secondary outcome measures,
including how and when they were assessed
Example—“The primary endpoint with respect to efficacy in psoriasis was the proportion
of patients achieving a 75% improvement in psoriasis activity from baseline to 12
weeks as measured by the PASI [psoriasis area and severity index] Additional analyses
were done on the percentage change in PASI scores and improvement in target psoriasis
lesions.”103
Explanation—All RCTs assess response variables, or outcomes (end points), for which
the groups are compared. Most trials have several outcomes, some of which are of more
interest than others. The primary outcome measure is the pre-specified outcome considered
to be of greatest importance to relevant stakeholders (such a patients, policy makers,
clinicians, funders) and is usually the one used in the sample size calculation (see
item 7). Some trials may have more than one primary outcome. Having several primary
outcomes, however, incurs the problems of interpretation associated with multiplicity
of analyses (see items 18 and 20) and is not recommended. Primary outcomes should
be explicitly indicated as such in the report of an RCT. Other outcomes of interest
are secondary outcomes (additional outcomes). There may be several secondary outcomes,
which often include unanticipated or unintended effects of the intervention (see item
19), although harms should always be viewed as important whether they are labelled
primary or secondary.
All outcome measures, whether primary or secondary, should be identified and completely
defined. The principle here is that the information provided should be sufficient
to allow others to use the same outcomes.102 When outcomes are assessed at several
time points after randomisation, authors should also indicate the pre-specified time
point of primary interest. For many non-pharmacological interventions it is helpful
to specify who assessed outcomes (for example, if special skills are required to do
so) and how many assessors there were.43
Where available and appropriate, the use of previously developed and validated scales
or consensus guidelines should be reported,104 105 both to enhance quality of measurement
and to assist in comparison with similar studies.106 For example, assessment of quality
of life is likely to be improved by using a validated instrument.107 Authors should
indicate the provenance and properties of scales.
More than 70 outcomes were used in 196 RCTs of non-steroidal anti-inflammatory drugs
for rheumatoid arthritis,108 and 640 different instruments had been used in 2000 trials
in schizophrenia, of which 369 had been used only once.33 Investigation of 149 of
those 2000 trials showed that unpublished scales were a source of bias. In non-pharmacological
trials, a third of the claims of treatment superiority based on unpublished scales
would not have been made if a published scale had been used.109 Similar data have
been reported elsewhere.110 111 Only 45% of a cohort of 519 RCTs published in 2000
specified the primary outcome16; this compares with 53% for a similar cohort of 614
RCTs published in 2006.17
Item 6b. Any changes to trial outcomes after the trial commenced, with reasons
Example—“The original primary endpoint was all-cause mortality, but, during a masked
analysis, the data and safety monitoring board noted that overall mortality was lower
than had been predicted and that the study could not be completed with the sample
size and power originally planned. The steering committee therefore decided to adopt
co-primary endpoints of all-cause mortality (the original primary endpoint), together
with all-cause mortality or cardiovascular hospital admissions (the first prespecified
secondary endpoint).”112
Explanation—There are many reasons for departures from the initial study protocol
(see item 24). Authors should report all major changes to the protocol, including
unplanned changes to eligibility criteria, interventions, examinations, data collection,
methods of analysis, and outcomes. Such information is not always reported.
As indicated earlier (see item 6a), most trials record multiple outcomes, with the
risk that results will be reported for only a selected subset (see item 17). Pre-specification
and reporting of primary and secondary outcomes (see item 6a) should remove such a
risk. In some trials, however, circumstances require a change in the way an outcome
is assessed or even, as in the example above, a switch to a different outcome. For
example, there may be external evidence from other trials or systematic reviews suggesting
the end point might not be appropriate, or recruitment or the overall event rate in
the trial may be lower than expected.112 Changing an end point based on unblinded
data is much more problematic, although it may be specified in the context of an adaptive
trial design.88 Authors should identify and explain any such changes. Likewise, any
changes after the trial began of the designation of outcomes as primary or secondary
should be reported and explained.
A comparison of protocols and publications of 102 randomised trials found that 62%
of trials reports had at least one primary outcome that was changed, introduced, or
omitted compared with the protocol.55 Primary outcomes also differed between protocols
and publications for 40% of a cohort of 48 trials funded by the Canadian Institutes
of Health Research.113 Not one of the subsequent 150 trial reports mentioned, let
alone explained, changes from the protocol. Similar results from other studies have
been reported recently in a systematic review of empirical studies examining outcome
reporting bias.57
Item 7a. How sample size was determined
Examples—“To detect a reduction in PHS (postoperative hospital stay) of 3 days (SD
5 days), which is in agreement with the study of Lobo et al17 with a two-sided 5%
significance level and a power of 80%, a sample size of 50 patients per group was
necessary, given an anticipated dropout rate of 10%. To recruit this number of patients
a 12-month inclusion period was anticipated.”114
“Based on an expected incidence of the primary composite endpoint of 11% at 2.25 years
in the placebo group, we calculated that we would need 950 primary endpoint events
and a sample size of 9650 patients to give 90% power to detect a significant difference
between ivabradine and placebo, corresponding to a 19% reduction of relative risk
(with a two-sided type 1 error of 5%). We initially designed an event-driven trial,
and planned to stop when 950 primary endpoint events had occurred. However, the incidence
of the primary endpoint was higher than predicted, perhaps because of baseline characteristics
of the recruited patients, who had higher risk than expected (e.g., lower proportion
of NYHA class I and higher rates of diabetes and hypertension). We calculated that
when 950 primary endpoint events had occurred, the most recently included patients
would only have been treated for about 3 months. Therefore, in January 2007, the executive
committee decided to change the study from being event-driven to time-driven, and
to continue the study until the patients who were randomised last had been followed
up for 12 months. This change did not alter the planned study duration of 3 years.”115
Explanation—For scientific and ethical reasons, the sample size for a trial needs
to be planned carefully, with a balance between medical and statistical considerations.
Ideally, a study should be large enough to have a high probability (power) of detecting
as statistically significant a clinically important difference of a given size if
such a difference exists. The size of effect deemed important is inversely related
to the sample size necessary to detect it; that is, large samples are necessary to
detect small differences. Elements of the sample size calculation are (1) the estimated
outcomes in each group (which implies the clinically important target difference between
the intervention groups); (2) the α (type I) error level; (3) the statistical power
(or the β (type II) error level); and (4), for continuous outcomes, the standard deviation
of the measurements.116 The interplay of these elements and their reporting will differ
for cluster trials40 and non-inferiority and equivalence trials.39
Authors should indicate how the sample size was determined. If a formal power calculation
was used, the authors should identify the primary outcome on which the calculation
was based (see item 6a), all the quantities used in the calculation, and the resulting
target sample size per study group. It is preferable to quote the expected result
in the control group and the difference between the groups one would not like to overlook.
Alternatively, authors could present the percentage with the event or mean for each
group used in their calculations. Details should be given of any allowance made for
attrition or non-compliance during the study.
Some methodologists have written that so called underpowered trials may be acceptable
because they could ultimately be combined in a systematic review and meta-analysis,117
118 119 and because some information is better than no information. Of note, important
caveats apply—such as the trial should be unbiased, reported properly, and published
irrespective of the results, thereby becoming available for meta-analysis.118 On the
other hand, many medical researchers worry that underpowered trials with indeterminate
results will remain unpublished and insist that all trials should individually have
“sufficient power.” This debate will continue, and members of the CONSORT Group have
varying views. Critically however, the debate and those views are immaterial to reporting
a trial. Whatever the power of a trial, authors need to properly report their intended
size with all their methods and assumptions.118 That transparently reveals the power
of the trial to readers and gives them a measure by which to assess whether the trial
attained its planned size.
In some trials, interim analyses are used to help decide whether to stop early or
to continue recruiting sometimes beyond the planned trial end (see item 7b). If the
actual sample size differed from the originally intended sample size for some other
reason (for example, because of poor recruitment or revision of the target sample
size), the explanation should be given.
Reports of studies with small samples frequently include the erroneous conclusion
that the intervention groups do not differ, when in fact too few patients were studied
to make such a claim.120 Reviews of published trials have consistently found that
a high proportion of trials have low power to detect clinically meaningful treatment
effects.121 122 123 In reality, small but clinically meaningful true differences are
much more likely than large differences to exist, but large trials are required to
detect them.124
In general, the reported sample sizes in trials seem small. The median sample size
was 54 patients in 196 trials in arthritis,108 46 patients in 73 trials in dermatology,8
and 65 patients in 2000 trials in schizophrenia.33 These small sample sizes are consistent
with those of a study of 519 trials indexed in PubMed in December 200016 and a similar
cohort of trials (n=616) indexed in PubMed in 2006,17 where the median number of patients
recruited for parallel group trials was 80 across both years. Moreover, many reviews
have found that few authors report how they determined the sample size.8 14 32 33
123
There is little merit in a post hoc calculation of statistical power using the results
of a trial; the power is then appropriately indicated by confidence intervals (see
item 17).125
Item 7b. When applicable, explanation of any interim analyses and stopping guidelines
Examples—“Two interim analyses were performed during the trial. The levels of significance
maintained an overall P value of 0.05 and were calculated according to the O’Brien-Fleming
stopping boundaries. This final analysis used a Z score of 1.985 with an associated
P value of 0.0471.”126
“An independent data and safety monitoring board periodically reviewed the efficacy
and safety data. Stopping rules were based on modified Haybittle-Peto boundaries of
4 SD in the first half of the study and 3 SD in the second half for efficacy data,
and 3 SD in the first half of the study and 2 SD in the second half for safety data.
Two formal interim analyses of efficacy were performed when 50% and 75% of the expected
number of primary events had accrued; no correction of the reported P value for these
interim tests was performed.”127
Explanation—Many trials recruit participants over a long period. If an intervention
is working particularly well or badly, the study may need to be ended early for ethical
reasons. This concern can be addressed by examining results as the data accumulate,
preferably by an independent data monitoring committee. However, performing multiple
statistical examinations of accumulating data without appropriate correction can lead
to erroneous results and interpretations.128 If the accumulating data from a trial
are examined at five interim analyses that use a P value of 0.05, the overall false
positive rate is nearer to 19% than to the nominal 5%.
Several group sequential statistical methods are available to adjust for multiple
analyses,129 130 131 and their use should be pre-specified in the trial protocol.
With these methods, data are compared at each interim analysis, and a P value less
than the critical value specified by the group sequential method indicates statistical
significance. Some trialists use group sequential methods as an aid to decision making,132
whereas others treat them as a formal stopping rule (with the intention that the trial
will cease if the observed P value is smaller than the critical value).
Authors should report whether they or a data monitoring committee took multiple “looks”
at the data and, if so, how many there were, what triggered them, the statistical
methods used (including any formal stopping rule), and whether they were planned before
the start of the trial, before the data monitoring committee saw any interim data
by allocation, or some time thereafter. This information is often not included in
published trial reports,133 even in trials that report stopping earlier than planned.134
Item 8a. Method used to generate the random allocation sequence
Examples—“Independent pharmacists dispensed either active or placebo inhalers according
to a computer generated randomisation list.”63
“For allocation of the participants, a computer-generated list of random numbers was
used.”135
Explanation—Participants should be assigned to comparison groups in the trial on the
basis of a chance (random) process characterised by unpredictability (see box 1).
Authors should provide sufficient information that the reader can assess the methods
used to generate the random allocation sequence and the likelihood of bias in group
assignment. It is important that information on the process of randomisation is included
in the body of the main article and not as a separate supplementary file; where it
can be missed by the reader.
The term “random” has a precise technical meaning. With random allocation, each participant
has a known probability of receiving each intervention before one is assigned, but
the assigned intervention is determined by a chance process and cannot be predicted.
However, “random” is often used inappropriately in the literature to describe trials
in which non-random, deterministic allocation methods were used, such as alternation,
hospital numbers, or date of birth. When investigators use such non-random methods,
they should describe them precisely and should not use the term “random” or any variation
of it. Even the term “quasi-random” is unacceptable for describing such trials. Trials
based on non-random methods generally yield biased results.2 3 4 136 Bias presumably
arises from the inability to conceal these allocation systems adequately (see item
9).
Many methods of sequence generation are adequate. However, readers cannot judge adequacy
from such terms as “random allocation,” “randomisation,” or “random” without further
elaboration. Authors should specify the method of sequence generation, such as a random-number
table or a computerised random number generator. The sequence may be generated by
the process of minimisation, a non-random but generally acceptable method (see box
2).
Box 2: Randomisation and minimisation
Simple randomisation—Pure randomisation based on a single allocation ratio is known
as simple randomisation. Simple randomisation with a 1:1 allocation ratio is analogous
to a coin toss, although we do not advocate coin tossing for randomisation in an RCT.
“Simple” is somewhat of a misnomer. While other randomisation schemes sound complex
and more sophisticated, in reality, simple randomisation is elegantly sophisticated
in that it is more unpredictable and surpasses the bias prevention levels of all other
alternatives.
Restricted randomisation—Any randomised approach that is not simple randomisation.
Blocked randomisation is the most common form. Other means of restricted randomisation
include replacement, biased coin, and urn randomisation, although these are used much
less frequently.141
Blocked randomisation—Blocking is used to ensure that comparison groups will be generated
according to a predetermined ratio, usually 1:1 or groups of approximately the same
size. Blocking can be used to ensure close balance of the numbers in each group at
any time during the trial. For every block of eight participants, for example, four
would be allocated to each arm of the trial.142 Improved balance comes at the cost
of reducing the unpredictability of the sequence. Although the order of interventions
varies randomly within each block, a person running the trial could deduce some of
the next treatment allocations if he or she knew the block size.143 Blinding the interventions,
using larger block sizes, and randomly varying the block size can ameliorate this
problem.
Stratified randomisation—Stratification is used to ensure good balance of participant
characteristics in each group. By chance, particularly in small trials, study groups
may not be well matched for baseline characteristics, such as age and stage of disease.
This weakens the trial’s credibility.144 Such imbalances can be avoided without sacrificing
the advantages of randomisation. Stratification ensures that the numbers of participants
receiving each intervention are closely balanced within each stratum. Stratified randomisation
is achieved by performing a separate randomisation procedure within each of two or
more subsets of participants (for example, those defining each study centre, age,
or disease severity). Stratification by centre is common in multicentre trials. Stratification
requires some form of restriction (such as blocking within strata). Stratification
without blocking is ineffective.
Minimisation—Minimisation ensures balance between intervention groups for several
selected patient factors (such as age).22 60 The first patient is truly randomly allocated;
for each subsequent participant, the treatment allocation that minimises the imbalance
on the selected factors between groups at that time is identified. That allocation
may then be used, or a choice may be made at random with a heavy weighting in favour
of the intervention that would minimise imbalance (for example, with a probability
of 0.8). The use of a random component is generally preferable. Minimisation has the
advantage of making small groups closely similar in terms of participant characteristics
at all stages of the trial. Minimisation offers the only acceptable alternative to
randomisation, and some have argued that it is superior.145 On the other hand, minimisation
lacks the theoretical basis for eliminating bias on all known and unknown factors.
Nevertheless, in general, trials that use minimisation are considered methodologically
equivalent to randomised trials, even when a random element is not incorporated.
In some trials, participants are intentionally allocated in unequal numbers to each
intervention: for example, to gain more experience with a new procedure or to limit
costs of the trial. In such cases, authors should report the randomisation ratio (for
example, 2:1 or two treatment participants per each control participant) (see item
3a).
In a representative sample of PubMed indexed trials in 2000, only 21% reported an
adequate approach to random sequence generation16; this increased to 34% for a similar
cohort of PubMed indexed trials in 2006.17 In more than 90% of these cases, researchers
used a random number generator on a computer or a random number table.
Item 8b. Type of randomisation; details of any restriction (such as blocking and block
size)
Examples—“Randomization sequence was created using Stata 9.0 (StataCorp, College Station,
TX) statistical software and was stratified by center with a 1:1 allocation using
random block sizes of 2, 4, and 6.”137
“Participants were randomly assigned following simple randomization procedures (computerized
random numbers) to 1 of 2 treatment groups.”138
Explanation—In trials of several hundred participants or more simple randomisation
can usually be trusted to generate similar numbers in the two trial groups139 and
to generate groups that are roughly comparable in terms of known and unknown prognostic
variables.140 For smaller trials (see item 7a)—and even for trials that are not intended
to be small, as they may stop before reaching their target size—some restricted randomisation
(procedures to help achieve balance between groups in size or characteristics) may
be useful (see box 2).
It is important to indicate whether no restriction was used, by stating such or by
stating that “simple randomisation” was done. Otherwise, the methods used to restrict
the randomisation, along with the method used for random selection, should be specified.
For block randomisation, authors should provide details on how the blocks were generated
(for example, by using a permuted block design with a computer random number generator),
the block size or sizes, and whether the block size was fixed or randomly varied.
If the trialists became aware of the block size(s), that information should also be
reported as such knowledge could lead to code breaking. Authors should specify whether
stratification was used, and if so, which factors were involved (such as recruitment
site, sex, disease stage), the categorisation cut-off values within strata, and the
method used for restriction. Although stratification is a useful technique, especially
for smaller trials, it is complicated to implement and may be impossible if many stratifying
factors are used. If minimisation (see box 2) was used, it should be explicitly identified,
as should the variables incorporated into the scheme. If used, a random element should
be indicated.
Only 9% of 206 reports of trials in specialty journals23 and 39% of 80 trials in general
medical journals reported use of stratification.32 In each case, only about half of
the reports mentioned the use of restricted randomisation. However, these studies
and that of Adetugbo and Williams8 found that the sizes of the treatment groups in
many trials were the same or quite similar, yet blocking or stratification had not
been mentioned. One possible explanation for the close balance in numbers is underreporting
of the use of restricted randomisation.
Item 9. Mechanism used to implement the random allocation sequence (such as sequentially
numbered containers), describing any steps taken to conceal the sequence until interventions
were assigned
Examples—“The doxycycline and placebo were in capsule form and identical in appearance.
They were prepacked in bottles and consecutively numbered for each woman according
to the randomisation schedule. Each woman was assigned an order number and received
the capsules in the corresponding prepacked bottle.”146
“The allocation sequence was concealed from the researcher (JR) enrolling and assessing
participants in sequentially numbered, opaque, sealed and stapled envelopes. Aluminium
foil inside the envelope was used to render the envelope impermeable to intense light.
To prevent subversion of the allocation sequence, the name and date of birth of the
participant was written on the envelope and a video tape made of the sealed envelope
with participant details visible. Carbon paper inside the envelope transferred the
information onto the allocation card inside the envelope and a second researcher (CC)
later viewed video tapes to ensure envelopes were still sealed when participants’
names were written on them. Corresponding envelopes were opened only after the enrolled
participants completed all baseline assessments and it was time to allocate the intervention.”147
Explanation—Item 8a discussed generation of an unpredictable sequence of assignments.
Of considerable importance is how this sequence is applied when participants are enrolled
into the trial (see box 1). A generated allocation schedule should be implemented
by using allocation concealment,23 a critical mechanism that prevents foreknowledge
of treatment assignment and thus shields those who enroll participants from being
influenced by this knowledge. The decision to accept or reject a participant should
be made, and informed consent should be obtained from the participant, in ignorance
of the next assignment in the sequence.148
The allocation concealment should not be confused with blinding (see item 11). Allocation
concealment seeks to prevent selection bias, protects the assignment sequence until
allocation, and can always be successfully implemented.2 In contrast, blinding seeks
to prevent performance and ascertainment bias, protects the sequence after allocation,
and cannot always be implemented.23 Without adequate allocation concealment, however,
even random, unpredictable assignment sequences can be subverted.2 149
Centralised or “third-party” assignment is especially desirable. Many good allocation
concealment mechanisms incorporate external involvement. Use of a pharmacy or central
telephone randomisation system are two common techniques. Automated assignment systems
are likely to become more common.150 When external involvement is not feasible, an
excellent method of allocation concealment is the use of numbered containers. The
interventions (often drugs) are sealed in sequentially numbered identical containers
according to the allocation sequence.151 Enclosing assignments in sequentially numbered,
opaque, sealed envelopes can be a good allocation concealment mechanism if it is developed
and monitored diligently. This method can be corrupted, however, particularly if it
is poorly executed. Investigators should ensure that the envelopes are opaque when
held to the light, and opened sequentially and only after the participant’s name and
other details are written on the appropriate envelope.143
A number of methodological studies provide empirical evidence to support these precautions.152
153 Trials in which the allocation sequence had been inadequately or unclearly concealed
yielded larger estimates of treatment effects than did trials in which authors reported
adequate allocation concealment. These findings provide strong empirical evidence
that inadequate allocation concealment contributes to bias in estimating treatment
effects.
Despite the importance of the mechanism of allocation concealment, published reports
often omit such details. The mechanism used to allocate interventions was omitted
in reports of 89% of trials in rheumatoid arthritis,108 48% of trials in obstetrics
and gynaecology journals,23 and 44% of trials in general medical journals.32 In a
more broadly representative sample of all randomised trials indexed on PubMed, only
18% reported any allocation concealment mechanism, but some of those reported mechanisms
were inadequate.16
Item 10. Who generated the allocation sequence, who enrolled participants, and who
assigned participants to interventions
Examples—“Determination of whether a patient would be treated by streptomycin and
bed-rest (S case) or by bed-rest alone (C case) was made by reference to a statistical
series based on random sampling numbers drawn up for each sex at each centre by Professor
Bradford Hill; the details of the series were unknown to any of the investigators
or to the co-ordinator … After acceptance of a patient by the panel, and before admission
to the streptomycin centre, the appropriate numbered envelope was opened at the central
office; the card inside told if the patient was to be an S or a C case, and this information
was then given to the medical officer of the centre.”24
“Details of the allocated group were given on coloured cards contained in sequentially
numbered, opaque, sealed envelopes. These were prepared at the NPEU and kept in an
agreed location on each ward. Randomisation took place at the end of the 2nd stage
of labour when the midwife considered a vaginal birth was imminent. To enter a women
into the study, the midwife opened the next consecutively numbered envelope.”154
“Block randomisation was by a computer generated random number list prepared by an
investigator with no clinical involvement in the trial. We stratified by admission
for an oncology related procedure. After the research nurse had obtained the patient’s
consent, she telephoned a contact who was independent of the recruitment process for
allocation consignment.”155
Explanation—As noted in item 9, concealment of the allocated intervention at the time
of enrolment is especially important. Thus, in addition to knowing the methods used,
it is also important to understand how the random sequence was implemented—specifically,
who generated the allocation sequence, who enrolled participants, and who assigned
participants to trial groups.
The process of randomising participants into a trial has three different steps: sequence
generation, allocation concealment, and implementation (see box 3). Although the same
people may carry out more than one process under each heading, investigators should
strive for complete separation of the people involved with generation and allocation
concealment from the people involved in the implementation of assignments. Thus, if
someone is involved in the sequence generation or allocation concealment steps, ideally
they should not be involved in the implementation step.
Box 3: Steps in a typical randomisation process
Sequence generation
Generate allocation sequence by some random procedure
Allocation concealment
Develop allocation concealment mechanism (such as numbered, identical bottles or sequentially
numbered, sealed, opaque envelopes)
Prepare the allocation concealment mechanism using the allocation sequence from the
sequence generation step
Implementation
Enrol participants:
Assess eligibility
Discuss the trial
Obtain informed consent
Enrol participant in trial
Ascertain intervention assignment (such as opening next envelope)
Administer intervention
Even with flawless sequence generation and allocation concealment, failure to separate
creation and concealment of the allocation sequence from assignment to study group
may introduce bias. For example, the person who generated an allocation sequence could
retain a copy and consult it when interviewing potential participants for a trial.
Thus, that person could bias the enrolment or assignment process, regardless of the
unpredictability of the assignment sequence. Investigators must then ensure that the
assignment schedule is unpredictable and locked away (such as in a safe deposit box
in a building rather inaccessible to the enrolment location) from even the person
who generated it. The report of the trial should specify where the investigators stored
the allocation list.
Item 11a. If done, who was blinded after assignment to interventions (for example,
participants, care providers, those assessing outcomes) and how
Examples—“Whereas patients and physicians allocated to the intervention group were
aware of the allocated arm, outcome assessors and data analysts were kept blinded
to the allocation.”156
“Blinding and equipoise were strictly maintained by emphasising to intervention staff
and participants that each diet adheres to healthy principles, and each is advocated
by certain experts to be superior for long-term weight-loss. Except for the interventionists
(dieticians and behavioural psychologists), investigators and staff were kept blind
to diet assignment of the participants. The trial adhered to established procedures
to maintain separation between staff that take outcome measurements and staff that
deliver the intervention. Staff members who obtained outcome measurements were not
informed of the diet group assignment. Intervention staff, dieticians and behavioural
psychologists who delivered the intervention did not take outcome measurements. All
investigators, staff, and participants were kept masked to outcome measurements and
trial results.”157
Explanation—The term “blinding” or “masking” refers to withholding information about
the assigned interventions from people involved in the trial who may potentially be
influenced by this knowledge. Blinding is an important safeguard against bias, particularly
when assessing subjective outcomes.153
Benjamin Franklin has been credited as being the first to use blinding in a scientific
experiment.158 He blindfolded participants so they would not know when he was applying
mesmerism (a popular “healing fluid” of the 18th century) and in so doing showed that
mesmerism was a sham. Based on this experiment, the scientific community recognised
the power of blinding to reduce bias, and it has remained a commonly used strategy
in scientific experiments.
Box 4, on blinding terminology, defines the groups of individuals (that is, participants,
healthcare providers, data collectors, outcome adjudicators, and data analysts) who
can potentially introduce bias into a trial through knowledge of the treatment assignments.
Participants may respond differently if they are aware of their treatment assignment
(such as responding more favourably when they receive the new treatment).153 Lack
of blinding may also influence compliance with the intervention, use of co-interventions,
and risk of dropping out of the trial.
Unblinded healthcare providers may introduce similar biases, and unblinded data collectors
may differentially assess outcomes (such as frequency or timing), repeat measurements
of abnormal findings, or provide encouragement during performance testing. Unblinded
outcome adjudicators may differentially assess subjective outcomes, and unblinded
data analysts may introduce bias through the choice of analytical strategies, such
as the selection of favourable time points or outcomes, and by decisions to remove
patients from the analyses. These biases have been well documented.71 153 159 160
161 162
Blinding, unlike allocation concealment (see item 10), may not always be appropriate
or possible. An example is a trial comparing levels of pain associated with sampling
blood from the ear or thumb.163 Blinding is particularly important when outcome measures
involve some subjectivity, such as assessment of pain. Blinding of data collectors
and outcome adjudicators is unlikely to matter for objective outcomes, such as death
from any cause. Even then, however, lack of participant or healthcare provider blinding
can lead to other problems, such as differential attrition.164 In certain trials,
especially surgical trials, blinding of participants and surgeons is often difficult
or impossible, but blinding of data collectors and outcome adjudicators is often achievable.
For example, lesions can be photographed before and after treatment and assessed by
an external observer.165 Regardless of whether blinding is possible, authors can and
should always state who was blinded (that is, participants, healthcare providers,
data collectors, and outcome adjudicators).
Unfortunately, authors often do not report whether blinding was used.166 For example,
reports of 51% of 506 trials in cystic fibrosis,167 33% of 196 trials in rheumatoid
arthritis,108 and 38% of 68 trials in dermatology8 did not state whether blinding
was used. Until authors of trials improve their reporting of blinding, readers will
have difficulty in judging the validity of the trials that they may wish to use to
guide their clinical practice.
The term masking is sometimes used in preference to blinding to avoid confusion with
the medical condition of being without sight. However, “blinding” in its methodological
sense seems to be understood worldwide and is acceptable for reporting clinical trials.165
168
Box 4: Blinding terminology
In order for a technical term to have utility it must have consistency in its use
and interpretation. Authors of trials commonly use the term “double blind” and, less
commonly, the terms “single blind”or “triple blind.” A problem with this lexicon is
that there is great variability in clinician interpretations and epidemiological textbook
definitions of these terms.169 Moreover, a study of 200 RCTs reported as double blind
found 18 different combinations of groups actually blinded when the authors of these
trials were surveyed, and about one in every five of these trials—reported as double
blind—did not blind participants, healthcare providers, or data collectors.170
This research shows that terms are ambiguous and, as such, authors and editors should
abandon their use. Authors should instead explicitly report the blinding status of
the people involved for whom blinding may influence the validity of a trial.
Healthcare providers include all personnel (for example, physicians, chiropractors,
physiotherapists, nurses) who care for the participants during the trial. Data collectors
are the individuals who collect data on the trial outcomes. Outcome adjudicators are
the individuals who determine whether a participant did experience the outcomes of
interest.
Some researchers have also advocated blinding and reporting the blinding status of
the data monitoring committee and the manuscript writers.160 Blinding of these groups
is uncommon, and the value of blinding them is debated.171
Sometimes one group of individuals (such as the healthcare providers) are the same
individuals fulfilling another role in a trial (such as data collectors). Even if
this is the case, the authors should explicitly state the blinding status of these
groups to allow readers to judge the validity of the trial.
Item 11b. If relevant, description of the similarity of interventions
Example—“Jamieson Laboratories Inc provided 500-mg immediate release niacin in a white,
oblong, bisect caplet. We independently confirmed caplet content using high performance
liquid chromatography … The placebo was matched to the study drug for taste, color,
and size, and contained microcrystalline cellulose, silicon dioxide, dicalcium phosphate,
magnesium stearate, and stearic acid.”172
Explanation—Just as we seek evidence of concealment to assure us that assignment was
truly random, we seek evidence of the method of blinding. In trials with blinding
of participants or healthcare providers, authors should state the similarity of the
characteristics of the interventions (such as appearance, taste, smell, and method
of administration).35 173
Some people have advocated testing for blinding by asking participants or healthcare
providers at the end of a trial whether they think the participant received the experimental
or control intervention.174 Because participants and healthcare providers will usually
know whether the participant has experienced the primary outcome, this makes it difficult
to determine if their responses reflect failure of blinding or accurate assumptions
about the efficacy of the intervention.175 Given the uncertainty this type of information
provides, we have removed advocating reporting this type of testing for blinding from
the CONSORT 2010 Statement. We do, however, advocate that the authors report any known
compromises in blinding. For example, authors should report if it was necessary to
unblind any participants at any point during the conduct of a trial.
Item 12a. Statistical methods used to compare groups for primary and secondary outcomes
Example—“The primary endpoint was change in bodyweight during the 20 weeks of the
study in the intention-to-treat population … Secondary efficacy endpoints included
change in waist circumference, systolic and diastolic blood pressure, prevalence of
metabolic syndrome … We used an analysis of covariance (ANCOVA) for the primary endpoint
and for secondary endpoints waist circumference, blood pressure, and patient-reported
outcome scores; this was supplemented by a repeated measures analysis. The ANCOVA
model included treatment, country, and sex as fixed effects, and bodyweight at randomisation
as covariate. We aimed to assess whether data provided evidence of superiority of
each liraglutide dose to placebo (primary objective) and to orlistat (secondary objective).”176
Explanation—Data can be analysed in many ways, some of which may not be strictly appropriate
in a particular situation. It is essential to specify which statistical procedure
was used for each analysis, and further clarification may be necessary in the results
section of the report. The principle to follow is to, “Describe statistical methods
with enough detail to enable a knowledgeable reader with access to the original data
to verify the reported results” (www.icmje.org). It is also important to describe
details of the statistical analysis such as intention-to-treat analysis (see box 6).
Almost all methods of analysis yield an estimate of the treatment effect, which is
a contrast between the outcomes in the comparison groups. Authors should accompany
this by a confidence interval for the estimated effect, which indicates a central
range of uncertainty for the true treatment effect. The confidence interval may be
interpreted as the range of values for the treatment effect that is compatible with
the observed data. It is customary to present a 95% confidence interval, which gives
the range expected to include the true value in 95 of 100 similar studies.
Study findings can also be assessed in terms of their statistical significance. The
P value represents the probability that the observed data (or a more extreme result)
could have arisen by chance when the interventions did not truly differ. Actual P
values (for example, P=0.003) are strongly preferable to imprecise threshold reports
such as P<0.05.48 177
Standard methods of analysis assume that the data are “independent.” For controlled
trials, this usually means that there is one observation per participant. Treating
multiple observations from one participant as independent data is a serious error;
such data are produced when outcomes can be measured on different parts of the body,
as in dentistry or rheumatology. Data analysis should be based on counting each participant
once178 179 or should be done by using more complex statistical procedures.180 Incorrect
analysis of multiple observations per individual was seen in 123 (63%) of 196 trials
in rheumatoid arthritis.108
Item 12b. Methods for additional analyses, such as subgroup analyses and adjusted
analyses
Examples—“Proportions of patients responding were compared between treatment groups
with the Mantel-Haenszel χ2 test, adjusted for the stratification variable, methotrexate
use.”103
“Pre-specified subgroup analyses according to antioxidant treatment assignment(s),
presence or absence of prior CVD, dietary folic acid intake, smoking, diabetes, aspirin,
hormone therapy, and multivitamin use were performed using stratified Cox proportional
hazards models. These analyses used baseline exposure assessments and were restricted
to participants with nonmissing subgroup data at baseline.”181
Explanation—As is the case for primary analyses, the method of subgroup analysis should
be clearly specified. The strongest analyses are those that look for evidence of a
difference in treatment effect in complementary subgroups (for example, older and
younger participants), a comparison known as a test of interaction.182 183 A common
but misleading approach is to compare P values for separate analyses of the treatment
effect in each group. It is incorrect to infer a subgroup effect (interaction) from
one significant and one non-significant P value.184 Such inferences have a high false
positive rate.
Because of the high risk for spurious findings, subgroup analyses are often discouraged.14
185 Post hoc subgroup comparisons (analyses done after looking at the data) are especially
likely not to be confirmed by further studies. Such analyses do not have great credibility.
In some studies, imbalances in participant characteristics are adjusted for by using
some form of multiple regression analysis. Although the need for adjustment is much
less in RCTs than in epidemiological studies, an adjusted analysis may be sensible,
especially if one or more variables is thought to be prognostic.186 Ideally, adjusted
analyses should be specified in the study protocol (see item 24). For example, adjustment
is often recommended for any stratification variables (see item 8b) on the principle
that the analysis strategy should follow the design. In RCTs, the decision to adjust
should not be determined by whether baseline differences are statistically significant
(see item 16).183 187 The rationale for any adjusted analyses and the statistical
methods used should be specified.
Authors should clarify the choice of variables that were adjusted for, indicate how
continuous variables were handled, and specify whether the analysis was planned or
suggested by the data.188 Reviews of published studies show that reporting of adjusted
analyses is inadequate with regard to all of these aspects.188 189 190 191
Results
Item 13. Participant flow (a diagram is strongly recommended)
Item 13a. For each group, the numbers of participants who were randomly assigned,
received intended treatment, and were analysed for the primary outcome
Examples—See figs 2 and 3.
Fig 2 Flow diagram of a multicentre trial of fractional flow reserve versus angiography
for guiding percutaneous coronary intervention (PCI) (adapted from Tonino et al313).
The diagram includes detailed information on the excluded participants.
Fig 3 Flow diagram of minimal surgery compared with medical management for chronic
gastro-oesophageal reflux disease (adapted from Grant et al196). The diagram shows
a multicentre trial with a parallel non-randomised preference group.
Explanation—The design and conduct of some RCTs is straightforward, and the flow of
participants, particularly were there are no losses to follow-up or exclusions, through
each phase of the study can be described adequately in a few sentences. In more complex
studies, it may be difficult for readers to discern whether and why some participants
did not receive the treatment as allocated, were lost to follow-up, or were excluded
from the analysis.51 This information is crucial for several reasons. Participants
who were excluded after allocation are unlikely to be representative of all participants
in the study. For example, patients may not be available for follow-up evaluation
because they experienced an acute exacerbation of their illness or harms of treatment.22
192
Attrition as a result of loss to follow up, which is often unavoidable, needs to be
distinguished from investigator-determined exclusion for such reasons as ineligibility,
withdrawal from treatment, and poor adherence to the trial protocol. Erroneous conclusions
can be reached if participants are excluded from analysis, and imbalances in such
omissions between groups may be especially indicative of bias.192 193 194 Information
about whether the investigators included in the analysis all participants who underwent
randomisation, in the groups to which they were originally allocated (intention-to-treat
analysis (see item 16 and box 6)), is therefore of particular importance. Knowing
the number of participants who did not receive the intervention as allocated or did
not complete treatment permits the reader to assess to what extent the estimated efficacy
of therapy might be underestimated in comparison with ideal circumstances.
If available, the number of people assessed for eligibility should also be reported.
Although this number is relevant to external validity only and is arguably less important
than the other counts,195 it is a useful indicator of whether trial participants were
likely to be representative of all eligible participants.
A review of RCTs published in five leading general and internal medicine journals
in 1998 found that reporting of the flow of participants was often incomplete, particularly
with regard to the number of participants receiving the allocated intervention and
the number lost to follow-up.51 Even information as basic as the number of participants
who underwent randomisation and the number excluded from analyses was not available
in up to 20% of articles.51 Reporting was considerably more thorough in articles that
included a diagram of the flow of participants through a trial, as recommended by
CONSORT. This study informed the design of the revised flow diagram in the revised
CONSORT statement.52 53 54 The suggested template is shown in fig 1, and the counts
required are described in detail in table 3.
Table 3
Information required to document the flow of participants through each stage of a
randomised trial
Stage
Number of people included
Number of people not included or excluded
Rationale
Enrolment
People evaluated for potential enrolment
People who did not meet the inclusion criteria or met the inclusion criteria but declined
to be enrolled
These counts indicate whether trial participants were likely to be representative
of all patients seen; they are relevant to assessment of external validity only, and
they are often not available.
Randomisation
Participants randomly assigned
Crucial count for defining trial size and assessing whether a trial has been analysed
by intention to treat
Treatment allocation
Participants who completed treatment as allocated, by study group
Participants who did not complete treatment as allocated, by study group
Important counts for assessment of internal validity and interpretation of results;
reasons for not receiving treatment as allocated should be given.
Follow-up
Participants who completed treatment as allocated, by study group
Participants who did not complete treatment as allocated, by study group
Important counts for assessment of internal validity and interpretation of results;
reasons for not completing treatment or follow-up should be given.
Participants who completed follow-up as planned, by study group
Participants who did not complete follow-up as planned, by study group
Analysis
Participants included in main analysis, by study group
Participants excluded from main analysis, by study group
Crucial count for assessing whether a trial has been analysed by intention to treat;
reasons for excluding participants should be given.
Some information, such as the number of individuals assessed for eligibility, may
not always be known,14 and, depending on the nature of a trial, some counts may be
more relevant than others. It will sometimes be useful or necessary to adapt the structure
of the flow diagram to a particular trial. In some situations, other information may
usefully be added. For example, the flow diagram of a parallel group trial of minimal
surgery compared with medical management for chronic gastro-oesophageal reflux also
included a parallel non-randomised preference group (see fig 3).196
The exact form and content of the flow diagram may be varied according to specific
features of a trial. For example, many trials of surgery or vaccination do not include
the possibility of discontinuation. Although CONSORT strongly recommends using this
graphical device to communicate participant flow throughout the study, there is no
specific, prescribed format.
Item 13b. For each group, losses and exclusions after randomisation, together with
reasons
Examples—“There was only one protocol deviation, in a woman in the study group. She
had an abnormal pelvic measurement and was scheduled for elective caesarean section.
However, the attending obstetrician judged a trial of labour acceptable; caesarean
section was done when there was no progress in the first stage of labour.”197
“The monitoring led to withdrawal of nine centres, in which existence of some patients
could not be proved, or other serious violations of good clinical practice had occurred.”198
Explanation—Some protocol deviations may be reported in the flow diagram (see item
13a)—for example, participants who did not receive the intended intervention. If participants
were excluded after randomisation (contrary to the intention-to-treat principle) because
they were found not to meet eligibility criteria (see item 16), they should be included
in the flow diagram. Use of the term “protocol deviation” in published articles is
not sufficient to justify exclusion of participants after randomisation. The nature
of the protocol deviation and the exact reason for excluding participants after randomisation
should always be reported.
Item 14a. Dates defining the periods of recruitment and follow-up
Example—“Age-eligible participants were recruited … from February 1993 to September
1994 … Participants attended clinic visits at the time of randomisation (baseline)
and at 6-month intervals for 3 years.”199
Explanation—Knowing when a study took place and over what period participants were
recruited places the study in historical context. Medical and surgical therapies,
including concurrent therapies, evolve continuously and may affect the routine care
given to participants during a trial. Knowing the rate at which participants were
recruited may also be useful, especially to other investigators.
The length of follow-up is not always a fixed period after randomisation. In many
RCTs in which the outcome is time to an event, follow-up of all participants is ended
on a specific date. This date should be given, and it is also useful to report the
minimum, maximum, and median duration of follow-up.200 201
A review of reports in oncology journals that used survival analysis, most of which
were not RCTs, 201 found that nearly 80% (104 of 132 reports) included the starting
and ending dates for accrual of patients, but only 24% (32 of 132 reports) also reported
the date on which follow-up ended.
Item 14b. Why the trial ended or was stopped
Examples—“At the time of the interim analysis, the total follow-up included an estimated
63% of the total number of patient-years that would have been collected at the end
of the study, leading to a threshold value of 0.0095, as determined by the Lan-DeMets
alpha-spending function method … At the interim analysis, the RR was 0.37 in the intervention
group, as compared with the control group, with a p value of 0.00073, below the threshold
value. The Data and Safety Monitoring Board advised the investigators to interrupt
the trial and offer circumcision to the control group, who were then asked to come
to the investigation centre, where MC (medical circumcision) was advised and proposed
… Because the study was interrupted, some participants did not have a full follow-up
on that date, and their visits that were not yet completed are described as “planned”
in this article.”202
“In January 2000, problems with vaccine supply necessitated the temporary nationwide
replacement of the whole cell component of the combined DPT/Hib vaccine with acellular
pertussis vaccine. As this vaccine has a different local reactogenicity profile, we
decided to stop the trial early.”203
Explanation—Arguably, trialists who arbitrarily conduct unplanned interim analyses
after very few events accrue using no statistical guidelines run a high risk of “catching”
the data at a random extreme, which likely represents a large overestimate of treatment
benefit.204
Readers will likely draw weaker inferences from a trial that was truncated in a data-driven
manner versus one that reports its findings after reaching a goal independent of results.
Thus, RCTs should indicate why the trial came to an end (see box 5). The report should
also disclose factors extrinsic to the trial that affected the decision to stop the
trial, and who made the decision to stop the trial, including reporting the role the
funding agency played in the deliberations and in the decision to stop the trial.134
A systematic review of 143 RCTs stopped earlier than planned for benefit found that
these trials reported stopping after accruing a median of 66 events, estimated a median
relative risk of 0.47 and a strong relation between the number of events accrued and
the size of the effect, with smaller trials with fewer events yielding the largest
treatment effects (odds ratio 31, 95% confidence interval 12 to 82).134 While an increasing
number of trials published in high impact medical journals report stopping early,
only 0.1% of trials reported stopping early for benefit, which contrasts with estimates
arising from simulation studies205 and surveys of data safety and monitoring committees.206
Thus, many trials accruing few participants and reporting large treatment effects
may have been stopped earlier than planned but failed to report this action.
Box 5: Early stopping
RCTs can end when they reach their sample size goal, their event count goal, their
length of follow-up goal, or when they reach their scheduled date of closure. In these
situations the trial will stop in a manner independent of its results, and stopping
is unlikely to introduce bias in the results. Alternatively, RCTs can stop earlier
than planned because of the result of an interim analysis showing larger than expected
benefit or harm on the experimental intervention. Also RCTs can stop earlier than
planned when investigators find evidence of no important difference between experimental
and control interventions (that is, stopping for futility). In addition, trials may
stop early because the trial becomes unviable: funding vanishes, researchers cannot
access eligible patients or study interventions, or the results of other studies make
the research question irrelevant.
Full reporting of why a trial ended is important for evidence based decision making
(see item 14b). Researchers examining why 143 trials stopped early for benefit found
that many failed to report key methodological information regarding how the decision
to stop was reached—the planned sample size (n=28), interim analysis after which the
trial was stopped (n=45), or whether a stopping rule informed the decision (n=48).134
Item 7b of the checklist requires the reporting of timing of interim analyses, what
triggered them, how many took place, whether these were planned or ad hoc, and whether
there were statistical guidelines and stopping rules in place a priori. Furthermore,
it is helpful to know whether an independent data monitoring committee participated
in the analyses (and who composed it, with particular attention to the role of the
funding source) and who made the decision to stop. Often the data safety and monitoring
committee makes recommendations and the funders (sponsors) or the investigators make
the decision to stop.
Trials that stop early for reasons apparently independent of trial findings, and trials
that reach their planned termination, are unlikely to introduce bias by stopping.207
In these cases, the authors should report whether interim analyses took place and
whether these results were available to the funder.
The push for trials that change the intervention in response to interim results, thus
enabling a faster evaluation of promising interventions for rapidly evolving and fatal
conditions, will require even more careful reporting of the process and decision to
stop trials early.208
Item 15. A table showing baseline demographic and clinical characteristics for each
group
Example—See table 4
Table 4
Example of reporting baseline demographic and clinical characteristics.* (Adapted
from table 1 of Yusuf et al209)
Telmisartan (N=2954)
Placebo (N=2972)
Age (years)
66.9 (7.3)
66.9 (7.4)
Sex (female)
1280 (43.3%)
1267 (42.6%)
Smoking status:
Current
293 (9.9%)
289 (9.7%)
Past
1273 (43.1%)
1283 (43.2%)
Ethnic origin:
Asian
637 (21.6%)
624 (21.0%)
Arab
37 (1.3%)
40 (1.3%)
African
51 (1.7%)
55 (1.9%)
European
1801 (61.0%)
1820 (61.2%)
Native or Aboriginal
390 (13.2%)
393 (13.2%)
Other
38 (1.3%)
40 (1.3%)
Blood pressure (mm Hg)
140.7 (16.8/81.8) (10.1)
141.3 (16.4/82.0) (10.2)
Heart rate (beats per min)
68.8 (11.5)
68.8 (12.1)
Cholesterol (mmol/l):
Total
5.09 (1.18)
5.08 (1.15)
LDL
3.02 (1.01)
3.03 (1.02)
HDL
1.27 (0.37)
1.28 (0.41)
Coronary artery disease
2211 (74.8%)
2207 (74.3%)
Myocardial infarction
1381 (46.8%)
1360 (45.8%)
Angina pectoris
1412 (47.8%)
1412 (47.5%)
Peripheral artery disease
349 (11.8%)
323 (10.9%)
Hypertension
2259 (76.5%)
2269 (76.3%)
Diabetes
1059 (35.8%)
1059 (35.6%)
*Data are means (SD) or numbers (%).
Explanation—Although the eligibility criteria (see item 4a) indicate who was eligible
for the trial, it is also important to know the characteristics of the participants
who were actually included. This information allows readers, especially clinicians,
to judge how relevant the results of a trial might be to an individual patient.
Randomised trials aim to compare groups of participants that differ only with respect
to the intervention (treatment). Although proper random assignment prevents selection
bias, it does not guarantee that the groups are equivalent at baseline. Any differences
in baseline characteristics are, however, the result of chance rather than bias.32
The study groups should be compared at baseline for important demographic and clinical
characteristics so that readers can assess how similar they were. Baseline data are
especially valuable for outcomes that can also be measured at the start of the trial
(such as blood pressure).
Baseline information is most efficiently presented in a table (see table 4). For continuous
variables, such as weight or blood pressure, the variability of the data should be
reported, along with average values. Continuous variables can be summarised for each
group by the mean and standard deviation. When continuous data have an asymmetrical
distribution, a preferable approach may be to quote the median and a centile range
(such as the 25th and 75th centiles).177 Standard errors and confidence intervals
are not appropriate for describing variability—they are inferential rather than descriptive
statistics. Variables with a small number of ordered categories (such as stages of
disease I to IV) should not be treated as continuous variables; instead, numbers and
proportions should be reported for each category.48 177
Unfortunately significance tests of baseline differences are still common23 32 210;
they were reported in half of 50 RCTs trials published in leading general journals
in 1997.183 Such significance tests assess the probability that observed baseline
differences could have occurred by chance; however, we already know that any differences
are caused by chance. Tests of baseline differences are not necessarily wrong, just
illogical.211 Such hypothesis testing is superfluous and can mislead investigators
and their readers. Rather, comparisons at baseline should be based on consideration
of the prognostic strength of the variables measured and the size of any chance imbalances
that have occurred.211
Item 16. For each group, number of participants (denominator) included in each analysis
and whether the analysis was by original assigned groups
Examples—“The primary analysis was intention-to-treat and involved all patients who
were randomly assigned.”212
“One patient in the alendronate group was lost to follow up; thus data from 31 patients
were available for the intention-to-treat analysis. Five patients were considered
protocol violators … consequently 26 patients remained for the per-protocol analyses.”213
Explanation—The number of participants in each group is an essential element of the
analyses. Although the flow diagram (see item 13a) may indicate the numbers of participants
analysed, these numbers often vary for different outcome measures. The number of participants
per group should be given for all analyses. For binary outcomes, (such as risk ratio
and risk difference) the denominators or event rates should also be reported. Expressing
results as fractions also aids the reader in assessing whether some of the randomly
assigned participants were excluded from the analysis. It follows that results should
not be presented solely as summary measures, such as relative risks.
Participants may sometimes not receive the full intervention, or some ineligible patients
may have been randomly allocated in error. One widely recommended way to handle such
issues is to analyse all participants according to their original group assignment,
regardless of what subsequently occurred (see box 6). This “intention-to-treat” strategy
is not always straightforward to implement. It is common for some patients not to
complete a study—they may drop out or be withdrawn from active treatment—and thus
are not assessed at the end. If the outcome is mortality, such patients may be included
in the analysis based on register information, whereas imputation techniques may need
to be used if other outcome data are missing. The term “intention-to-treat analysis”
is often inappropriately used—for example, when those who did not receive the first
dose of a trial drug are excluded from the analyses.18
Conversely, analysis can be restricted to only participants who fulfil the protocol
in terms of eligibility, interventions, and outcome assessment. This analysis is known
as an “on-treatment” or “per protocol” analysis. Excluding participants from the analysis
can lead to erroneous conclusions. For example, in a trial that compared medical with
surgical therapy for carotid stenosis, analysis limited to participants who were available
for follow-up showed that surgery reduced the risk for transient ischaemic attack,
stroke, and death. However, intention-to-treat analysis based on all participants
as originally assigned did not show a superior effect of surgery.214
Intention-to-treat analysis is generally favoured because it avoids bias associated
with non-random loss of participants.215 216 217 Regardless of whether authors use
the term “intention-to-treat,” they should make clear which and how many participants
are included in each analysis (see item 13). Non-compliance with assigned therapy
may mean that the intention-to-treat analysis underestimates the potential benefit
of the treatment, and additional analyses, such as a per protocol analysis, may therefore
be considered.218 219 It should be noted, however, that such analyses are often considerably
flawed.220
In a review of 403 RCTs published in 10 leading medical journals in 2002, 249 (62%)
reported the use of intention-to-treat analysis for their primary analysis. This proportion
was higher for journals adhering to the CONSORT statement (70% v 48%). Among articles
that reported the use of intention-to-treat analysis, only 39% actually analysed all
participants as randomised, with more than 60% of articles having missing data in
their primary analysis.221 Other studies show similar findings.18 222 223 Trials with
no reported exclusions are methodologically weaker in other respects than those that
report on some excluded participants,173 strongly indicating that at least some researchers
who have excluded participants do not report it. Another study found that reporting
an intention-to-treat analysis was associated with other aspects of good study design
and reporting, such as describing a sample size calculation.224
Box 6: Intention-to-treat analysis
The special strength of the RCT is the avoidance of bias when allocating interventions
to trial participants (see box 1). That strength allows strong inferences about cause
and effect that are not justified with other study designs. In order to preserve fully
the huge benefit of randomisation we should include all randomised participants in
the analysis, all retained in the group to which they were allocated. Those two conditions
define an “intention-to-treat” analysis, which is widely recommended as the preferred
analysis strategy.18 223 Intention-to-treat analysis corresponds to analysing the
groups exactly as randomised. Strict intention-to-treat analysis is often hard to
achieve for two main reasons—missing outcomes for some participants and non-adherence
to the trial protocol.
Missing outcomes
Many trialists exclude patients without an observed outcome. Often this is reasonable,
but once any randomised participants are excluded the analysis is not strictly an
intention-to-treat analysis. Indeed, most randomised trials have some missing observations.
Trialists effectively must choose between omitting the participants without final
outcome data or imputing their missing outcome data.225 A “complete case” (or “available
case”) analysis includes only those whose outcome is known. While a few missing outcomes
will not cause a problem, in half of trials more than 10% of randomised patients may
have missing outcomes.226 This common approach will lose power by reducing the sample
size, and bias may well be introduced if being lost to follow-up is related to a patient’s
response to treatment. There should be concern when the frequency or the causes of
dropping out differ between the intervention groups.
Participants with missing outcomes can be included in the analysis only if their outcomes
are imputed (that is, their outcomes are estimated from other information that was
collected). Imputation of the missing data allows the analysis to conform to intention-to-treat
analysis but requires strong assumptions, which may be hard to justify.227 Simple
imputation methods are appealing, but their use may be inadvisable. In particular,
a widely used method is “last observation carried forward” in which missing final
values of the outcome variable are replaced by the last known value before the participant
was lost to follow up. This is appealing through its simplicity, but the method may
introduce bias,228 and no allowance is made for the uncertainty of imputation.229
Many authors have severely criticised last observation carried forward.229 230 231
Non-adherence to the protocol
A separate issue is that the trial protocol may not have been followed fully for some
trial participants. Common examples are participants who did not meet the inclusion
criteria (such as wrong diagnosis, too young), received a proscribed co-intervention,
did not take all the intended treatment, or received a different treatment or no intervention.
The simple way to deal with any protocol deviations is to ignore them: all participants
can be included in the analysis regardless of adherence to the protocol, and this
is the intention-to-treat approach. Thus, exclusion of any participants for such reasons
is incompatible with intention-to-treat analysis.
The term “modified intention-to-treat” is quite widely used to describe an analysis
that excludes participants who did not adequately adhere to the protocol, in particular
those who did not receive a defined minimum amount of the intervention.232 An alternative
term is “per protocol.” Though a per protocol analysis may be appropriate in some
settings, it should be properly labelled as a non-randomised, observational comparison.
Any exclusion of patients from the analysis compromises the randomisation and may
lead to bias in the results.
Like “intention-to-treat,” none of these other labels reliably clarifies exactly which
patients were included. Thus, in the CONSORT checklist we have dropped the specific
request for intention-to-treat analysis in favour of a clear description of exactly
who was included in each analysis.
Item 17a. For each primary and secondary outcome, results for each group, and the
estimated effect size and its precision (such as 95% confidence interval)
Examples—See tables 5 and 6.
Table 5
Example of reporting of summary results for each study group (binary outcomes).*
(Adapted from table 2 of Mease et al103)
Endpoint
Number (%)
Risk difference (95% CI)
Etanercept (n=30)
Placebo (n=30)
Primary endpoint
Achieved PsARC at 12 weeks
26 (87)
7 (23)
63% (44 to 83)
Secondary endpoint
Proportion of patients meeting ACR criteria:
ACR20
22 (73)
4 (13)
60% (40 to 80)
ACR50
15 (50)
1 (3)
47% (28 to 66)
ACR70
4 (13)
0 (0)
13% (1 to 26)
*See also example for item 6a.
PsARC=psoriatic arthritis response criteria. ACR=American College of Rheumatology.
Table 6
Example of reporting of summary results for each study group (continuous outcomes).
(Adapted from table 3 of van Linschoten234)
Exercise therapy (n=65)
Control (n=66)
Adjusted difference* (95% CI) at 12 months
Baseline (mean (SD))
12 months (mean (SD))
Baseline (mean (SD))
12 months (mean (SD))
Function score (0-100)
64.4 (13.9)
83.2 (14.8)
65.9 (15.2)
79.8 (17.5)
4.52 (−0.73 to 9.76)
Pain at rest (0-100)
4.14 (2.3)
1.43 (2.2)
4.03 (2.3)
2.61 (2.9)
−1.29 (−2.16 to −0.42)
Pain on activity (0-100)
6.32 (2.2)
2.57 (2.9)
5.97 (2.3)
3.54 (3.38)
−1.19 (−2.22 to −0.16)
*Function score adjusted for baseline, age, and duration of symptoms.
Explanation—For each outcome, study results should be reported as a summary of the
outcome in each group (for example, the number of participants with or without the
event and the denominators, or the mean and standard deviation of measurements), together
with the contrast between the groups, known as the effect size. For binary outcomes,
the effect size could be the risk ratio (relative risk), odds ratio, or risk difference;
for survival time data, it could be the hazard ratio or difference in median survival
time; and for continuous data, it is usually the difference in means. Confidence intervals
should be presented for the contrast between groups. A common error is the presentation
of separate confidence intervals for the outcome in each group rather than for the
treatment effect.233 Trial results are often more clearly displayed in a table rather
than in the text, as shown in tables 5 and 6.
For all outcomes, authors should provide a confidence interval to indicate the precision
(uncertainty) of the estimate.48 235 A 95% confidence interval is conventional, but
occasionally other levels are used. Many journals require or strongly encourage the
use of confidence intervals.236 They are especially valuable in relation to differences
that do not meet conventional statistical significance, for which they often indicate
that the result does not rule out an important clinical difference. The use of confidence
intervals has increased markedly in recent years, although not in all medical specialties.233
Although P values may be provided in addition to confidence intervals, results should
not be reported solely as P values.237 238 Results should be reported for all planned
primary and secondary end points, not just for analyses that were statistically significant
or “interesting.” Selective reporting within a study is a widespread and serious problem.55
57 In trials in which interim analyses were performed, interpretation should focus
on the final results at the close of the trial, not the interim results.239
For both binary and survival time data, expressing the results also as the number
needed to treat for benefit or harm can be helpful (see item 21).240 241
Item 17b. For binary outcomes, presentation of both absolute and relative effect sizes
is recommended
Example—“The risk of oxygen dependence or death was reduced by 16% (95% CI 25% to
7%). The absolute difference was −6.3% (95% CI −9.9% to −2.7%); early administration
to an estimated 16 babies would therefore prevent 1 baby dying or being long-term
dependent on oxygen” (also see table 7).242
Table 7
Example of reporting both absolute and relative effect sizes. (Adapted from table
3 of The OSIRIS Collaborative Group242)
Primary outcome
Percentage (No)
Risk ratio (95% CI)
Risk difference (95% CI)
Early administration (n=1344)
Delayed selective administration (n=1346)
Death or oxygen dependence at “expected date of delivery”
31.9 (429)
38.2 (514)
0.84 (0.75 to 0.93)
−6.3 (−9.9 to −2.7)
Explanation—When the primary outcome is binary, both the relative effect (risk ratio
(relative risk) or odds ratio) and the absolute effect (risk difference) should be
reported (with confidence intervals), as neither the relative measure nor the absolute
measure alone gives a complete picture of the effect and its implications. Different
audiences may prefer either relative or absolute risk, but both doctors and lay people
tend to overestimate the effect when it is presented in terms of relative risk.243
244 245 The size of the risk difference is less generalisable to other populations
than the relative risk since it depends on the baseline risk in the unexposed group,
which tends to vary across populations. For diseases where the outcome is common,
a relative risk near unity might indicate clinically important differences in public
health terms. In contrast, a large relative risk when the outcome is rare may not
be so important for public health (although it may be important to an individual in
a high risk category).
Item 18. Results of any other analyses performed, including subgroup analyses and
adjusted analyses, distinguishing pre-specified from exploratory
Example—“On the basis of a study that suggested perioperative β-blocker efficacy might
vary across baseline risk, we prespecified our primary subgroup analysis on the basis
of the revised cardiac risk index scoring system. We also did prespecified secondary
subgroup analyses based on sex, type of surgery, and use of an epidural or spinal
anaesthetic. For all subgroup analyses, we used Cox proportional hazard models that
incorporated tests for interactions, designated to be significant at p<0.05 … Figure
3 shows the results of our prespecified subgroup analyses and indicates consistency
of effects … Our subgroup analyses were underpowered to detect the modest differences
in subgroup effects that one might expect to detect if there was a true subgroup effect.”100
Explanation—Multiple analyses of the same data create a risk for false positive findings.246
Authors should resist the temptation to perform many subgroup analyses.183 185 247
Analyses that were prespecified in the trial protocol (see item 24) are much more
reliable than those suggested by the data, and therefore authors should report which
analyses were prespecified. If subgroup analyses were undertaken, authors should report
which subgroups were examined, why, if they were prespecified, and how many were prespecified.
Selective reporting of subgroup analyses could lead to bias.248 When evaluating a
subgroup the question is not whether the subgroup shows a statistically significant
result but whether the subgroup treatment effects are significantly different from
each other. To determine this, a test of interaction is helpful, although the power
for such tests is typically low. If formal evaluations of interaction are undertaken
(see item 12b) they should be reported as the estimated difference in the intervention
effect in each subgroup (with a confidence interval), not just as P values.
In one survey, 35 of 50 trial reports included subgroup analyses, of which only 42%
used tests of interaction.183 It was often difficult to determine whether subgroup
analyses had been specified in the protocol. In another survey of surgical trials
published in high impact journals, 27 of 72 trials reported 54 subgroup analyses,
of which 91% were post hoc and only 6% of subgroup analyses used a test of interaction
to assess whether a subgroup effect existed.249
Similar recommendations apply to analyses in which adjustment was made for baseline
variables. If done, both unadjusted and adjusted analyses should be reported. Authors
should indicate whether adjusted analyses, including the choice of variables to adjust
for, were planned. Ideally, the trial protocol should state whether adjustment is
made for nominated baseline variables by using analysis of covariance.187 Adjustment
for variables because they differ significantly at baseline is likely to bias the
estimated treatment effect.187 A survey found that unacknowledged discrepancies between
protocols and publications were found for all 25 trials reporting subgroup analyses
and for 23 of 28 trials reporting adjusted analyses.92
Item 19. All important harms or unintended effects in each group
For specific guidance see CONSORT for harms.42
Example—“The proportion of patients experiencing any adverse event was similar between
the rBPI21 [recombinant bactericidal/permeability-increasing protein] and placebo
groups: 168 (88.4%) of 190 and 180 (88.7%) of 203, respectively, and it was lower
in patients treated with rBPI21 than in those treated with placebo for 11 of 12 body
systems … the proportion of patients experiencing a severe adverse event, as judged
by the investigators, was numerically lower in the rBPI21 group than the placebo group:
53 (27.9%) of 190 versus 74 (36.5%) of 203 patients, respectively. There were only
three serious adverse events reported as drug-related and they all occurred in the
placebo group.”250
Explanation—Readers need information about the harms as well as the benefits of interventions
to make rational and balanced decisions. The existence and nature of adverse effects
can have a major impact on whether a particular intervention will be deemed acceptable
and useful. Not all reported adverse events observed during a trial are necessarily
a consequence of the intervention; some may be a consequence of the condition being
treated. Randomised trials offer the best approach for providing safety data as well
as efficacy data, although they cannot detect rare harms.
Many reports of RCTs provide inadequate information on adverse events. A survey of
192 drug trials published from 1967 to 1999 showed that only 39% had adequate reporting
of clinical adverse events and 29% had adequate reporting of laboratory defined toxicity.72
More recently, a comparison between the adverse event data submitted to the trials
database of the National Cancer Institute, which sponsored the trials, and the information
reported in journal articles found that low grade adverse events were underreported
in journal articles. High grade events (Common Toxicity Criteria grades 3 to 5) were
reported inconsistently in the articles, and the information regarding attribution
to investigational drugs was incomplete.251 Moreover, a review of trials published
in six general medical journals in 2006 to 2007 found that, although 89% of 133 reports
mentioned adverse events, no information on severe adverse events and withdrawal of
patients due to an adverse event was given on 27% and 48% of articles, respectively.252
An extension of the CONSORT statement has been developed to provide detailed recommendations
on the reporting of harms in randomised trials.42 Recommendations and examples of
appropriate reporting are freely available from the CONSORT website (www.consort-statement.org).
They complement the CONSORT 2010 Statement and should be consulted, particularly if
the study of harms was a key objective. Briefly, if data on adverse events were collected,
events should be listed and defined, with reference to standardised criteria where
appropriate. The methods used for data collection and attribution of events should
be described. For each study arm the absolute risk of each adverse event, using appropriate
metrics for recurrent events, and the number of participants withdrawn due to harms
should be presented. Finally, authors should provide a balanced discussion of benefits
and harms.42
Discussion
Item 20. Trial limitations, addressing sources of potential bias, imprecision, and,
if relevant, multiplicity of analyses
Example—“The preponderance of male patients (85%) is a limitation of our study … We
used bare-metal stents, since drug-eluting stents were not available until late during
accrual. Although the latter factor may be perceived as a limitation, published data
indicate no benefit (either short-term or long-term) with respect to death and myocardial
infarction in patients with stable coronary artery disease who receive drug-eluting
stents, as compared with those who receive bare-metal stents.”253
Explanation—The discussion sections of scientific reports are often filled with rhetoric
supporting the authors’ findings254 and provide little measured argument of the pros
and cons of the study and its results. Some journals have attempted to remedy this
problem by encouraging more structure to authors’ discussion of their results.255
256 For example, Annals of Internal Medicine recommends that authors structure the
discussion section by presenting (1) a brief synopsis of the key findings, (2) consideration
of possible mechanisms and explanations, (3) comparison with relevant findings from
other published studies (whenever possible including a systematic review combining
the results of the current study with the results of all previous relevant studies),
(4) limitations of the present study (and methods used to minimise and compensate
for those limitations), and (5) a brief section that summarises the clinical and research
implications of the work, as appropriate.255 We recommend that authors follow these
sensible suggestions, perhaps also using suitable subheadings in the discussion section.
Although discussion of limitations is frequently omitted from research reports,257
identification and discussion of the weaknesses of a study have particular importance.258
For example, a surgical group reported that laparoscopic cholecystectomy, a technically
difficult procedure, had significantly lower rates of complications than the more
traditional open cholecystectomy for management of acute cholecystitis.259 However,
the authors failed to discuss an obvious bias in their results. The study investigators
had completed all the laparoscopic cholecystectomies, whereas 80% of the open cholecystectomies
had been completed by trainees.
Authors should also discuss any imprecision of the results. Imprecision may arise
in connection with several aspects of a study, including measurement of a primary
outcome (see item 6a) or diagnosis (see item 4a). Perhaps the scale used was validated
on an adult population but used in a paediatric one, or the assessor was not trained
in how to administer the instrument.
The difference between statistical significance and clinical importance should always
be borne in mind. Authors should particularly avoid the common error of interpreting
a non-significant result as indicating equivalence of interventions. The confidence
interval (see item 17a) provides valuable insight into whether the trial result is
compatible with a clinically important effect, regardless of the P value.120
Authors should exercise special care when evaluating the results of trials with multiple
comparisons. Such multiplicity arises from several interventions, outcome measures,
time points, subgroup analyses, and other factors. In such circumstances, some statistically
significant findings are likely to result from chance alone.
Item 21. Generalisability (external validity, applicability) of the trial findings
Examples—“As the intervention was implemented for both sexes, all ages, all types
of sports, and at different levels of sports, the results indicate that the entire
range of athletes, from young elite to intermediate and recreational senior athletes,
would benefit from using the presented training programme for the prevention of recurrences
of ankle sprain. By including non-medically treated and medically treated athletes,
we covered a broad spectrum of injury severity. This suggests that the present training
programme can be implemented in the treatment of all athletes. Furthermore, as it
is reasonable to assume that ankle sprains not related to sports are comparable with
those in sports, the programme could benefit the general population.”260
“This replicates and extends the work of Clarke and colleagues and demonstrates that
this CB (cognitive behavioural) prevention program can be reliably and effectively
delivered in different settings by clinicians outside of the group who originally
developed the intervention. The effect size was consistent with those of previously
reported, single-site, indicated depression prevention studies and was robust across
sites with respect to both depressive disorders and symptoms … In this generalisability
trial, we chose a comparison condition that is relevant to public health—usual care
… The sample also was predominantly working class to middle class with access to health
insurance. Given evidence that CB therapy can be more efficacious for adolescents
from homes with higher incomes, it will be important to test the effects of this prevention
program with more economically and ethnically diverse samples.”261
Explanation—External validity, also called generalisability or applicability, is the
extent to which the results of a study can be generalised to other circumstances.262
Internal validity, the extent to which the design and conduct of the trial eliminate
the possibility of bias, is a prerequisite for external validity: the results of a
flawed trial are invalid and the question of its external validity becomes irrelevant.
There is no absolute external validity; the term is meaningful only with regard to
clearly specified conditions that were not directly examined in the trial. Can results
be generalised to an individual participant or groups that differ from those enrolled
in the trial with regard to age, sex, severity of disease, and comorbid conditions?
Are the results applicable to other drugs within a class of similar drugs, to a different
dose, timing, and route of administration, and to different concomitant therapies?
Can similar results be expected at the primary, secondary, and tertiary levels of
care? What about the effect on related outcomes that were not assessed in the trial,
and the importance of length of follow-up and duration of treatment, especially with
respect to harms?263
External validity is a matter of judgment and depends on the characteristics of the
participants included in the trial, the trial setting, the treatment regimens tested,
and the outcomes assessed.5 136 It is therefore crucial that adequate information
be described about eligibility criteria and the setting and location (see item 4b),
the interventions and how they were administered (see item 5), the definition of outcomes
(see item 6), and the period of recruitment and follow-up (see item 14). The proportion
of control group participants in whom the outcome develops (control group risk) is
also important. The proportion of eligible participants who refuse to enter the trial
as indicated on the flowchart (see item 13) is relevant for the generalisability of
the trial, as it may indicate preferences for or acceptability of an intervention.
Similar considerations may apply to clinician preferences.264 265
Several issues are important when results of a trial are applied to an individual
patient.266 267 268 Although some variation in treatment response between an individual
patient and the patients in a trial or systematic review is to be expected, the differences
tend to be in magnitude rather than direction.
Although there are important exceptions,268 therapies (especially drugs 269) found
to be beneficial in a narrow range of patients generally have broader application
in actual practice. Frameworks for the evaluation of external validity have been proposed,
including qualitative studies, such as in integral “process evaluations”270 and checklists.271
Measures that incorporate baseline risk when calculating therapeutic effects, such
as the number needed to treat to obtain one additional favourable outcome and the
number needed to treat to produce one adverse effect, are helpful in assessing the
benefit-to-risk balance in an individual patient or group with characteristics that
differ from the typical trial participant.268 272 273 Finally, after deriving patient
centred estimates for the potential benefit and harm from an intervention, the clinician
must integrate them with the patient’s values and preferences for therapy. Similar
considerations apply when assessing the generalisability of results to different settings
and interventions.
Item 22. Interpretation consistent with results, balancing benefits and harms, and
considering other relevant evidence
Example—“Studies published before 1990 suggested that prophylactic immunotherapy also
reduced nosocomial infections in very-low-birth-weight infants. However, these studies
enrolled small numbers of patients; employed varied designs, preparations, and doses;
and included diverse study populations. In this large multicenter, randomised controlled
trial, the repeated prophylactic administration of intravenous immune globulin failed
to reduce the incidence of nosocomial infections significantly in premature infants
weighing 501 to 1500 g at birth.”274
Explanation—Readers will want to know how the present trial’s results relate to those
of other RCTs. This can best be achieved by including a formal systematic review in
the results or discussion section of the report.83 275 276 277 Such synthesis may
be impractical for trial authors, but it is often possible to quote a systematic review
of similar trials. A systematic review may help readers assess whether the results
of the RCT are similar to those of other trials in the same topic area and whether
participants are similar across studies. Reports of RCTs have often not dealt adequately
with these points.277 Bayesian methods can be used to statistically combine the trial
data with previous evidence.278
We recommend that, at a minimum, the discussion should be as systematic as possible
and be based on a comprehensive search, rather than being limited to studies that
support the results of the current trial.279
Other information
Item 23. Registration number and name of trial registry
Example—“The trial is registered at ClinicalTrials.gov, number NCT00244842.”280
Explanation—The consequences of non-publication of entire trials,281 282 selective
reporting of outcomes within trials, and of per protocol rather than intention-to-treat
analysis have been well documented.55 56 283 Covert redundant publication of clinical
trials can also cause problems, particularly for authors of systematic reviews when
results from the same trial are inadvertently included more than once.284
To minimise or avoid these problems there have been repeated calls over the past 25
years to register clinical trials at their inception, to assign unique trial identification
numbers, and to record other basic information about the trial so that essential details
are made publicly available.285 286 287 288 Provoked by recent serious problems of
withholding data,289 there has been a renewed effort to register randomised trials.
Indeed, the World Health Organisation states that “the registration of all interventional
trials is a scientific, ethical and moral responsibility” (www.who.int/ictrp/en).
By registering a randomised trial, authors typically report a minimal set of information
and obtain a unique trial registration number.
In September 2004 the International Committee of Medical Journal Editors (ICMJE) changed
their policy, saying that they would consider trials for publication only if they
had been registered before the enrolment of the first participant.290 This resulted
in a dramatic increase in the number of trials being registered.291 The ICMJE gives
guidance on acceptable registries (www.icmje.org/faq.pdf).
In a recent survey of 165 high impact factor medical journals’ instructions to authors,
44 journals specifically stated that all recent clinical trials must be registered
as a requirement of submission to that journal.292
Authors should provide the name of the register and the trial’s unique registration
number. If authors had not registered their trial they should explicitly state this
and give the reason.
Item 24. Where the full trial protocol can be accessed, if available
Example—“Full details of the trial protocol can be found in the Supplementary Appendix,
available with the full text of this article at www.nejm.org.”293
Explanation—A protocol for the complete trial (rather than a protocol of a specific
procedure within a trial) is important because it pre-specifies the methods of the
randomised trial, such as the primary outcome (see item 6a). Having a protocol can
help to restrict the likelihood of undeclared post hoc changes to the trial methods
and selective outcome reporting (see item 6b). Elements that may be important for
inclusion in the protocol for a randomised trial are described elsewhere.294
There are several options for authors to consider ensuring their trial protocol is
accessible to interested readers. As described in the example above, journals reporting
a trial’s primary results can make the trial protocol available on their web site.
Accessibility to the trial results and protocol is enhanced when the journal is open
access. Some journals (such as Trials) publish trial protocols, and such a publication
can be referenced when reporting the trial’s principal results. Trial registration
(see item 23) will also ensure that many trial protocol details are available, as
the minimum trial characteristics included in an approved trial registration database
includes several protocol items and results (www.who.int/ictrp/en). Trial investigators
may also be able to post their trial protocol on a website through their employer.
Whatever mechanism is used, we encourage all trial investigators to make their protocol
easily accessible to interested readers.
Item 25. Sources of funding and other support (such as supply of drugs), role of funders
Examples—“Grant support was received for the intervention from Plan International
and for the research from the Wellcome Trust and Joint United Nations Programme on
HIV/AIDS (UNAIDS). The funders had no role in study design, data collection and analysis,
decision to publish, or preparation of the manuscript.”295
“This study was funded by GlaxoSmithKline Pharmaceuticals. GlaxoSmithKline was involved
in the design and conduct of the study and provided logistical support during the
trial. Employees of the sponsor worked with the investigators to prepare the statistical
analysis plan, but the analyses were performed by the University of Utah. The manuscript
was prepared by Dr Shaddy and the steering committee members. GlaxoSmithKline was
permitted to review the manuscript and suggest changes, but the final decision on
content was exclusively retained by the authors.”296
Explanation—Authors should report the sources of funding for the trial, as this is
important information for readers assessing a trial. Studies have showed that research
sponsored by the pharmaceutical industry are more likely to produce results favouring
the product made by the company sponsoring the research than studies funded by other
sources.297 298 299 300 A systematic review of 30 studies on funding found that research
funded by the pharmaceutical industry had four times the odds of having outcomes favouring
the sponsor than research funded by other sources (odds ratio 4.05, 95% confidence
interval 2.98 to 5.51).297 A large proportion of trial publications do not currently
report sources of funding. The degree of underreporting is difficult to quantify.
A survey of 370 drug trials found that 29% failed to report sources of funding.301
In another survey, of PubMed indexed randomised trials published in December 2000,
source of funding was reported for 66% of the 519 trials.16
The level of involvement by a funder and their influence on the design, conduct, analysis,
and reporting of a trial varies. It is therefore important that authors describe in
detail the role of the funders. If the funder had no such involvement, the authors
should state so. Similarly, authors should report any other sources of support, such
as supply and preparation of drugs or equipment, or in the analysis of data and writing
of the manuscript.302
Reporting RCTs that did not have a two group parallel design
The primary focus of the CONSORT recommendations is RCTs with a parallel design and
two treatment groups. Most RCTs have that design, but a substantial minority do not:
45% (233/519) of RCTs published in December 2000,16 and 39% (242/616) in December
2006.17
Most of the CONSORT statement applies equally to all trial designs, but there are
a few additional issues to address for each design. Before the publication of the
revised CONSORT statement in 2001, the CONSORT Group decided to develop extensions
to the main CONSORT statement relevant to specific trial designs. Extensions have
been published relating to reporting of cluster randomised trials40 and non-inferiority
and equivalence trials.39 Lack of resources has meant that other planned extensions
have not been completed; they will cover trials with the following designs: multiarm
parallel, factorial, crossover, within-person.
Authors reporting trials with a cluster design or using a non-inferiority or equivalence
framework should consult the CONSORT recommendations in addition to those in this
document. Here we make a few interim comments about the other designs. In each case,
the trial design should be made clear in both the main text and the article’s abstract.
Multiarm (>2 group) parallel group trials need the least modification of the standard
CONSORT guidance. The flow diagram can be extended easily. The main differences from
trials with two groups relate to clarification of how the study hypotheses relate
to the multiple groups, and the consequent methods of data analysis and interpretation.
For factorial trials, the possibility of interaction between the interventions generally
needs to be considered. In addition to overall comparisons of participants who did
or did not receive each intervention under study, investigators should consider also
reporting results for each treatment combination.303
In crossover trials, each participant receives two (or more) treatments in a random
order. The main additional issues to address relate to the paired nature of the data,
which affect design and analysis.304 Similar issues affect within-person comparisons,
in which participants receive two treatments simultaneously (often to paired organs).
Also, because of the risk of temporal or systemic carryover effects, respectively,
in both cases the choice of design needs justification.
The CONSORT Group intends to publish extensions to CONSORT to cover all these designs.
In addition, we will publish updates to existing guidance for cluster randomised trials
and non-inferiority and equivalence trials to take account of this major update of
the generic CONSORT guidance.
Discussion
Assessment of healthcare interventions can be misleading unless investigators ensure
unbiased comparisons. Random allocation to study groups remains the only method that
eliminates selection and confounding biases. Non-randomised trials tend to result
in larger estimated treatment effects than randomised trials.305 306
Bias jeopardises even RCTs, however, if investigators carry out such trials improperly.307
A recent systematic review, aggregating the results of several methodological investigations,
found that, for subjective outcomes, trials that used inadequate or unclear allocation
concealment yielded 31% larger estimates of effect than those that used adequate concealment,
and trials that were not blinded yielded 25% larger estimates.153 As might be expected,
there was a strong association between the two.
The design and implementation of an RCT require methodological as well as clinical
expertise, meticulous effort,143 308 and a high level of alertness for unanticipated
difficulties. Reports of RCTs should be written with similarly close attention to
reducing bias. Readers should not have to speculate; the methods used should be complete
and transparent so that readers can readily differentiate trials with unbiased results
from those with questionable results. Sound science encompasses adequate reporting,
and the conduct of ethical trials rests on the footing of sound science.309
We hope this update of the CONSORT explanatory article will assist authors in using
the 2010 version of CONSORT and explain in general terms the importance of adequately
reporting of trials. The CONSORT statement can help researchers designing trials in
future310 and can guide peer reviewers and editors in their evaluation of manuscripts.
Indeed, we encourage peer reviewers and editors to use the CONSORT checklist to assess
whether authors have reported on these items. Such assessments will likely improve
the clarity and transparency of published trials. Because CONSORT is an evolving document,
it requires a dynamic process of continual assessment, refinement, and, if necessary,
change, which is why we have this update of the checklist and explanatory article.
As new evidence and critical comments accumulate, we will evaluate the need for future
updates.
The first version of the CONSORT statement, from 1996, seems to have led to improvement
in the quality of reporting of RCTs in the journals that have adopted it.50 51 52
53 54. Other groups are using the CONSORT template to improve the reporting of other
research designs, such as diagnostic tests311 and observational studies.312
The CONSORT website (www.consort-statement.org) has been established to provide educational
material and a repository database of materials relevant to the reporting of RCTs.
The site includes many examples from real trials, including all of the examples included
in this article. We will continue to add good and bad examples of reporting to the
database, and we invite readers to submit further suggestions by contacting us through
the website. The CONSORT Group will continue to survey the literature to find relevant
articles that address issues relevant to the reporting of RCTs, and we invite authors
of any such articles to notify us about them. All of this information will be made
accessible through the CONSORT website, which is updated regularly.
More than 400 leading general and specialty journals and biomedical editorial groups,
including the ICMJE, World Association of Medical Journal Editors, and the Council
of Science Editors, have given their official support to CONSORT. We invite other
journals concerned about the quality of reporting of clinical trials to endorse the
CONSORT statement and contact us through our website to let us know of their support.
The ultimate benefactors of these collective efforts should be people who, for whatever
reason, require intervention from the healthcare community.
Related collections
Most cited references234
- Record: found
- Abstract: found
- Article: found
Rapid planetesimal formation in turbulent circumstellar discs

- Record: found
- Abstract: found
- Article: found
Long Term Outcomes Following Hospital Admission for Sepsis Using Relative Survival Analysis: A Prospective Cohort Study of 1,092 Patients with 5 Year Follow Up
Joshua Davis, Vincent He, Nicholas Anstey … (2014)
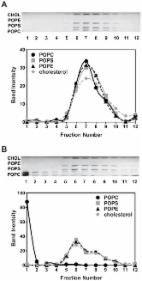
- Record: found
- Abstract: found
- Article: found
Preparation of Artificial Plasma Membrane Mimicking Vesicles with Lipid Asymmetry
Qingqing Lin, Erwin London (2014)