
Introduction
In temperate grass-based ruminant production systems such as those in Ireland, grass silage is the primary forage available for livestock during the winter period when weather conditions can make grazing unfeasible. Ideally, for satisfactory preservation as silage, a crop should have an adequate supply of fermentable substrate in the form of water-soluble carbohydrates (WSC) and a relatively low buffering capacity. When WSC is expressed on an aqueous phase basis (WSCaq), then increasing herbage DM content, by means of field wilting, for example, also improves ensilability (Buxton & O’Kiely, 2003).
Perennial ryegrass (Lolium perenne L.) is the most commonly sown grass species in temperate regions due to its versatility in both conservation and/or grazing management regimes, exhibiting good yield and silage preservation potential as well as high digestibility and persistence (Frame & Laidlaw, 2011). However, other grass species such as Italian ryegrass (Lolium multiflorum L.) are better suited to silage production due to a greater WSC content (Burns et al., 2015), while timothy (Phleum pratense L.) is preferred in colder regions due to its cold hardy nature (Bélanger et al., 2001).
The satisfactory preservation of legume species such as red (Trifolium pratense L.) and white (Trifolium repens L.) clover can be difficult due to their characteristically low WSC and high buffering capacity (Buxton & O’Kiely, 2003). However, despite their apparently poor ensilability characteristics, legume monocultures and grass–legume binary swards can undergo satisfactory lactic acid-dominant fermentation (Dewhurst et al., 2003; King et al., 2012a; Copani et al., 2014). Red clover is used mainly in swards managed to produce conserved fodder and is typically grown with a companion grass species such as perennial ryegrass. The primary function of the companion grass is to increase herbage DM yield, but it can also improve the overall ensilability (Clavin et al., 2017). White clover has an important role in grassland swards for grazing (Phelan et al., 2015), and its shallow rooting nature has made it a particularly successful partner for perennial ryegrass (Black et al., 2009).
Alternative forage herbs such as chicory (Cichorium intybus L.) and ribwort plantain (Plantago lanceolata L.) can contribute to improved herbage yields and nutritive value (Sanderson et al., 2003; Deak et al., 2007; Pirhofer-Walzl et al., 2011), but little research has been reported on the preservation of these species as silage either in monoculture or in mixtures with grasses and/or legumes. However, the relatively high WSC content reported for chicory by Barry (1998), for example, is encouraging.
Sown multi-species grassland swards can transgressively overyield due to temporal and spatial complementarity among the sown species and also to interspecific facilitation such as the transfer of symbiotically fixed N from legumes to neighbouring species (Nyfeler et al., 2009; Finn et al., 2013; Lüscher et al., 2014). Although sward botanical composition can influence herbage chemical composition (Sanderson, 2010) the nutritive value of multi-species swards can differ from what would be expected based on the chemical composition of the component species grown in monoculture (Moloney et al. 2020a; Ergon et al., 2017). This, in turn, raises the possibility that indices of ensilability and ultimately conservation efficiency may also differ from what might be predicted from values obtained for the constituent species grown in monoculture.
The current paper follows two earlier studies which examined the yield and botanical composition (Moloney et al., 2020b) and the nutritive value (Moloney et al. 2020a) of binary and multi-species mixtures compared with a number of temperate grassland species monocultures managed under a four-cut annual silage production regime where the response of multi-species mixtures to inorganic nitrogen (N) was also determined.
The objectives of the current study were to quantify the effects on herbage ensilability and silage nutritive value, fermentation characteristics and conservation losses of (1) three common temperate grass monocultures receiving inorganic N or grown in binary mixture with red clover, and a red clover monoculture, (2) a perennial ryegrass monoculture receiving 360 kg N/ha per year compared with a perennial ryegrass/red clover binary mixture and two multi-species mixtures, each receiving no inorganic N fertiliser, (3) a perennial ryegrass monoculture and two multi-species mixtures each receiving 360 kg N/ha per year, and (4) two multi-species mixtures receiving either 0 or 360 kg N/ha per year. Herbage was ensiled without the assistance of either wilting or the application of additives so as to best assess the inherent ensilability of the various sward treatments.
Materials and methods
Field plots
Field plots (each 9 m × 2 m) were established at Teagasc Grange (53.52°N, 6.66°W), and details of soil characteristics, treatment establishment and general plot management have been described by Moloney et al. (2020b). The herbages used in this study were obtained from Year 1 of the (Moloney et al., 2020b) study which corresponds to the second year after sowing. Eleven treatments (Table 1) from each of four replicate blocks were used in this experiment and constituted a randomised complete block design. A single representative sample of harvested herbage was collected from each treatment plot and thus both the experimental unit and replication were at the field plot level. Five monoculture or multi-species mixtures were grown using 360 kg of inorganic fertiliser N/ha per year, and these were Italian ryegrass (IRG/360N), perennial ryegrass (PRG/360N), timothy (TIM/360N), Mix 1 (perennial ryegrass, timothy, red and white clovers; Mix 1/360N) and Mix 2 (perennial ryegrass, timothy, red clover, ribwort plantain and chicory; Mix 2/360N). A further five treatments comprised binary or multi-species mixtures grown without inorganic fertiliser N input. These were binary mixtures of Italian ryegrass (IRG/RC), perennial ryegrass (PRG/RC) and timothy (TIM/RC) with red clover, as well as Mix 1/0N and Mix 2/0N. The final treatment was a red clover monoculture grown without inorganic N input (RC). The species included in each herbage treatment were represented by an equal proportion of three cultivars (two for chicory and one for ribwort plantain). Details of the cultivars used and their seeding rates are presented in Tables 1 and 2. The annual production from each plot was harvested in four cuts (Cuts 1–4) taken on 27 May, 15 July, 2 September and 10 November, with the herbage harvested at Cuts 1–3 being used in this experiment. The inorganic N (calcium ammonium nitrate; 275 g N/kg) was applied at 120, 100, 80 and 60 kg N/ha in mid-March and immediately after Cuts 1–3, respectively. Individual samples of each species growing in Mix 1 and Mix 2 and receiving 120 kg N/ha per year were also taken and their chemical composition determined.
Sward types and the associated species included, rates of seed used, and rates of inorganic N applied
| Sward | Species included1 | Seed rate2 | N3 |
|---|---|---|---|
| TIM/360N | Timothy | 15 | 360 |
| IRG/360N | Italian ryegrass | 42 | 360 |
| PRG/0-360N | Perennial ryegrass | 32 | 0, 360 |
| RC | Red clover | 15 | 0 |
| TIM/RC | Timothy, red clover | 6, 9 | 0 |
| IRG/RC | Italian ryegrass, red clover | 16.8, 9 | 0 |
| PRG /RC | Perennial ryegrass, red clover | 12.8, 9 | 0 |
| Mix 1/0-360 | Timothy, perennial ryegrass, red clover, white clover | 3, 6.4, 5.25, 3 | 0, 360 |
| Mix 2/0-360 | Timothy, perennial ryegrass, red clover, ribwort plantain, chicory | 3, 6.4, 5.25, 1.5, 0.63 | 0, 360 |
1Perennial ryegrass in binary- or multi-species mixtures was always intermediate heading-date, diploid cultivars (as per PRG).
2kg seed/ha (values correspond in order with species in the preceding column).
3Inorganic fertiliser N input (kg N/ha per year).
Species and cultivars used
| Species | Cultivar1 |
|---|---|
| Timothy (Phleum pratense L.) (TIM) | Comer (9/6; H), Erecta (10/6; H), Promesse (10/6; H) |
| Italian ryegrass (Lolium multiflorum Lam.) (IRG) | Fabio (19/5; T), Nabucco (21/5; T), Davinci (23/5; D) |
| Perennial ryegrass (Lolium perenne L.) (PRG) | Premium (23/5; D), Shandon (21/5; D), Solomon (22/5; D) |
| Red clover (Trifolium pratense L.) (RC) | Aberruby (D), Amos (T), Merviot (D) (all early flowering) |
| White clover (Trifolium repens L.) | Aran (very large leaf), Barblanca (large leaf), Chieftain (medium leaf) |
| Ribwort plantain (Plantago lanceolata L.) | Ceres Tonic (D) |
| Chicory (Cichorium intybus L.) | Grasslands Choice (D), Puna (D) |
1Heading date (date/month), ploidy (D – diploid, T – tetraploid, H – hexaploid) and other cultivar classification characteristics. PRG cultivars were all of intermediate heading date.
At each cut, the herbage was harvested to a 6-cm stubble height using a Haldrup forage plot harvester (J. Haldrup, Løgstør, Denmark) before being passed through a precision-chop forage harvester (MEX V1, Pottinger, Grieskirchen, Austria) set to a theoretical chop length of 19 mm. A representative 6 kg sample from each plot was immediately ensiled in a laboratory silo (O’Kiely & Wilson, 1991) for 100 days at approximately 15°C. The sealed silos accommodated steel weights to apply practical levels of pressure to the compacted herbage and permitted the drainage of effluent throughout the ensilage and its separate storage beneath the silage. At the silo opening, the silage and effluent were weighed and sampled. Silage DM recovery was calculated as the weight of silage DM removed from the silo expressed as a proportion of the weight of herbage DM ensiled. Samples of herbage taken pre- and post-ensilage were stored at −18°C prior to chemical analysis. Sward botanical composition was determined on pre-ensilage samples and was reported by (Moloney et al., 2020b).
Chemical analysis
Representative samples of pre-ensilage herbage were dried at 98°C for 16 h in an oven with forced air circulation, while post-ensilage samples were dried at 40°C for 48 h to estimate silage DM content. Sub-samples of the pre- and post-ensilage herbage were dried at 60°C and 40°C for 48 h, respectively, before being milled through a 1 mm aperture sieve (Wiley mill, 1 mm pore screen). In vitro DM digestibility (DMD) was then determined using the method of Tilley and Terry (1963) with the modification that the final residue was isolated by filtration (Whatman GF/A 55 mm, pore size 1.6 µm; Whatman International, Maidstone, UK) rather than by centrifugation. WSC content was measured using the anthrone method on an Autoanalyser 3 (Bran and Leubbe GmbH, Norderstedt, Germany) and, for pre-ensilage herbage only, expressed on an aqueous phase (WSCaq; g/kg aqueous extract) basis, while ash was determined by complete combustion in a muffle furnace at 550°C for 5 h. The crude protein (CP) content (N × 6.25) was determined using a LECO FP 428 N analyser (Leco Instruments, St. Joseph, MI, USA) based on the method 990-03 of the Association of Analytical Chemists (AOAC) (1990). Herbage buffering capacity was determined for pre-ensilage herbage only according to the method of Playne and McDonald (1966) using an 809 Titrando Universal Titrator and Titrosampler (Metrohm, Herisau, Switzerland). Pre-ensilage DMD, CP, WSC and ash have been reported by Moloney et al. (2020a).
Aqueous extracts were obtained from each silage sample, and pH was determined using a pH electrode (HI98127; Hanna Instruments Ltd., Leighton Buzzard, Bedfordshire, UK). L-lactic acid concentration was determined using the SP-Ace Clinical Chemical Analyzer, (Alfa Wassermann Inc., West Caldwell, NJ, USA) and the L-lactic acid ultraviolet (UV)-method test kit (catalogue no. 101309084035; Roche/R-Biopharm, Darmstadt, Germany), whereas D-lactate concentration was determined using the enzyme D-lactate dehydrogenase (catalogue no. 1016941001; Roche/R-Biopharm). The concentration of ammonia (NH3) was determined using the SP-Ace Clinical Chemical Analyzer and the Thermo Electron Infinity ammonia liquid stable reagent kinetic method (Thermo Fisher Scientific Inc., Waltham, MA, USA).
A fermentation coefficient for pre-ensiled herbage was calculated according to Weissbach and Honig (1996) as follows:

where DM = DM g/100 g; WSCdm = WSC of pre-ensiled herbage on a DM basis; BC = buffering capacity expressed as g lactic acid/kg DM, calculated as 0.1545 buffering capacity (mEq/kg DM) – 2.1153.
The index of Flieg’s point (Moselhy et al., 2015) was used as a gauge of the general standard of silage preservation and was calculated as follows:

where DM was expressed as g/100 g. According to this index, silage preservation was considered “very bad” at values < 20, “bad” between 21 and 40, “medium” between 41 and 60, “good” between 61 and 80, and “very good” between 81 and 100.
Statistical analysis
The analysis was fitted as a one-way classification of 11 treatments which accounted for the four replicate blocks, using the Mixed procedure in SAS 9.4 (SAS, 2013). Within the 11 treatments, there were two subsets with a factorial structure and two subsets with simple contrasts. These constituted four groupings of treatment that addressed the four objectives of the study described previously. Group 1 included seven treatments (PRG/360N, IRG/360N, TIM/360N, PRG/RC, IRG/RC, TIM/RC and RC) to give a (3 × 2) + 1 arrangement with the +1 (i.e. RC) being a control. Group 2 and Group 3 were simple four- (PRG/360N, PRG/RC, Mix 1/0N and Mix 2/0N) and three- (PRG/360N, Mix 1/360N and Mix 2/360N) level one-way classifications, while Group 4 included four treatments (Mix 1/0N, Mix 1/360N, Mix 2/0N and Mix 2/360N) organised in a 2 × 2 factorial arrangement. In order to accommodate these structures, a series of contrasts were used to evaluate interactions and associated main effects. Main effect means were estimated and compared where appropriate for each of the three cuts separately. Residual checks were made to ensure that the assumptions of the analysis were met. Depending on the results of the interaction tests, multiple comparison adjustments were made (step-down Bonferroni adjustment), for each variable analysed, for each of the relevant sets of comparisons.
Results
Perennial ryegrass, Italian ryegrass and timothy receiving inorganic N or grown with red clover (Group 1; PRG/360N, IRG/360N, TIM/360N, PRG/RC, IRG/RC, TIM/RC and RC)
Herbage ensilability
At Cut 1 (Tables 3 and 4), herbage WSCaq content was greater (P < 0.05) for Italian ryegrass-based treatments (IRG/360N plus IRG/RC) than for perennial ryegrass-based treatments (PRG/360N plus PRG/RC) which were in turn greater (P < 0.05) than timothy-based treatments (TIM/360N plus TIM/RC) and RC. Furthermore, at both Cuts 1 and 2, IRG/RC and IRG/360N had greater (P < 0.01) WSCaq than RC while at Cut 2 (Tables 5 and 6), Italian ryegrass-based treatments had greater (P < 0.01) WSCaq content than both perennial ryegrass- and timothy-based treatments, with the magnitude of difference being greater when each grass was grown with red clover than inorganic N. At Cut 3 (Tables 7 and 8), IRG/360N and PRG/360N had a greater (P < 0.01) WSCaq content than TIM/360N, while IRG/RC had a greater WSCaq than both PRG/RC and TIM/RC with RC being intermediate.
Herbage buffering capacity at Cut 1 was greater (P < 0.05) for timothy-based treatments than for Italian ryegrass-based treatments, with perennial ryegrass-based treatments being intermediate, while RC had a greater (P < 0.01) buffering capacity than all other treatments. At Cut 2, the buffering capacity was greater (P < 0.01) for RC, PRG/RC and TIM/RC than for IRG/RC, while there was no difference (P > 0.05) in the buffering capacity of IRG/360N, PRG/360N or TIM/360N. At Cut 3, the buffering capacity was greatest (P < 0.01) for RC, while perennial ryegrass-based treatments had greater (P < 0.01) buffering capacity than timothy-based treatments which were greater (P < 0.01) than Italian ryegrass-based treatments. Furthermore, values were greater (P < 0.001) when grasses were grown with red clover (grass + RC) than inorganic N (grass + N).
Mean herbage ensilability, and silage nutritive value, fermentation and conservation losses, and the associated SEM and P values, for all 11 treatments at Cut 1
| IRG/360N | PRG/360N | TIM/360N | RC | IRG/RC | PRG/RC | TIM/RC | Mix 1/0N | Mix 1/360N | Mix 2/0N | Mix 2/360N | SEM | P | |
|---|---|---|---|---|---|---|---|---|---|---|---|---|---|
| Herbage ensilability | |||||||||||||
| WSCaq 1 | 32 | 26 | 10 | 9 | 51 | 26 | 15 | 17 | 17 | 24 | 14 | 6.0 | < 0.01 |
| Buffering capacity2 | 288 | 284 | 312 | 540 | 237 | 286 | 321 | 295 | 290 | 278 | 311 | 18.3 | < 0.001 |
| Fermentation coefficient | 48 | 43 | 24 | 19 | 70 | 42 | 30 | 33 | 34 | 42 | 29 | 6.5 | < 0.001 |
| Silage fermentation | |||||||||||||
| pH | 4.1 | 4.1 | 4.4 | 5.1 | 3.7 | 3.8 | 4.6 | 4.3 | 4.1 | 3.8 | 4.1 | 0.20 | < 0.01 |
| LA3 | 59 | 69 | 51 | 12 | 92 | 88 | 38 | 81 | 56 | 83 | 65 | 16.4 | < 0.05 |
| D-LA4 | 537 | 560 | 578 | 512 | 531 | 539 | 615 | 610 | 558 | 534 | 574 | 37.5 | 0.660 |
| WSC3 | 18 | 11 | 10 | 10 | 42 | 18 | 11 | 12 | 12 | 16 | 11 | 3.1 | < 0.001 |
| NH3-N5 | 109 | 130 | 154 | 188 | 63 | 86 | 202 | 165 | 109 | 76 | 103 | 46.6 | 0.333 |
| Flieg’s point | 75 | 73 | 64 | 30 | 95 | 85 | 52 | 65 | 72 | 86 | 73 | 8.6 | 0.001 |
| Conservation losses | |||||||||||||
| Effluent output6 | 186 | 184 | 202 | 317 | 149 | 122 | 185 | 174 | 215 | 112 | 194 | 20.1 | < 0.001 |
| Recovery rate7 | 870 | 832 | 952 | 741 | 893 | 899 | 855 | 941 | 893 | 925 | 931 | 31.6 | 0.002 |
| Silage nutritive value | |||||||||||||
| DM8 | 174 | 157 | 165 | 149 | 188 | 172 | 156 | 167 | 161 | 170 | 163 | 7.2 | 0.053 |
| DMD8 | 655 | 656 | 685 | 614 | 677 | 703 | 685 | 695 | 682 | 701 | 674 | 14.2 | < 0.01 |
| Crude protein3 | 123 | 131 | 137 | 176 | 94 | 107 | 117 | 111 | 126 | 110 | 130 | 5.6 | < 0.001 |
The above SEM was used in the contrasts of Groups 3 and 4; DMD = DM digestibility; LA = lactic acid; WSC = water-soluble carbohydrates; WSCaq = water-soluble carbohydrates (aqueous phase basis).
1g/L.
2mEq/kg DM.
3g/kg DM.
4g D-lactic acid/kg lactic acid.
5g/kg N.
6g/kg fresh herbage ensiled.
7g silage DM/kg herbage DM ensiled.
8g/kg.
SEM and P values for herbage ensilability, and silage nutritive value, fermentation and conservation losses for the main effects and interactions for two groups of treatments at Cut 1
| Group1
| 1 |
|
|
|
|
| 4 |
|
|
|
|
|
|---|---|---|---|---|---|---|---|---|---|---|---|---|
| Species2
|
| N source3
|
| Species |
| Mix4
|
| N rate5
|
| Mix |
| |
|
|
|
|
| X |
|
|
|
|
| X |
| |
|
|
|
|
| N source |
|
|
|
|
| N rate |
| |
| SEM | P | SEM | P | SEM6 | P | SEM | P | SEM | P | SEM | P | |
| Herbage ensilability | ||||||||||||
| WSCaq 7 | 4.2 | < 0.001 | 3.5 | 0.105 | 6 | 0.289 | 4.2 | 0.741 | 4.2 | 0.411 | 6 | 0.384 |
| Buffering capacity8 | 13 | 0.021 | 10.6 | 0.366 | 18.3 | 0.221 | 13 | 0.899 | 13 | 0.452 | 18.3 | 0.307 |
| Fermentation coefficient | 4.6 | < 0.001 | 3.7 | 0.09 | 6.5 | 0.181 | 4.6 | 0.765 | 4.6 | 0.344 | 0.329 | 6.5 |
| Silage fermentation | ||||||||||||
| pH | 0.14 | 0.013 | 0.11 | 0.427 | 0.2 | 0.225 | 0.14 | 0.188 | 0.14 | 0.793 | 0.2 | 0.227 |
| LA9 | 10.8 | 0.064 | 9 | 0.291 | 16.4 | 0.313 | 10.8 | 0.691 | 10.8 | 0.156 | 16.4 | 0.795 |
| D-LA10 | 26.5 | 0.238 | 21.7 | 0.925 | 37.5 | 0.729 | 26.5 | 0.441 | 26.5 | 0.871 | 37.5 | 0.228 |
| WSC9 | 2.2 | < 0.001 | 1.8 | < 0.001 | 3.1 | 0.002 | 2.2 | 0.506 | 2.2 | 0.419 | 3.1 | 0.472 |
| NH3-N11 | 30.6 | 0.105 | 25.6 | 0.692 | 46.6 | 0.476 | 30.6 | 0.239 | 30.6 | 0.712 | 46.6 | 0.309 |
| Flieg’s point | 6.1 | 0.009 | 4.9 | 0.357 | 8.6 | 0.169 | 6.1 | 0.205 | 6.1 | 0.696 | 8.6 | 0.254 |
| Conservation losses | ||||||||||||
| Effluent output12 | 15.5 | 0.166 | 12.3 | 0.03 | 20.1 | 0.556 | 15.5 | 0.059 | 15.5 | 0.006 | 20.1 | 0.324 |
| Recovery rate13 | 22.3 | 0.491 | 18.2 | 0.925 | 31.6 | 0.038 | 22.3 | 0.734 | 22.3 | 0.51 | 31.6 | 0.389 |
| Silage nutritive value | ||||||||||||
| DM14 | 5.1 | 0.016 | 4.2 | 0.265 | 7.2 | 0.191 | 5.1 | 0.756 | 5.1 | 0.376 | 7.2 | 0.894 |
| DMD14 | 10 | 0.613 | 8.2 | 0.016 | 14.2 | 0.536 | 10 | 0.937 | 10 | 0.171 | 14.2 | 0.643 |
| Crude protein9 | 4 | 0.009 | 3.3 | < 0.001 | 5.6 | 0.778 | 4 | 0.792 | 4 | 0.004 | 5.6 | 0.66 |
DMD = DM digestibility; IRG = Italian ryegrass; LA = lactic acid; PRG = perennial ryegrass; RC = red clover; TIM = timothy; WSC = water-soluble carbohydrates; WSCaq = water-soluble carbohydrates (aqueous phase basis).
1Group 1 = IRG/360N, PRG/360N, TIM/360N, IRG/RC, PRG/RC, TIM/RC with RC as a control; Group 4 = Mix 1/0N, Mix 1/360N, Mix 2/0N and Mix 2/360N.
2Species = PRG, IRG and TIM.
3N source = 360 kg N/ha per year or RC.
4Mix = Mix 1 or Mix 2.
5N rate = 0 or 360 kg N/ha/year.
6This SEM was calculated for the 3 × 2 interaction but is also used when comparing RC to any of the 3 × 2 treatments.
7g/L.
8mEq/kg DM.
9g/kg DM.
10g D-lactic acid.
11g/kg N.
12g/kg fresh herbage ensiled.
13g silage DM/kg herbage DM ensiled.
14g/kg.
Fermentation characteristics
Silage pH was greatest (P < 0.05) for RC compared with Italian ryegrass-, perennial ryegrass- or timothy-based silages at Cuts 1 (Tables 3 and 4) and 2 (Tables 5 and 6), while at Cut 3 (Tables 7 and 8) TIM/360N had a greater value than PRG/360N and both TIM/RC and PRG/RC had greater values than IRG/RC (P < 0.05).
Silage lactic acid concentration at Cut 2 was greater (P < 0.001) for perennial ryegrass-based silages than Italian ryegrass- or timothy-based silages as well as RC, while at Cut 3 lactic acid concentration was greater (P < 0.01) for PRG/360N than for RC, PRG/RC and TIM/RC. Furthermore, the proportion of D-lactate was greater (P < 0.05) for TIM/RC than for PRG/360N.
Mean herbage ensilability, and silage nutritive value, fermentation and conservation losses, and the associated SEM and P values, for all 11 treatments at Cut 2
| IRG/360N | PRG/360N | TIM/360N | RC | IRG/RC | PRG/RC | TIM/RC | Mix 1/0N | Mix 1/360N | Mix 2/0N | Mix 2/360N | SEM | P | |
|---|---|---|---|---|---|---|---|---|---|---|---|---|---|
| Herbage ensilability | |||||||||||||
| WSCaq 1 | 44 | 23 | 25 | 15 | 76 | 24 | 22 | 26 | 18 | 23 | 19 | 5.1 | < 0.001 |
| Buffering capacity | 329 | 409 | 313 | 605 | 219 | 518 | 475 | 447 | 397 | 488 | 425 | 34.4 | < 0.001 |
| Fermentation coefficient | 50 | 32 | 38 | 22 | 81 | 29 | 32 | 32 | 29 | 30 | 29 | 4.7 | < 0.001 |
| Silage fermentation | |||||||||||||
| pH | 3.8 | 3.9 | 3.9 | 4.6 | 3.8 | 4.0 | 4.4 | 4.0 | 3.9 | 4.0 | 4.1 | 0.13 | < 0.01 |
| LA | 104 | 134 | 95 | 71 | 74 | 131 | 76 | 117 | 109 | 106 | 103 | 11.0 | < 0.01 |
| D-LA | 462 | 487 | 475 | 480 | 479 | 463 | 491 | 479 | 475 | 474 | 524 | 16.8 | 0.480 |
| WSC | 16 | 13 | 11 | 8 | 32 | 17 | 10 | 15 | 10 | 15 | 12 | 3.7 | < 0.01 |
| NH3-N | 67 | 63 | 46 | 80 | 53 | 69 | 89 | 66 | 60 | 64 | 73 | 6.6 | < 0.01 |
| Flieg’s point | 96 | 87 | 98 | 59 | 101 | 85 | 68 | 85 | 87 | 84 | 77 | 6.0 | < 0.001 |
| Conservation losses | |||||||||||||
| Effluent output | 39 | 88 | 50 | 73 | 60 | 40 | 35 | 3 | 77 | 62 | 37 | 35.9 | 0.911 |
| Recovery rate | 964 | 994 | 994 | 976 | 915 | 985 | 974 | 985 | 993 | 995 | 969 | 18.6 | 0.182 |
| Silage nutritive value | |||||||||||||
| DM | 223 | 183 | 238 | 183 | 245 | 190 | 192 | 193 | 197 | 195 | 185 | 5.9 | < 0.001 |
| DMD | 654 | 770 | 690 | 670 | 688 | 747 | 690 | 754 | 728 | 724 | 726 | 15.4 | < 0.001 |
| Crude protein | 142 | 175 | 149 | 213 | 90 | 157 | 165 | 158 | 169 | 151 | 162 | 7.7 | < 0.001 |
DMD = DM digestibility; IRG = Italian ryegrass; LA = lactic acid; PRG = perennial ryegrass; RC = red clover; TIM = timothy; WSC = water-soluble carbohydrates; WSCaq = water-soluble carbohydrates (aqueous phase basis).
1See footnotes beneath Table 3.
SEM and P values for herbage ensilability, and silage nutritive value, fermentation and conservation losses for the main effects and interactions for two groups of treatments at Cut 2
| Group1
| 1 |
|
|
|
|
| 4 |
|
|
|
|
|
|---|---|---|---|---|---|---|---|---|---|---|---|---|
| Species |
| N source |
| Species |
| Mix |
| N rate |
| Mix |
| |
|
|
|
|
| X |
|
|
|
|
| X |
| |
|
|
|
|
| N source |
|
|
|
|
| N rate |
| |
| SEM | P | SEM | P | SEM | P | SEM | P | SEM | P | SEM | P | |
| Herbage ensilability | ||||||||||||
| WSCaq | 3.6 | < 0.001 | 2.9 | 0.022 | 5.1 | 0.003 | 3.6 | 0.844 | 3.6 | 0.24 | 5.1 | 0.763 |
| Buffering capacity | 24.3 | < 0.001 | 19.8 | 0.063 | 34.4 | 0.001 | 24.3 | 0.322 | 24.3 | 0.111 | 34.4 | 0.838 |
| Fermentation coefficient | 3.3 | < 0.001 | 2.7 | 0.068 | 4.7 | < 0.001 | 3.3 | 0.756 | 3.3 | 0.717 | 4.7 | 0.835 |
| Silage fermentation | ||||||||||||
| pH | 0.09 | 0.093 | 0.08 | 0.065 | 0.13 | 0.111 | 0.09 | 0.392 | 0.09 | 0.731 | 0.13 | 0.62 |
| LA | 7.8 | 0.001 | 6.3 | 0.063 | 11 | 0.46 | 7.8 | 0.454 | 7.8 | 0.652 | 11 | 0.836 |
| D-LA | 11.9 | 0.758 | 9.7 | 0.827 | 16.8 | 0.391 | 11.9 | 0.206 | 11.9 | 0.178 | 16.8 | 0.125 |
| WSC | 2.6 | 0.003 | 2.1 | 0.046 | 3.7 | 0.07 | 2.6 | 0.822 | 2.6 | 0.293 | 3.7 | 0.851 |
| NH3-N | 4.7 | 0.508 | 3.8 | 0.037 | 6.6 | 0.001 | 4.7 | 0.428 | 4.7 | 0.844 | 6.6 | 0.226 |
| Flieg’s point | 4.2 | 0.034 | 3.5 | 0.067 | 6 | 0.016 | 4.2 | 0.372 | 4.2 | 0.688 | 6 | 0.519 |
| Conservation losses | ||||||||||||
| Effluent output | 25.4 | 0.827 | 20.7 | 0.643 | 35.9 | 0.636 | 25.4 | 0.791 | 25.4 | 0.5 | 35.9 | 0.178 |
| Recovery rate | 13.1 | 0.023 | 10.7 | 0.105 | 18.6 | 0.561 | 13.1 | 0.714 | 13.1 | 0.636 | 18.6 | 0.384 |
| Silage nutritive value | ||||||||||||
| DM | 4.2 | < 0.001 | 3.4 | 0.239 | 5.9 | < 0.001 | 4.2 | 0.44 | 4.2 | 0.601 | 5.9 | 0.277 |
| DMD | 10.9 | < 0.001 | 8.9 | 0.618 | 15.4 | 0.194 | 10.9 | 0.31 | 10.9 | 0.436 | 15.4 | 0.383 |
| Crude protein | 5.4 | < 0.001 | 4.4 | 0.008 | 7.7 | 0.001 | 5.4 | 0.343 | 5.4 | 0.175 | 7.7 | 0.987 |
DMD = DM digestibility; LA = lactic acid; WSC = water-soluble carbohydrates; WSCaq = water-soluble carbohydrates (aqueous phase basis).
1See footnotes beneath Table 4.
Italian ryegrass-based silages had a greater (P < 0.01) WSC content than perennial ryegrass- and timothy-based silages and RC at Cuts 1 and 2, with the magnitude of this difference being greater (P < 0.01) when each grass was grown with red clover than with inorganic N at Cut 1 only.
Concentrations of NH3-N at Cut 2 were greater (P < 0.05) for TIM/RC than for IRG/360N, PRG/360N, TIM/360N, IRG/RC and PRG/RC, while RC was greater (P < 0.05) than TIM/360N and IRG/RC. At Cut 3, TIM/360N, PRG/RC and TIM/RC had greater (P < 0.05) NH3-N concentrations than PRG/360N, while TIM/360N was greater than IRG/360N, PRG/360N and IRG/RC.
Conservation losses
Effluent production (P < 0.05) was greater for grass + N than for grass + RC at Cut 1 (Tables 3 and 4), while RC produced more effluent than any other treatment (P < 0.01). At Cut 3 (Tables 7 and 8), however, effluent production was greater (P < 0.01) for grass + RC than for grass + N. Silage DM recovery rates at Cut 1 were greater (P < 0.05) for TIM/360N than for PRG/360N, TIM/RC and RC, while at Cut 2 (Tables 5 and 6) DM recovery was greater (P < 0.05) for perennial ryegrass- and timothy-based silages than for Italian ryegrass-based silages.
Mean herbage ensilability, and silage nutritive value, fermentation and conservation losses, and the associated SEM and P values, for all 11 treatments at Cut 3
| IRG/360N | PRG/360N | TIM/360N | RC | IRG/RC | PRG/RC | TIM/RC | Mix 1/0N | Mix 1/360N | Mix 2/0N | Mix 2/360N | SEM | P | |
|---|---|---|---|---|---|---|---|---|---|---|---|---|---|
| Herbage ensilability | |||||||||||||
| WSCaq 1 | 17 | 16 | 7 | 11 | 14 | 9 | 8 | 8 | 11 | 8 | 10 | 1.0 | < 0.001 |
| Buffering capacity | 435 | 560 | 476 | 757 | 533 | 775 | 666 | 671 | 544 | 651 | 569 | 26.2 | < 0.001 |
| Fermentation coefficient | 27 | 23 | 19 | 17 | 23 | 17 | 17 | 17 | 21 | 17 | 19 | 0.9 | < 0.001 |
| Silage fermentation | |||||||||||||
| pH | 4.9 | 4.3 | 5.3 | 5.4 | 4.6 | 5.8 | 5.9 | 5.7 | 5.6 | 5.6 | 5.4 | 0.24 | < 0.001 |
| LA | 14 | 42 | 10 | 4 | 25 | 3 | 1 | 7 | 2 | 4 | 2 | 7.8 | < 0.01 |
| D-LA | 550 | 519 | 594 | 589 | 544 | 603 | 606 | 579 | 590 | 603 | 580 | 17.1 | < 0.05 |
| WSC | 8 | 10 | 7 | 7 | 8 | 7 | 7 | 8 | 8 | 7 | 8 | 0.5 | < 0.05 |
| NH3-N | 164 | 85 | 362 | 230 | 126 | 326 | 282 | 219 | 231 | 280 | 377 | 64.6 | < 0.05 |
| Flieg’s point | 43 | 65 | 26 | 21 | 52 | 5 | −3 | 9 | 10 | 9 | 19 | 10.6 | 0.001 |
| Conservation losses | |||||||||||||
| Effluent output | 75 | 100 | 97 | 133 | 159 | 189 | 176 | 137 | 66 | 177 | 142 | 34.4 | 0.177 |
| Recovery rate | 857 | 987 | 933 | 970 | 915 | 909 | 937 | 948 | 934 | 923 | 895 | 42.0 | 0.713 |
| Silage nutritive value | |||||||||||||
| DM | 161 | 168 | 157 | 155 | 166 | 155 | 147 | 155 | 149 | 147 | 145 | 7.4 | 0.417 |
| DMD | 644 | 782 | 661 | 666 | 732 | 683 | 661 | 666 | 706 | 689 | 708 | 16.9 | < 0.001 |
| Crude protein | 172 | 207 | 156 | 186 | 192 | 160 | 179 | 195 | 173 | 174 | 168 | 7.8 | < 0.01 |
DMD = DM digestibility; IRG = Italian ryegrass; LA = lactic acid; PRG = perennial ryegrass; RC = red clover; TIM = timothy; WSC = water-soluble carbohydrates; WSCaq = water-soluble carbohydrates (aqueous phase basis).
1See footnotes beneath Table 3.
SEM and P values for herbage ensilability, and silage nutritive value, fermentation and conservation losses for the main effects and interactions for two groups of treatments at Cut 3
| Group1
| 1 |
|
|
|
|
| 4 |
|
|
|
|
|
|---|---|---|---|---|---|---|---|---|---|---|---|---|
| Species |
| N source |
| Species |
| Mix |
| N rate |
| Mix |
| |
|
|
|
|
| X |
|
|
|
|
| X |
| |
|
|
|
|
| N source |
|
|
|
|
| N rate |
| |
| SEM | P | SEM | P | SEM | P | SEM | P | SEM | P | SEM | P | |
| Herbage ensilability | ||||||||||||
| WSCaq 1 | 0.7 | < 0.001 | 0.6 | 0.001 | 1.0 | 0.003 | 0.7 | 0.806 | 0.7 | 0.011 | 1.0 | 0.463 |
| Buffering capacity | 18.5 | < 0.001 | 15.1 | < 0.001 | 26.2 | 0.08 | 18.5 | 0.935 | 18.5 | < 0.001 | 26.2 | 0.399 |
| Fermentation coefficient | 0.6 | < 0.001 | 0.5 | < 0.001 | 0.9 | 0.159 | 0.6 | 0.55 | 0.6 | < 0.001 | 0.9 | 0.422 |
| Silage fermentation | ||||||||||||
| pH | 0.17 | 0.005 | 0.14 | 0.003 | 0.24 | 0.008 | 0.17 | 0.562 | 0.17 | 0.562 | 0.24 | 0.684 |
| LA | 5.1 | 0.058 | 4.1 | 0.035 | 7.8 | 0.003 | 5.1 | 0.859 | 5.1 | 0.655 | 7.8 | 0.861 |
| D-LA | 12.1 | 0.012 | 9.9 | 0.04 | 17.1 | 0.035 | 12.1 | 0.7 | 12.1 | 0.734 | 17.1 | 0.325 |
| WSC | 0.4 | 0.029 | 0.3 | 0.046 | 0.5 | 0.015 | 0.4 | 0.957 | 0.4 | 0.122 | 0.5 | 0.551 |
| NH3-N | 42.5 | 0.016 | 33.8 | 0.385 | 64.6 | 0.016 | 42.5 | 0.085 | 42.5 | 0.351 | 64.6 | 0.464 |
| Flieg’s point | 7.5 | 0.006 | 6.1 | 0.004 | 10.6 | 0.01 | 7.5 | 0.679 | 7.5 | 0.646 | 10.6 | 0.678 |
| Conservation losses | ||||||||||||
| Effluent output | 24.3 | 0.707 | 19.8 | 0.005 | 34.4 | 0.99 | 24.3 | 0.101 | 24.3 | 0.131 | 34.4 | 0.611 |
| Recovery rate | 29.7 | 0.309 | 24.3 | 0.874 | 42 | 0.283 | 29.7 | 0.456 | 29.7 | 0.617 | 42 | 0.865 |
| Silage nutritive value | ||||||||||||
| DM | 5.2 | 0.297 | 4.3 | 0.328 | 7.4 | 0.463 | 5.2 | 0.392 | 5.2 | 0.591 | 7.4 | 0.767 |
| DMD | 11.9 | 0.008 | 9.8 | 0.272 | 16.9 | < 0.001 | 11.9 | 0.469 | 11.9 | 0.087 | 16.9 | 0.553 |
| Crude protein | 5.5 | 0.084 | 4.5 | 0.825 | 7.8 | < 0.001 | 5.5 | 0.108 | 5.5 | 0.084 | 7.8 | 0.289 |
DMD = DM digestibility; LA = lactic acid; WSC = water-soluble carbohydrates; WSCaq = water-soluble carbohydrates (aqueous phase basis).
1See footnotes beneath Table 4.
Silage nutritive value
Silage DM content at Cut 1 (Tables 3 and 4) was greater (P < 0.01) for Italian ryegrass-based silages than for RC and at Cut 2 (Tables 5 and 6) it was greater (P < 0.001) for IRG/RC and TIM/360N than for TIM/RC, PRG/RC, RC and PRG/360N.
Silage DMD at Cut 1 was lower (P < 0.01) for RC than for Italian ryegrass-, perennial ryegrass- and timothy-based silages; however, DMD values were greater (P < 0.05) for grass + RC than for grass + N. At Cut 2, perennial ryegrass-based silages (PRG/360N and PRG/RC) had greater (P < 0.001) values than Italian ryegrass or timothy-based silages (IRG/360, IRG/RC or TIM/360N, TIM/RC, respectively) and RC. At Cut 3 (Tables 7 and 8), PRG/360N had a greater (P < 0.05) DMD than TIM/360N which, in turn, was greater than IRG/360N. Furthermore, at Cut 3, PRG/360N had a greater (P < 0.05) DMD value than PRG/RC, IRG/360N had a lower (P < 0.05) value than IRG/RC, while RC had a lower (P < 0.05) DMD value than both PRG/360N and IRG/RC.
The silage CP content was greater (P < 0.01) for RC than for all other treatments at Cuts 1 and 2. Furthermore, at Cut 1, the silage CP content was greater (P < 0.01) for timothy than for Italian ryegrass-based silages, while grass + N had greater (P < 0.001) values than grass + RC. The silage CP content at Cut 2 was greater for PRG/360N than for TIM/360N and IRG/360N; however, both PRG/RC and TIM/RC had greater values than IRG/RC (P < 0.001). At Cut 3, PRG/360N had a greater (P < 0.01) CP content than PRG/RC and TIM/360N, while IRG/RC was greater than PRG/RC, PRG/360N was greater than PRG/RC, and TIM/RC was greater than TIM/360N (P < 0.05).
Perennial ryegrass at 360N versus binary- and multi-species mixtures at 0N (Group 2; PRG/360N, PRG/RC, Mix 1/0N and Mix 2/0N)
Herbage ensilability
Herbage WSCaq at Cut 3 (Tables 7 and 8) was greatest (P < 0.01) for PRG/360N. Buffering capacity at Cut 2 (Tables 5 and 6) was greater (P < 0.01) for PRG/RC than for PRG/360N, while at Cut 3 PRG/RC had the greatest (P < 0.01) buffering capacity. Furthermore, at Cut 3, Mix 1/0N and Mix 2/0N were greater (P < 0.01) than PRG/360N.
Fermentation characteristics
There was no difference (P > 0.05) in pH or WSC content between species except at Cut 3 (Tables 7 and 8) where PRG/360N had the lowest (P < 0.001) pH value and the highest (P < 0.05) WSC content.
At Cut 3, lactic acid concentration was greatest (P < 0.01) for PRG/360N, while at the same cut D-lactate as a proportion of lactic acid was least (P < 0.01) in PRG/360N silage. Furthermore, at Cut 3, NH3-N concentrations were greater for PRG/RC and Mix 2/0N (P < 0.05) than for PRG/360N.
Conservation losses
Effluent production was greater (P < 0.05) for PRG/360N than for PRG/RC and Mix 2/0N at Cut 1 (Tables 3 and 4), while DM recovery rates were greater (P < 0.05) for Mix 1/0N and Mix 2/0N than PRG/360N at the same cut.
Silage nutritive value
Silage DMD values at Cut 1 (Tables 3 and 4) were greater (P < 0.01) for PRG/RC and Mix 2/0N than for PRG/360N. At Cut 2 (Tables 5 and 6), PRG/360N had greater (P < 0.01) values than Mix 2/0N, while PRG/360N had the greatest (P < 0.01) DMD at Cut 3 (Tables 7 and 8).
At Cut 1, the silage CP content was greatest (P < 0.01) for PRG/360N, while at Cuts 2 and 3 the values for PRG/360N were greater (P < 0.01) than for Mix 2/0N. Furthermore, at Cut 3 PRG/360N, Mix 1/0N and Mix 2/0N had greater (P < 0.01) CP contents than PRG/RC.
Perennial ryegrass versus two multi-species mixtures at 360N (Group 3; PRG/360N, Mix 1/360N and Mix 2/360N)
Herbage ensilability
There was no difference in the ensilability indices of each species treatment except at Cut 3 (Tables 7 and 8) where the WSCaq content of PRG/360N was greater (P < 0.01) than that of Mix 1/360N and Mix 2/360N.
Fermentation characteristics
There was no treatment effect on silage pH or WSC content except at Cut 3 (Tables 7 and 8) where PRG/360N had the lowest (P < 0.01) pH and a greater (P < 0.01) WSC content than Mix 1/360N. Furthermore, there was no treatment effect on the concentration of LA and NH3-N at Cuts 1 (Tables 3 and 4) and 2 (Tables 5 and 6). At Cut 3, however, lactic acid concentration was greatest (P < 0.01) for PRG/360N while the proportion of D-lactate was greater for Mix 1/360N and Mix 2/360N than for PRG/360N.
Multi-species mixtures at 0N or 360N (Group 4; Mix 1/0N, Mix 2/0N, Mix 1/360N and Mix 2/360N)
Herbage ensilability
There was no effect of species mixture or rate of inorganic N on the ensilability of herbage except at Cut 3 (Tables 7 and 8) where WSCaq was lower (P < 0.05) and buffering capacity was greater (P < 0.001) for 0N than for 360N.
Fermentation characteristics
There were no effects (P > 0.05) of treatment on fermentation characteristics.
Discussion
In Ireland, herbage harvested from grassland swards sometimes receives relatively little field wilting prior to ensiling due to unsuitable weather conditions. The range of mean DM values of 116–257 g/kg for the 33 unwilted herbages ensiled (three cuts of 11 treatments) reflects the prevailing moist crop-growing conditions, and agrees with previous values reported by Keating & O’Kiely (2000a), Conaghan et al. (2012) and Clavin et al. (2017), while the corresponding values for WSCaq (7–76 g/L), buffering capacity (219–775 mEq/kg DM) and fermentation coefficient (17–81) represent a broad range in these crop ensilability indicators. Weissbach & Honig (1996) indicated that herbages with fermentation coefficients above 35 were likely to preserve satisfactorily as silage, provided either their nitrate content exceeded 0.5 g/kg DM or their culturable lactic acid bacteria numbers exceeded 105 cfu/g. Under Irish climatic conditions, grassland swards managed for commercial silage production commonly reach these nitrate (Muck et al., 1991; Lorenzo & O’Kiely, 2008; Navarro-Villa et al., 2011) and lactic acid bacteria (Moran et al., 1990) thresholds.
The relationship between the fermentation coefficient and Flieg index values for the 132 herbage-silage experimental units was as follows (Figure 1):

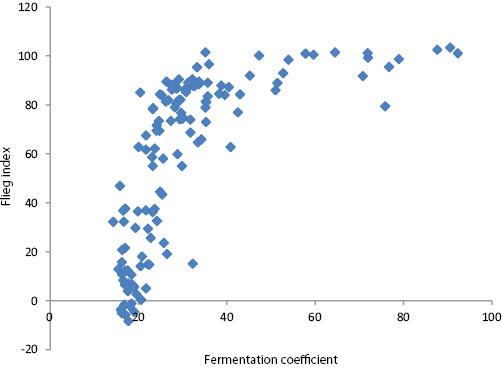
The relationship between the fermentation coefficient and the Flieg index values for the 132 herbage-silage experimental units.
This indicates that factors other than DM, WSC and buffering capacity influenced the fermentation outcomes. These could include, in individual cases, sub-optimal nitrate content or lactic acid bacteria numbers (Weissbach & Honig, 1996) as well as, among a range of other factors, ambient temperature, speed of availability of WSC to epiphytic microorganisms, content of other fermentable substrate, numbers of other indigenous microorganisms and the speed and extent of effluent outflow. Overall, however, the mean Flieg index point values for Cuts 1–3 of 70, 84 and 23, respectively, highlight the markedly poorer preservation characteristics at Cut 3 and this, in turn, was signposted by the particularly low fermentation coefficients of Cut 3 herbages. In contrast, however, the generally better preservation characteristics of Cut 2 compared with Cut 1 silages were not indicated by their corresponding fermentation coefficient values.
Perennial ryegrass, Italian ryegrass and timothy receiving inorganic N or grown with red clover (Group 1; PRG/360N, IRG/360N, TIM/360N, PRG/RC, IRG/RC, TIM/RC and RC)
The mean annual WSCaq and buffering capacity values of 31, 22 and 14 g/L and 235, 272 and 257 mEq/kg DM for IRG/360N, PRG/360N and TIM/360N, respectively, are of similar rankings of these species for both variables to those reported by Wilson & Collins (1980). The combined effects of these two ensilability indices, in turn, are encapsulated by the single fermentation coefficient index of Weissbach & Honig (1996) where the corresponding values of 42, 33 and 27 suggest IRG/360N was most likely and TIM/360N was least likely to preserve satisfactorily during ensilage. However, these mean annual relativities among grass species were not consistent across cuts. The differences in mean WSCaq across cuts within each grass species likely reflect the direct and indirect effects of the prevailing weather on both DM and WSC values (Deinum, 1984), whereas the general increase in buffering capacity from Cut 1 through to Cut 3 repeats a seasonal pattern previously reported by Muck et al. (1991) and can be attributed, at least in part, to the concurrent increase in CP content.
The lower WSCaq content recorded for RC than for IRG/360N and PRG/360N and its consistently greater buffering capacity than any of the grass monocultures is as expected and agrees with the findings of King et al. (2012b). Consequently, RC had a lower overall fermentation coefficient (20) than the grass monocultures. The low WSCaq contents for RC are partly due to its lower DM content (Dewhurst et al., 2009) and also to some of their non-structural carbohydrates being stored as starch rather than as WSC (Buxton & O’Kiely, 2003).
The expectation that both the WSCaq and buffering capacity of the binary mixtures might be intermediate between the values for the grass and red clover monocultures did not occur, suggesting these traits differed in either or both constituent species compared with when in monoculture. This phenomenon was previously reported by Moloney et al. (2020a). It may be, for example, that changes in the amount and/or timing of N provision by red clover to the grass species compared with N provision from inorganic fertiliser when in monoculture could have resulted in considerably greater WSCaq contents and lower buffering capacities for the grasses when in binary mixtures. Both Conaghan et al. (2012) and Clavin et al. (2017) have demonstrated that lower rates of provision of inorganic N increased grass WSCaq and reduced its buffering capacity. Consequently, the findings by Moloney et al. (2020b) of mean annual red clover contents in IRG/RC, PRG/RC and TIM/RC of 25, 55 and 54%, respectively, may explain why the effects of changing from grass plus inorganic N to the corresponding grass plus red clover binary mixture were more dramatic with IRG/RC than with PRG/RC or TIM/RC at both Cuts 1 and 2.
The absence of a difference in the effluent outflow between the three grass species monocultures is in agreement with the study by King et al. (2013), while the trend for the red clover monoculture to produce a greater output of effluent was previously identified by King et al. (2012a) and can be attributed to the characteristically low DM content of red clover. Thus, the absence of a difference in the effluent outflow between grass plus inorganic N and grass plus red clover treatments is likely due to changed characteristics of grass when in binary mixture with red clover compared with when fertilised with inorganic N. For example, if grass in the binary mixture had a greater DM content than when fertilised with inorganic N, the expected reduced effluent outflow from grass could compensate for the greater effluent outflow of red clover.
King et al. (2013) reported mean DM recovery rates for Italian ryegrass, perennial ryegrass and timothy silages of 888, 918 and 936 g/kg, respectively, with King et al. (2012a) reporting a corresponding recovery for red clover silages of 874 g/kg. Although the recovery rates for comparable treatments in the current experiment were not statistically different, the numerical trend observed (mean values of 897, 938, 960 and 896 g/kg, respectively) was similar to that in the study by King et al. (2013) The absence of a difference in the recovery rate between the binary mixtures and the corresponding grass monoculture treatments was probably strongly influenced by the simultaneous absence of an effect on the effluent outflow discussed earlier.
Silage nutritive value is primarily a product of the nutritive value of the herbage ensiled and the efficiency of the ensilage process (Dulphy & Demarquilly, 1991). Comparison of the three grass monoculture silages to their respective pre-ensiled herbages (Moloney et al., 2020a) shows a decline in DMD values at Cuts 1 and 3 where conservation losses were greatest but no such decline at Cut 2 where preservation and recovery rates were more efficient. The absence of a consistent difference in the change in DMD among the three grass species treatments or between these grass and red clover treatments is in agreement with the study by King et al. (2012a) and King et al. (2013). Thus, for silages at Cuts 2 and 3, the greater DMD observed for PRG/360N than for IRG/360N, TIM/360N and RC, and the absence of a difference among the latter three monoculture treatments, derive mainly from their relative values at the time of ensiling. Similarly, as there was no clear-cut difference between grass plus inorganic N and grass plus red clover treatments in pre-ensilage DMD or a difference in changes in DMD during ensilage, it was therefore to be expected that there would be no clear-cut difference in silage DMD.
Perennial ryegrass at 360N versus binary- and multi-species mixtures at 0N (Group 2; PRG/360N, PRG/RC, Mix 1/0N and Mix 2/0N)
The relatively similar fermentation coefficients for PRG/RC, Mix 1/0N and Mix 2/0N suggest that introducing timothy and white clover into a mixture with perennial ryegrass and red clover (i.e. PRG/RC vs. Mix 1/0N) and then subsequently replacing white clover by ribwort plantain and chicory (i.e. Mix 1/0N vs. Mix 2/0N) did not measurably alter the combined calculated impacts on ensilability of herbage DM, WSC and buffering capacity. This is surprising as the evidence from the monoculture treatments is that timothy, for example, would have an inferior fermentation coefficient to perennial ryegrass because of its lower WSC content (King et al., 2012b) and that white clover frequently has a particularly low DM content (Frame & Newbould, 1986). However, the fermentation coefficients for the individual species sampled from Mix 1 and Mix 2 (Table 9:), albeit when grown with 120 kg N/ha per year, indicate that timothy growing in multi-species mixtures had a slightly greater fermentation coefficient than a perennial ryegrass monoculture, while red and white clovers had similar fermentation coefficients to each other albeit both were lower than the grasses. The similarly low fermentation coefficients for both herbs and white clover together with their usually relatively small proportions of the harvested biomass (Moloney et al., 2020b) explain the muted impact of replacing white clover by herbs.
Perennial ryegrass monocultures managed with the input of inorganic N fertiliser have been the predominant grassland swards sown in Ireland for several decades. It is interesting that the fermentation coefficients of PRG/RC, Mix 1/0N and Mix 2/0N were only slightly lower than for this industry standard (PRG/360N). However, this scale of difference was small compared, for example, to the differences for all treatments between high values for coefficients at Cut 1 and low values at Cut 3.
When compared with pre-ensilage DMD values at Cuts 1 and 3, the corresponding lower post-ensilage values for the four treatments reflect the greater output of effluent and poorer fermentation outcome at those cuts relative to Cut 2 where there was no such decline in DMD. As there was no consistent difference in DMD between these treatments pre-ensilage (Moloney et al. 2020a) and no consistent difference in the efficiency of ensilage, it is not surprising that no clearcut differences in silage DMD emerged.
The general trend that occurred at each cut for PRG/360N to have greater CP content than the other three treatments may seem surprising as the direct and indirect effects of the legumes in the binary and multi-species mixture treatments might have been expected to elevate their CP content. However, as previously shown by Keating & O’Kiely (2000b), Conaghan et al. (2012) and Clavin et al. (2017), high inputs of inorganic N can produce grasses with relatively high CP values.
Perennial ryegrass versus two multi-species mixtures at 360N (Group 3; PRG/360N, Mix 1/360N and Mix 2/360N)
The trend that was evident at each cut of both Mix 1/360N and Mix 2/360N having a numerically lower fermentation coefficient than PRG/360N was caused mainly by their lower WSCaq values. As grass was the dominant functional group in Mix 1/360N and Mix 2/360N (grass contributed 84% and 72% of biomass across all cuts, respectively) and as timothy in these mixtures expressed relatively high fermentation coefficients as did a perennial ryegrass monoculture (Table 9), then the lower coefficients of both mixtures were due to the negative effects of both the legume and herb functional groups.
The trend for the Mix 1 and Mix 2 silages to have lower overall DMD values than the perennial ryegrass treatment (across cut mean values of 705, 703 and 736 g/kg, respectively), although not consistent across cuts, reflected their relative values pre-ensilage (717, 721 and 746 g/kg, respectively; Moloney et al., 2020a), with the reductions in the absolute values during ensilage reflecting the effects of conservation losses.
Multi-species mixtures at 0N or 360N (Group 4; Mix 1/0N, Mix 2/0N, Mix 1/360N and Mix 2/360N)
Applying inorganic N to Mix 1 changed the mean annual content of grass from 62 to 84% of herbage biomass and of legume from 38 to 16%. Changes to the grass, legume and herb contents in Mix 2 were from 54 to 72%, 22 to 8% and 24 to 20%, respectively (Moloney et al., 2020b). Despite these effects of inorganic N on botanical composition and possibly also on other traits within individual herbage species present (Table 9 and Moloney et al., 2020a), the consistent absence of a significant interaction between herbage species mixture and rate of inorganic N applied indicates that species mixture effects on herbage ensilability, silage fermentation, conservation loss and silage nutritive value traits behaved similarly at both rates of inorganic N.
With the exception of Mix 2/0N at Cut 1, both sward species mixtures exhibited lower fermentation coefficients than the threshold value of 35 identified by Weissbach & Honig (1996) as being necessary to exceed in order to ensure successful preservation of ensiled unwilted herbage. The values at Cut 3 therefore appeared particularly challenging. Overall, the low values reflect the effects of the lower coefficients for legume and herb functional groups compared with grasses, as shown in Table 9. In addition, where inorganic N was applied it is likely that this had an effect of reducing WSCaq and increasing buffering capacity values for the grass species present (Keating & O’Kiely, 2000a; Conaghan et al., 2012; Clavin et al., 2017), and this would have largely cancelled the simultaneous reduction in the proportion of the non-grass functional groups present. The similar fermentation coefficients for the two sward species mixture treatments was a product of there being no significant differences between them in WSCaq or buffering capacity values at any cut. This, in turn, indicates that the replacement of white clover (8–30% of biomass; mean fermentation coefficient of 24) by herbs (12–30% of biomass; mean fermentation coefficient of 30) did not measurably impact the fermentation coefficient. It is noteworthy that within each functional group the fermentation coefficients for the two constituent species were generally comparably high (both grasses) or low (both legumes and both herbs).
Mean chemical composition of individual species within Mix 1 and Mix 2 at Cuts 1–3 pre-ensiling
| Species |
| Perennial ryegrass1
| Timothy2
| Red clover2
| White clover2
| Ribwort plantain2
| Chicory2
|
|---|---|---|---|---|---|---|---|
| Cut | |||||||
| WSCaq 3 | 1 | 24 | 61 | 22 | 21 | 16 | 14 |
| 2 | 55 | 28 | 19 | 12 | 24 | 25 | |
| 3 | 28 | 50 | 23 | 18 | 31 | 33 | |
| Buffering capacity4 | 1 | 265 | 264 | 544 | 526 | 381 | 469 |
| 2 | 317 | 261 | 589 | 557 | 467 | 473 | |
| 3 | 456 | 338 | 649 | 582 | 473 | 513 | |
| WSC5 | 1 | 131 | 177 | 120 | 120 | 110 | 117 |
| 2 | 216 | 102 | 89 | 73 | 91 | 128 | |
| 3 | 140 | 136 | 100 | 105 | 109 | 166 | |
| DM5 | 1 | 152 | 257 | 152 | 150 | 125 | 107 |
| 2 | 203 | 213 | 180 | 139 | 206 | 161 | |
| 3 | 168 | 267 | 184 | 145 | 220 | 165 | |
| Fermentation coefficient6 | 1 | 42 | 62 | 27 | 27 | 28 | 24 |
| 2 | 58 | 43 | 26 | 21 | 31 | 31 | |
| 3 | 33 | 48 | 27 | 24 | 34 | 34 | |
WSC = water-soluble carbohydrates; WSCaq = water-soluble carbohydrates (aqueous phase basis).
1Samples were taken from monoculture of diploid perennial ryegrass with an intermediate heading date, grown with 120 kg N/ha per year (Moloney et al., 2020a).
2Samples were taken from Mix 1 and Mix 2 receiving 120 kg N/ha per year (Moloney et al., 2020a).
3g/L.
4mEq/kg DM.
5g/kg.
Both Pahlow et al. (2003) and Clavin et al. (2017) suggested that the ensilability index thresholds that would indicate a likelihood of satisfactory silage preservation appear to differ for grasses and legumes. In the case of red clover, for example, Clavin et al. (2017) proposed explanations for its better than expected preservation such as a greater quantity of fermentable substrate being available than measured in WSC, the beneficial effects it derives from polyphenol oxidase and a lower water activity compared with grass of the same DM content.
As the herbage from both sward species mixture treatments had similar pre-ensilage DMD and CP values and both treatments underwent similar DM recovery rates and standards of preservation during ensilage, the generally similar DMD and CP of their silages were to be expected. This outcome for DMD also agrees with the finding that the pre-ensilage DMD of white clover was intermediate between that of ribwort plantain and chicory (799 vs. 694 and 832 g/kg, respectively; Moloney et al., 2020a) such that replacing this legume by the two herbs caused no net change in value. However, this rationale does not explain the similar CP for Mix 1 and Mix 2 silages as the pre-ensilage values for white clover, ribwort plantain and chicory were 233, 134 and 153 g/kg DM, respectively (Moloney et al. 2020a).
Practical implications
Numerous factors such as annual and seasonal herbage yield and nutritive value, and sward persistence, impact on the suitability of different herbage species and cultivars in grassland swards managed for silage production. Other studies from the project with which this experiment is associated have examined these factors (Moloney et al., 2020a; 2020b). The current study demonstrates that under favourable ensiling conditions (e.g. Cut 2) unwilted grass-red clover binary mixtures and multi-species mixtures can preserve satisfactorily as silage, comparable to a perennial ryegrass monoculture receiving inorganic N fertiliser. However, when ensiled under more challenging crop conditions (e.g. Cut 3), it appears the binary mixtures and multi-species mixture swards have a greater requirement for an adequate rapid wilt and/or sufficient effective preservative to be evenly applied. Future research should quantify the ease of successfully wilting binary mixture and multi-species mixture swards under practical field conditions, as well as quantifying conservation losses in the field and during ensilage/feedout, and conservation efficiency responses to contrasting additives. Furthermore, the energy and protein values of efficiently conserved silages and the corresponding effects on performance and meat or milk quality should be assessed with appropriate ruminants.
The results of this study suggest that the thresholds of herbage ensilability indices developed to predict the relative ease of successfully preserving grass as silage will need to be adjusted for mixtures containing species from outside of the grass functional group.
Conclusions
Estimation of the ensilability of binary mixtures and the preservation of their resultant silages need to be based on direct analysis of representative binary mixture samples rather than being predicted from measured values for the component species when in monoculture. A major factor impacting negatively on the silage preservation challenge for any of the binary mixtures was the proportion of red clover present.
The broadly similar herbage ensilability and silage fermentation characteristics of PRG/RC, Mix 1/0N and Mix 2/0N suggest that the inclusion of timothy and white clover with perennial ryegrass and red clover (PRG/RC vs. Mix 1/0N) or the replacement of white clover by ribwort plantain and chicory (Mix 1/0N vs. Mix 2/0N) did not negatively affect these traits. There was a trend under difficult ensiling conditions, however, for the reference treatment PRG/360N to be somewhat less difficult to preserve than PRG/RC, Mix 1/0N and Mix 2/0N. This same trend was evident when comparing PRG/360N to Mix 1/360N and Mix 2/360N.
Despite the application of inorganic N to Mix 1 and Mix 2 markedly increasing their grass contents and correspondingly reducing their legume contents, this had relatively little impact on herbage ensilability or silage preservation characteristics. This appeared to be due to expected positive impacts of a reduction in the content of legumes being cancelled by corresponding negative impacts of inorganic N on grass ensilability and on its resultant fermentation during ensilage.