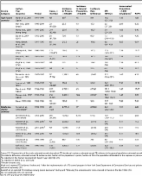
Introduction Occurrence of active tuberculosis (TB) in prisons is usually reported to be much higher than the average levels reported for the corresponding general population [1],[2]. In prisons located in developing countries TB has been reported as the most common cause of death [3]. High levels of TB in prison populations are likely to be attributable to the fact that a disproportionate number of prisoners are from population groups already at high risk of TB infection and TB disease (for example, alcohol or drug users, homeless people, mentally ill individuals, former prisoners, and illegal immigrants from areas characterized by high TB prevalence). Furthermore, the prison setting, where segregation criteria are based on crime characteristics rather than on public health concerns, may facilitate transmission. In addition, overcrowding, late case detection, inadequate treatment of infectious cases, high turnover of prisoners, and poor implementation of TB infection control measures are all known factors contributing to transmission of Mycobacterium tuberculosis. Finally, prisoners may be at risk of rapid progression of latent TB infection (LTBI) to TB disease following recent infection or reactivation of latent infection through coexisting pathology, particularly HIV infection, intravenous drug use, and poor nutritional status [3],[4]. Moreover, prisons represent a reservoir for disease transmission to the community at large; the TB infection may spread into the general population through prison staff, visitors, and close contacts of released prisoners [5]. The transmission dynamics between prisoners and the general population has been hypothesized to play a key role in driving overall population-level TB incidence, prevalence, and mortality rates [4]. Overlooking TB prevention and control in prisons settings can carry serious consequences for both prisoners and the general community, in particular in those countries where poor TB control, lack of TB infection control measures, and incarceration rates are high [3]. The main objectives of the present study were to assess, by reviewing the published literature, the consequences of within-prison spread of TB, estimating the relative risk and risk difference for incident latent TB infection (LTBI) and TB disease in prisons worldwide, as compared to the incidence in the corresponding local general population and the fraction (percent) of LTBI and TB in the general population attributable (PAF%) to the exposure in prisons. The aim of this study is to provide relative and absolute estimates of the risk of TB associated with incarceration, and of the potential impact of specific preventive measures to control TB transmission in the prison setting. Methods Search Strategy An initial search of the available literature for systematic reviews or meta-analyses reporting estimates of the occurrence of LTBI and TB incidence in prisons did not identify potentially relevant studies. Details on the search strategy adopted to identify original primary studies in English, French, Italian, Spanish, Portuguese, or Russian, published since January 1980 through June 2010, and reporting data on the incidence of LTBI and TB in prisons, are reported in Text S2. Study Selection The PRISMA checklist is in Text S1. Studies were eligible for inclusion if they reported the incidence of LTBI and TB disease in prisons or if they reported the number of incident LTBI and TB cases identified in the study along with the overall number of inmates or prison personnel investigated or the person-years of follow-up. LTBI incidence has been defined as tuberculin conversion, that is newly positive tuberculin skin test (TST) after a documented negative-baseline TST as reported in the original study [6]. For TB disease incident cases we included both definitive (microbiologically confirmed) and presumptive (based on clinical, imaging, or pathology criteria) diagnoses. In order to include studies of comparable quality, we considered only data published in peer-reviewed journals. Thus data from unpublished literature, such as Ministry of Health or Justice reports, were not included. We excluded studies with the following characteristics: (1) reporting only case series; (2) reporting only outbreak investigations; (3) reporting only prevalence of LTBI and TB in prisons; (4) reporting investigations targeted only to multi-drug resistant TB, (5) case-control studies, (6) those starting before 1980. All duplicate citations were eliminated from the initial database. Three reviewers screened these citations by reviewing titles and abstracts to identify potentially relevant studies. Disagreements between the reviewers were resolved by consensus. The database was then screened again to include only primary research articles, and the full text of each citation was obtained and reviewed. Data Extraction A data extraction form was designed by three reviewers, then all the papers were independently reviewed and data extraction was cross-checked. Disagreements between the reviewers were resolved by consensus. The following datasets were collected from each study: country where the study was performed, study period, incidence of LTBI/TB and corresponding confidence intervals and/or the number of incident LTBI and TB cases identified, and the overall number of inmates or prison personnel investigated or the person-years of follow-up, and if reported the incidence of LTBI and/or TB in a comparison group, such as the local general population or prison administrative workers not exposed to TB in the setting under investigation. To estimate TB incidence among the general populations in the host countries, we used estimates provided by the WHO for the corresponding study period (WHO Global Health Atlas [7]). To estimate LTBI incidence among the general populations in the host countries, we used estimates provided in the original papers or, alternatively, as reported in the literature. Data Analysis For each study the incidence rate ratio (IRR) for LTBI and TB in prison compared to the incidence in the general population was calculated. The presence of heterogeneity across studies was assessed by the conventional chi-squared test for heterogeneity (we regarded a p-level below 0.05 as indicating significant heterogeneity in the data), and by calculating the I 2 statistic, which accounts for the number of studies included in the meta-analysis and provides a direct measure of the variability not explained by the information included in the analysis [8]. We used STATA version 9.2 (StataCorp, College Station, TX, USA) software for statistical analysis. In order to assess the fraction of LTBI or TB in the population attributable to the exposure to prison settings, we calculated the population attributable fraction percent (PAF%) using Levin's formula [9] , where IRR is the LTBI or TB IRR measured from each study and Pe is the proportion of the population in prisons as given in the Human Development Report (year 2007/08) [10]. Other sources of information provide slightly different figures, for example those reported by the “International Centre for Prison Studies” of the King's College in London [11] are usually slightly higher than those reported by the United Nations [10]; however, the data from the two sources are consistent. To investigate possible sources of heterogeneity, we stratified the analysis according to income of the population in which the study was conducted. In particular, we defined two strata, high- and middle/low-income countries as classified by the World Bank [12]. Furthermore, to investigate potential sources of heterogeneity, we tested, by means of univariate meta-regression analyses, the possible effect of between-study variance of overcrowding, presence/absence of ventilation systems, strategies of isolation of suspected TB cases, and TST testing at entry as reported in each study. We also tested the effect of study quality, which was assessed using the Newcastle-Ottawa scoring scale for cohort studies [13]. In brief, the quality of the studies was assessed considering the definition and representativeness of the cohort of inmates or prison personnel, the diagnostic criteria for cases of active TB, and the comparability of the cohorts on the basis of the study design or analysis. Results The study selection process is shown in Figure 1. We identified 582 potentially relevant unique citations from all literature searches. From 256 original primary studies, 23 studies [14]–[36] were included, accounting overall for 670 cases of LTBI with 31,404 person-years of follow-up and for 1,710 cases of TB with 512,780 person-years of follow-up. Steenland et al. reported LTBI cases among prison personnel separately, according to their “high” or “low” risk of being exposed to inmate cases of TB cases [30]; Russkikh et al. reported TB incidence among prison personnel in Udmurt Republic (Russian Federation) during and following the socioeconomic crisis that occurred in Russia in the late 1990s [35]; whereas Klopf et al. reported TB incidence rates before and after the implementation of a TB control program in New York State Department of Correctional Services, separately [21]. We kept these distinctions in our analyses. None of the selected studies reported data from short-term correctional facilities. 10.1371/journal.pmed.1000381.g001 Figure 1 Flow diagram for study selection. The median number of cases per study of LTBI in prisons was 86 (interquartile range [IQR]: 49–169) and 68 for TB (IQR: 23–214), while the median number of person-years of follow-up in each study was 8,027 (IQR: 1,027–9,746) for LTBI and 13,869 (IQR: 3,927–81,759) for TB. For studies reporting LTBI data collected since 1991, five studies were from the US (high-income country) and one study was from Brazil (middle-income country). For studies reporting TB data collected since 1981, 13 studies were from high-income countries, six studies were from countries with an estimated middle/low-income [16],[22],[29]. The geographic distribution of studies reporting TB incidence was more heterogeneous. Tables 1 and 2 summarize the findings of the six and 19 studies that reported LTBI and TB incident cases in prisons, respectively. In particular, for each study included in the review, we have reported the period under investigation, the number of LTBI or TB cases and the person-years at risk, the LTBI or TB incidence for the comparison group representing the local general population, the estimated rate difference, the estimated IRR with the corresponding 95% confidence intervals (95%CIs), the incarcerated population (per 1,000 inhabitants), and the estimated PAF%. 10.1371/journal.pmed.1000381.t001 Table 1 Studies reporting LTBI incidence in prisons. Author, Year(Country) Period Cases, n(At Risk) Incidence in Prisons, % Incidence in General Population, %a Incidence Rate Difference IRR(95%CI) Incarcerated Population, ×1,000 Inhabitantsb PAF% Ferreira et al., 1996 (Brazil) 1992–1993 21 (68) 30.9 0.5 30.4 61.76 (40.27–94.73) 1.91 10.4 Hung et al., 2003 (USA) 2000–2001 49 (9,746) 0.53 0.1 0.43 5.03 (3.8–6.65) 7.38 2.9 Koo et al., 1997 (USA) 1989–1991 130 (2,201) 5.91 0.1 5.81 59.06 (49.74–70.14) 7.38 30.0 MacIntyre et al., 1997 (USA) 1993–1994 86 (1,027) 8.37 0.1 8.27 83.74 (67.79–103.45) 7.38 37.9 Mitchell et al., 2005 (USA) 1999–2000 3 (231) 1.30 0.1 1.20 12.99 (4.19–40.27) 7.38 8.1 Steenland et al., 1997 (USA) (high) 1991–1992 169 (10,104) 1.67 0.1 1.57 16.73 (14.39–19.45) 7.38 10.4 Steenland et al., 1997 (USA) (low) 1991–1992 212 (8,027) 2.64 0.1 2.54 26.41 (23.08–30.22) 7.38 15.8 Characteristics of the study, estimated annual incidence of LTBI in prisons, estimated annual incidence of LTBI in the general population, estimated annual incidence of LTBI difference, estimated annual incidence of LTBI ratio, fraction of the population in prison, fraction of LTBI in the population attributable to the exposure in prisons. a As reported in Menzies et al., 2007 [49]; Steenland et al. reported LTBI cases among prisons personnel separately according to their “high” or “low” risk of being exposed to inmate cases of tuberculosis cases [30]. b As reported in the the Human Development Report (year 2007/08) [47]. 10.1371/journal.pmed.1000381.t002 Table 2 Studies reporting TB incidence in prisons, by income area according to the World Bank classification. Income Category Author, Year(Country) Period Cases, n(At Risk) Incidence in Prisons, ×100,000 Incidence in General Population, ×100,000 Incidence Rate Difference IRR(95%CI) Incarcerated Population, ×1,000 Inhabitants‡ PAF% High-income countries Martin et al., 2001 (Spain) 1991–1999 NR 639† 45 594 14.2(9.2–21.8) 1.45 1.88 Mor et al., 2008 (Israel) 1998–2004 23(91,000) 25.3 10 15.3 2.5(1.7–3.8) 2.09 0.32 Wong et al., 2008 (Hong Kong) 1999–2005 214(82,406) 259.7 76 183.7 3.4(3.0–3.9) 1.68 0.40 Ijaz et al., 2004 (USA) 1992–2000 58(81,759) 70.9 10 60.9 7.1(5.48–9.18) 7.38 4.30 Hanau-Bercot et al., 2000 (France) 1991–1995 68(31,546) 215.5 25 190.6 8.6(6.8–10.9) 0.85 0.64 Valway et al., 1994 (USA) 1990–1992 171(109,475) 156.2 9 147.2 17.3(14.9–20.2) 7.38 10.77 Koo et al., 1997 (USA) 1991–1991 10(5,421) 184.5 17.4 167.1 18.4(9.9–34.3) 7.38 11.41 Klopf et al., 1998 (USA) 1991–1997* NR 225 9 216.0 25.0(NA) 7.38 62.3 Klopf et al., 1998 (USA) 1991–1997** NR 61 9 52.0 6.8(NA) 7.38 30.7 Fernandez de la Hoz et al., 2001 (Spain) 1997–1997 97(7,524) 1,289.2 40 1,249.2 32.2(26.4–39.3) 1.45 4.33 Jones et al., 1999 (USA) 1995–1997 38(13,869) 274.0 8 266.0 34.2(24.9–47.1) 7.38 19.70 March et al., 2000 (Spain) 1994–1996 267(3,927) 6,799.1 45 6,754.1 151.1(134.0–170.3) 1.45 17.87 Chaves et al., 1997 (Spain) 1993–1994 216(9,461) 2,283.1 30.4 2,252.7 75.1(48.8–115.4) 1.45 9.70 Braun, 1989 (USA) 1984–1986 39(36,967) 105.5 9 96.5 11.7(8.6–16.0) 7.38 7.33 Middle/low income countries Ferreira et al., 1996 (Brazil)# 1992–1993 20(720) 2,777. 8 77 2,700.8 36.1(23.3–55.9) 1.91 6.28 de Oliveira et al., 2004 (Brazil) 1993–2000 359(34,344) 1,045.3 67.75 977.5 15.4(13.9–17.1) 1.91 2.68 Russkikh et al., 2007 (Russia) 1996–2000† NR 2,035.3 58.0 1,977.3 35.1(NA) 6.11 17.2 Russkikh et al., 2007 (Russia) 2001–2005‡ NR 1,649.9 71.6 1,578.3 23.0(NA) 6.11 11.9 Pavlov et al., 2003 (Russia) 1998–2000 NR 1,942.8 49.6 1,893.2 39.1(NA) 6.11 18.9 Slavuckij et al, 2002 (Russia) 1998–1998 22(2,500) 880 100 780 8.8(5.8–13.4) 6.11 4.55 Koffi et al., 1997 (Ivory Coast) 1990–1992 108(1,861) 5,803.3 177 5,626.3 32.8(27.1–39.6) 0.49 1.53 Source: [12]. Characteristics of the study, estimated annual tuberculosis (TB) incidence in prisons, estimated annual TB incidence in the general population, estimated annual TB incidence difference, estimated annual TB incidence ratio, fraction of the population in prison, fraction of TB in the population attributable to the exposure in prisons. ‡ As reported in the Human Development Report (year 2007/08) [47]. †: As reported in Martin et al., 2001 [26]. # Female inmates only. Klopf et al. reported TB incidence *before and **after the implementation of a TB control program in New York State Department of Correctional Services and prisons personnel separately [21]. Russkikh et al. reported TB incidence among prison personnel †during and ‡following the socioeconomic crisis occurred in Russia in the late 1990s [35]. NA, not applicable; NR, not reported. The median estimated annual incidence of LTBI in prisons was 2.6% (IQR: 1.3%–8.4%) overall and 2.1% (IQR: 1.3%–5.9%) for studies from the US. The IRR for LTBI was 26.4 (IQR: 13.0–61.8) overall and 21.6 (IQR: 13.0–59.1) for studies from the US. Figure 2 shows the distribution of the IRR for LTBI by income area. 10.1371/journal.pmed.1000381.g002 Figure 2 Forest plot showing the study-specific estimates of the IRRs for LTBI in prisons as compared to corresponding general populations, by income area according to the World Bank classification. Source: [12]. The median estimated annual incidence of TB in prisons was 237.6 per 100,000 persons (IQR: 156–639) for studies from high-income countries and 1,942.8 per 100,000 persons (IQR: 1,045.3–2,777.8) for studies from middle/low-income countries. The median estimated IRR for TB were 17.9 (IQR: 8.6–61) and 32.8 (IQR: 15.4–36.1), respectively. The median difference between annual incidence of LTBI measured in prisons as compared with that measured in the general population was 2.5% (IQR: 1.2%–8.3%). Since all the studies reporting data about LTBI incidence in prisons from high-income countries were from the US, we restricted the analysis of TB incidence to studies from the US, in order to compare incidence ratio ratios for LTBI and TB. The calculated median estimate for TB was 48 (IQR: 24–114.5), which was higher than the IRR of 32 (IQR: 19.6–44.3) found for LTBI, though the distribution of these estimates largely overlapped (see above). Figure 3 shows the distribution of the IRR for TB by income area. 10.1371/journal.pmed.1000381.g003 Figure 3 Forest plot showing the study-specific estimates of the IRR for tuberculosis in prisons as compared to the corresponding general populations, by income area according to the World Bank classification. Source: [12]. NA, not applicable. Finally, using the estimated annual incidence of LTBI and annual TB IRR and the reported population proportion of inmates for each country of interest we estimated the PAF%. The median population in prison (per 1,000 inhabitants) was 4.7 (IQR: 1.4–7.4) for high-income countries and 6.1 (IQR: 1.9–6.1) for middle/low-income countries. The median estimated PAF% for LTBI was 13.1% (IQR: 8.1%–30.0%) for studies from high-income countries (US) and 10.4% for the only study from a middle-income country. The median estimated PAF% for TB was 8.5% (IQR: 1.9%–17.9%) for studies from high-income countries and 6.3% (IQR: 2.7%–17.2%) for studies from middle-low–income countries. Figure 4 shows the PAF% (on a log scale) for TB as a function of both the proportion of population in prison and the IRR between prisoners and general population. As an example, Jones [20] and Koffi [22] reported similar IRRs—34 and 33 respectively—but due to the different proportions of the population that are in prison the estimated PAF% diverge widely (19.7% versus 1.5%). On the other hand, Fernandez de la Hoz and Wong [32] reported from countries with similar proportions of incarcerated population, 1.4 and 1.7 per 1000 population respectively, but the large difference in IRR produces a substantial shift in the estimated PAF% (4% versus 0.4%). 10.1371/journal.pmed.1000381.g004 Figure 4 Contour plot showing the relationship between the proportion of exposed population, IRR, and PAF%. X-axis reports the proportion of the population in prison, Y-axis reports the PAF on a log scale calculated using the Levin's formula [9]. The isoclines represent different levels of IRR. Klopf et al. reported TB incidence *before and **after implementation of a TB control program in New York State Department of Correctional Services and prisons personnel separately.[21] Russkikh et al. reported TB incidence among prison personnel †during and ‡following the socioeconomic crisis occurred in Russia in the late 1990s [35]. The between-study heterogeneity was considerable. In particular, the overall I 2 statistic was 98% (95%CIs: 98%–99%); it was 98% (95%CIs: 97%–98%) for data from high-income countries and 94% (95%CIs: 87%–97%) for data from middle/low-income countries. The heterogeneity did not decrease significantly after stratification by income of the countries. Similarly, accounting in univariate metaregression analyses for overcrowding of the prison setting, presence/absence of ventilation systems, strategies of isolation of suspected TB cases, and TST or TB testing at entry into prison did not show any significant effect on decreasing the between-study variance. However, the IRR estimated from Wong et al. [32], the study with the highest quality scoring, differed significantly from the IRR estimated from studies with the lowest quality scoring. However, no other significant difference was attributable to studies' quality scoring. Discussion In this study we attempt to summarize the published evidence of incidence of both LTBI and TB in prisons. The present systematic review confirms, using peer-reviewed data from both high- and middle/low-income countries, that the risk for TB is at least one order of magnitude greater in prisons than in the general population, as reported by Aerts et al. [37] in a questionnaire-based survey from the WHO European Region. Analogous results have been reported by Zarate et al. [38] in a review summarizing data from international organizations such as the International Committee of the Red Cross and the WHO. The magnitudes of IRR for LTBI and TB estimated in the present systematic review are consistent with each other. Furthermore the finding that the median IRR for LTBI (26.4; IQR: 13.0–61.8) is comparable to that for TB (23.0; IQR: 11.7–36.1) is in line with findings from previous reports and suggests that incident TB cases have a greater impact on subsequent transmission than does importation of LTBI [39]. However, in settings where screening is performed at entry in prison, incident TB cases may represent some LTBI importation. Direct evidence, based on molecular genotyping and drug susceptibility testing, of TB transmission in prisons was recently provided by Matthys et al. [40]. Although in some countries the number of TB cases in prisons represents a relevant proportion of the overall burden of the disease, data on TB in prisons are not always reported to ministries of health [41]. Thus, the TB incidence statistics used for international reporting may be flawed. This underreporting may help to limit a potential bias in our estimates for the IRR (and therefore PAF%), with prisoners being compared to a truly unexposed population; by contrast, if in some countries data from prisons were merged with that of the general population, IRR could have been underestimated. However, those who enter and exit prisons are more likely to belong to population subgroups at a higher risk for LTBI and TB disease than the general population, such as illegal immigrants, hard-to-reach people (such as the homeless), and underserved ethnic-social minorities. A higher risk of transmission outside of the prisons with respect to the general population may lead to an overestimation of IRRs, since a fraction of the transmission occurring within the community would be attributed to the prison setting. The PAF% values given here should be considered estimates of the real impact of transmission of TB within prisons, depicting the two main forces acting on such an impact: the proportion of the population in prison and the role of measures to control transmission. The method adopted to estimate the PAF% was developed to measure the impact on a population of risk factors for noncommunicable diseases [9] and does not account for the transmission dynamics of infectious diseases. In particular, it does not capture the indirect effects of preventive strategies devised to interrupt the chain of disease transmission. Thus, our estimates cannot capture the consequences of introducing TB control measures on transmission dynamics within a prison or between a prison and the local community [1]. Incarcerated people and prison staff can move to different institutions within the judiciary system and to health centers. Plus, prisoners and prison staff have contact with visitors, and prisoners can be freed without a diagnosis or before having completed therapy [3],[41]. As a consequence, not only have prison outbreaks of TB been linked to an increased incidence of TB in local communities, but mass incarceration in Central Asian and Eastern European countries has been associated with the increase of TB rates in the general population [4]. Education on early identification of TB and early case management, screening of inmates at arrival, isolation of cases with positive sputum smears—within the framework of community health services when necessary [5],[42]—all represent potentially effective measures. Their implementation is, however often hampered by resource constraints specific to the prison setting. Nevertheless, emphasis should always be placed on control of TB transmission, especially in periods of growth of prison populations [4]. In high- and middle/low-income countries, the maximum possible reduction of the median TB annual incidence in prisons was estimated to be 187 and 1,893 per 100,000 population, respectively. Although assessing the cost-effectiveness of the introduction of TB transmission control measures is beyond the scope of this paper, such a potential reduction of TB incidence in prisons would make attractive a range of infection control strategies. The PAF% for TB and LTBI in high- and medium/low-income countries ranges from 4.5% to 10.4%; however, figures for high-income countries are driven by data from the US, the country with the largest prison population. Nonetheless, data from the US could provide useful insights into the epidemiology of TB in prisons: The IRRs for LTBI and TB are consistent. Furthermore, data reported by Klopf et al. [21] showed that a reduction of IRR from 25 to 6.8 may have halved the PAF% from 62.3% to 30.7%. Unfortunately, there is a lack of data from Africa and Central Asia, so it is unclear to what extent these findings can be generalized to other countries, with factors such as inadequate nutrition and HIV prevalence [43] possibly playing substantial roles. Limited data from the Russian Federation seem to support our findings. A limitation of the present study is that few reviewed papers stratified the prison population for relevant risk factors such as HIV status. The present findings should be interpreted in the light of some study limitations. The high heterogeneity between studies did not allow a pooled analysis of the data; similar levels of heterogeneity have been observed in other systematic reviews focusing on control of TB transmission and those analyzing observational studies [44],[45]. Such heterogeneity can be due to differences in methodological quality, study design, sampling variability, and study populations across studies. Unfortunately, the meta-regression analyses testing for the potential effect on the between-study heterogeneity of prison overcrowding, implementation of TB infection control interventions, strategies of isolation of suspected TB cases, TST or TB testing upon entry into prison, and study quality scoring did not show any significant role for these factors. In particular, we were unable to account for the duration of time that inmates spend in prisons. Furthermore, we could not account for specific patterns of incarceration, since the classification and organization of detention centers differ between countries. It has been shown that the direct comparison of the TB rates estimated in prisons from the same area but with different characteristics may differ significantly [46]. Furthermore, the best available estimates of LTBI incidence in general population should be regarded cautiously, since they are not drawn from random samples of the population. Meanwhile, information on factors potentially affecting the TST result interpretation such as BCG (bacille Calmette-Guérin) status and nontuberculous mycobacteria distribution in the local population are not available. The PAF% estimates given here rely on a few key assumptions that cannot be assessed directly. The first assumption is that the proportion of the population in prisons as reported by the Human Development Report [47] is reliable and applicable to the specific prison setting investigated in the reviewed studies. The second is that the IRR for TB remains relatively constant over time; in fact, fluctuations of the IRR may occur within a decade or more [48]. In conclusion, these findings provide a detailed summary of the evidence on LTBI and TB risk and incidence in prisons attributable to within-prison spread of TB and make it possible to estimate the impact at a population level. These data may prove useful to inform the development of rational policies to control TB transmission in correctional facilities. Future studies should assess the population attributable risk of prison-to-community spread and describe the conditions in the prison that influence TB transmission. Reporting on the factors potentially affecting the rates of transmission within the different prisons should reduce the heterogeneity of the reported findings and may help us understand the main reasons for the differences in transmission in different settings. Supporting Information Text S1 PRISMA checklist. (0.07 MB DOC) Click here for additional data file. Text S2 Search details. (0.02 MB DOC) Click here for additional data file.