- Record: found
- Abstract: found
- Article: found
Negligible impact of rare autoimmune-locus coding-region variants on missing heritability
research-article

Karen A Hunt
1 ,
Vanisha Mistry
1 ,
Nicholas A Bockett
1 ,
Tariq Ahmad
2 ,
Maria Ban
3 ,
Jonathan N Barker
4 ,
Jeffrey C Barrett
5 ,
Hannah Blackburn
5 ,
Oliver Brand
6 ,
Oliver Burren
7 ,
Francesca Capon
4 ,
Alastair Compston
3 ,
Stephen CL Gough
6 ,
Luke Jostins
8 ,
Yong Kong
9 ,
James C Lee
10 ,
Monkol Lek
11 ,
Daniel G MacArthur
11 ,
John C Mansfield
12 ,
Christopher G Mathew
4 ,
Charles A Mein
13 ,
Muddassar Mirza
4 ,
Sarah Nutland
7 ,
Suna Onengut-Gumuscu
14 ,
Efterpi Papouli
4 ,
Miles Parkes
10 ,
Stephen S. Rich
14 ,
Steven Sawcer
3 ,
Jack Satsangi
15 ,
Matthew J Simmonds
6 ,
Richard C Trembath
16 ,
Neil M Walker
7 ,
Eva Wozniak
13 ,
John A Todd
7 ,
Michael A Simpson
4 ,
Vincent Plagnol
17 ,
David A van Heel
1
22 May 2013
Read this article at

There is no author summary for this article yet. Authors can add summaries to their articles on ScienceOpen to make them more accessible to a non-specialist audience.
Abstract
Genome wide association studies (GWAS) have identified common variants of modest effect
size at hundreds of loci for common autoimmune diseases - however a substantial fraction
of heritability remains unexplained, and to which rare variants may contribute
1,2
. To discover rare variants and test them for association with a phenotype, the majority
of studies re-sequence a small initial sample size and then genotype the discovered
variants in a larger sample set
3-5
. This approach will fail to analyse a large fraction of the rare variants present
in the entire sample set. Here we perform simultaneous amplicon sequencing-based variant
discovery and genotyping for coding exons of 25 GWAS risk genes in 41,911 white-European
origin UK subjects comprising 24,892 subjects with six autoimmune disease phenotypes
and 17,019 controls, and show that rare coding-region variants at known loci play
a negligible role in common autoimmune disease susceptibility. These results do not
support the rare variant - synthetic genome-wide association hypothesis
6
. Many known autoimmune disease risk loci contain multiple independent common and
low frequency variant association signals, and so genes in these loci are a priori
stronger candidates to harbor rare coding-region variants than other genes. Our data
suggest that the missing heritability for common autoimmune diseases may not lie in
the rare coding-region variant portion of the allelic spectrum, but perhaps as others
have proposed in very many common variant signals of weak effect
7-10
.
Recent large scale human sequencing studies have revealed an abundance of rare variants
(which we define as minor allele frequency (MAF)<0.5%), shown that these are geographically
localised, and are more likely to have deleterious functional consequences
11,12
. Nelson et al, in the largest sample size studied to date
12
, resequenced 202 genes in 14,002 people and found ~95% of exonic variants identified
to be rare, with 74% only observed in one or two subjects. More broadly, across ~15,000
genes, similar findings were observed in recent exome sequencing studies of 2,440
and 6,515 subjects
13,14
. Importantly, these studies demonstrate that even if we had reference variation databases
from a million subjects, most of the rare variant allelic spectrum of any given sample
set (e.g. a case-control cohort) will be unique and only identifiable by direct resequencing
of the entire sample set.
There are only a handful of published examples of rare coding-region variants associated
with common autoimmune diseases (although many examples in familial/Mendelian immune-mediated
diseases). Coding-region variants in IFIH1 associated with type 1 diabetes (MAF in
controls 0.67 - 2.2%)3, TYK2 with multiple autoimmune diseases
15
, and IL23R and inflammatory bowel disease
5
, for example, are low frequency (which we define as MAF 0.5 - 5%) rather than particularly
rare. In other examples, the existing evidence for association, and/or the effect
sizes, are relatively weak (e.g. CARD14 & psoriasis
16
, IL2RA/IL2RB and rheumatoid arthritis
17
). The association of rare coding-region variants in CARD15/NOD2 with Crohn’s disease
probably provides the best example, albeit three low frequency variants comprise over
80% of all the disease causing mutations
18
. The majority of studies also lose power (especially for pooled across gene variant
tests) by initially sequencing only a small sample subset rather than testing the
entire rare variant content of a large case-control sample set. We sought to improve
on these methods by performing highly multiplexed sequencing of sufficiently high
quality to enable direct genotyping in the entirety of a large autoimmune disease
case-control collection.
We selected subjects from a single population, individuals of white Northern-European
ethnicity living in the UK (Supplementary Methods), to minimise any effects of population
stratification. We selected to re-sequence all RefSeq exons for 25 genes from 20 GWAS-identified
risk loci showing overlap between six common autoimmune disease phenotypes (autoimmune
thyroid disease, coeliac disease, Crohn’s disease, psoriasis, multiple sclerosis and
type 1 diabetes). All genes studied were from risk loci for at least two phenotypes;
all genes had known immune system function; 18 of 20 loci had either a single candidate
immune gene or all immune genes at a locus were selected (the remaining 2 loci had
partial transcripts of another immune gene within the 0.1cM linkage disequilibrium
block); and all genes & loci were densely genotyped on the Illumina Immunochip (Supplementary
Table 1)
19
. We attempted high throughput sequencing of 52,224 samples (including positive and
negative controls, and repeats). We performed extensive quality control on both samples
and variant calls (Supplementary Methods). The final dataset comprised 41,911 phenotyped
individuals (immune disease cases and controls), with Immunochip array genotypes available
for 32,806 of these individuals (Supplementary Table 2). We discovered 4,377 variant
sites across all amplicons, the genotype call rate was 99.9989% (reference homozygote
as well as non-reference genotypes) across 41,911 individuals. Of these, 2990 variants
were in protein coding regions (including exon splice sites) of the 25 genes (Table
1, Supplementary Table 3); 97.1% of which are rare (MAF in 17,019 controls <0.5%);
73.6% being novel when compared with current published datasets (dbSNP137, 1000 Genomes
Project, NHLBI) containing >6000 individuals, and 67.3% novel compared to an unpublished
dataset of 25,994 exome-sequenced individuals (MacArthur DG, personal communication);
and 68.9% were only seen in one or two individuals. These proportions of novel, and
rare, variants are similar to recent data from other large re-sequencing studies
12
.
Our very high coverage data (99.8% of 183.4m site x sample genotype calls had read
depth≥40, 96.6% read depth>100, Supplementary Figure 1) enabled stringent data filtering
on call rate per sample, per variant site, and other criteria (Supplementary Methods).
To confirm data quality, we performed further experiments and analyses: (a) we genotyped
one control sample 296 times (on different 48-sample microfluidic chips), the genotype
call error rate was 2 non-consensus genotype calls of 1,295,581 called genotypes (0.00015%);
(b) 32,806 of 41,911 subjects also had dense Immunochip genotyping data at the 25
genes, genotype concordance at 91 variant sites genotyped on both platforms was 99.994%;
(c) transition/transversion (Ti/Tv) rates, a quality control measure based on expected
human mutation types, were 2.434 at coding-region variants (2.427 at singletons),
2.44 at rare (MAF<0.5%) variants (2.437 at singletons), and 2.275 at novel variants
(2.273 at singletons)(definitions as Table 1); (d) we selected all (35) nonsense single
nucleotide variants (SNV) and all (39) frameshift indels in the Immunochip genotyped
samples for Sanger sequencing, 2 variants failed assay/PCR design, and there was 1
false positive SNV and 1 false positive indel (overall false positive rate 2.8%).
All 70 validated SNVs and indels had the same alleles in high-throughput and Sanger
sequencing assays; (e) proportions of rare, and of known, variants were similar to
those found by other large sequencing studies, and we identified no common or low
frequency novel variant sites.
We first attempted to identify any low frequency or rare variants of larger effect.
We performed for each coding-region variant and each of 7 phenotypes (including all
autoimmune disease cases combined) a single-variant association analysis. Only previously
reported loci were observed with common variants (MAF>5%), as expected. We identified
three low frequency (MAF 0.5 - 5%) and rare exonic variants (MAF in 17,019 controls
<0.5%) with single SNP association P<10−4 (chosen as a partial Bonferroni multiple
testing correction for 25 genes and 7 phenotypes, but not correcting for all variants
per gene)(Supplementary Table 4, Supplementary Data). We next analysed low frequency
and rare exonic variants, conditioning on common variant non-coding signals at each
locus, and observed no additional association signals (Supplementary Data). An association
between type 1 diabetes and the low frequency UBASH3A SNP rs17114930 was observed,
but conditional regression analysis showed this signal to be secondary to a stronger
common frequency variant/haplotype previously identified by GWAS
20
. We identified novel low frequency (nearly “common” as MAF in 17,019 controls = 4.97%)
NCF2 coding-region variant associations with coeliac disease at two SNPs (rs17849502,
non-synonymous and rs17849501, synonymous; in almost complete linkage disequilibrium
r2=0.992). Both variants were present on the Illumina Immunochip, but just failed
quality control criteria in our previous coeliac disease study due to missing data
19
. We replicated the UK findings in 4,313 coeliac cases and 3,954 controls (European
samples, Supplementary Methods, rs17849502 PCMH=4.46×10⁻⁵, OR 1.35 (95% CI 1.17-1.55)).
Logistic regression analysis conditioning on rs17849502 in the UK resequencing dataset
revealed no further single-variant coeliac disease association signals below P<10−4.
NCF2 is a component of the neutrophil NADPH oxidase respiratory burst complex, different
disease-causing mutations cause the recessive Mendelian phenotype chronic granulomatous
disease. The rs17849502 variant is associated with the autoimmune disease systemic
lupus erythematosus, and rs17849502/H389Q reduces the binding efficiency of NCF2 with
the guanine nucleotide exchange factor Vav1
21
. These data now implicate a disease mechanism of impaired neutrophil function in
coeliac disease, a condition previously thought to be of predominantly B and T cell
mediated immuno-pathogenesis, and where neutrophils may play a role in regulating
adaptive immunity
22
.
We noted that even with ~7,000 cases and ~17,000 controls the power to detect association
signals using single-variant tests for variants (MAF< 0.5%) of modest effect (e.g.
odds ratio <3) is limited (Supplementary Figure 2) and therefore performed gene-based
pooled variant association tests to better detect the combined effect of multiple
variants. We defined coding-region variants as functional candidates if the variants
were rare (MAF in 17,019 controls <0.5%) and predicted to be of potential functional
impact (non-synonymous, premature-stop, splice site altering, see Supplementary Methods).
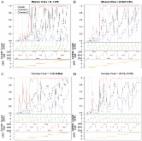
We pooled variants (by gene) in analyses to detect different scenarios (Figure 1,
Supplementary Data), including: C-alpha test which can detect a combination of risk
and protective variants; burden tests to detect either an excess of risk variants
in cases or protective variants in controls; a modified version of the burden test
using conditional regression and common variant non-coding signals at a locus as covariates;
a test to detect an excess of rare variants seen uniquely in cases (the case or control
unique tests being particularly suitable for the study of the large numbers of singletons
and doubleton variants we observe); and a test to detect an excess of rare variants
seen uniquely in controls. The distribution of association statistics for all five
pooled gene tests across each of the 6 or 7 phenotypes tested was consistent with
the global null of no association.
On the basis of these results, in (to the best of our knowledge) the largest human
disease sample sequencing study to date, we find little support for a significant
impact of rare coding-region variants in known risk genes for the autoimmune disease
phenotypes tested. Our data provide little stimulus in support of large scale whole
exome sequencing projects in common autoimmune diseases. Using average genetic effect
estimates from our data (Supplementary Information), over all loci and phenotypes
we have tested, we estimate that rare variants contribute to less than 3% of the heritability
explained by common variants at these known risk loci
23
.
METHODS
Gene selection
All genes studied (listed in Supplementary Table 3) were risk loci for at least two
phenotypes, had a known immune system function, were from loci with only a single
strong candidate immune gene (or all immune genes were selected at four loci - IL18R1/IL18RAP;
CTLA4/CD28/ICOS; IL2/IL21; PTPRK/THEMIS), and all genes & loci were densely genotyped
with all 1000 Genomes pilot project variants on the Illumina Immunochip (for design
of this chip, see ref
19
). Additional criteria favouring locus selection were known multiple independent association
signals; risk (not necessarily same variants/haplotype or signal direction) for many
autoimmune diseases; fine-mapping or other data strongly suggesting a single candidate
gene; and smaller cDNA size,
Samples
UK samples for the six component immune disease phenotypes have been described in
previous publications (which also contain full details of Ethics Committee approvals)
19,20,24-27
, as have the 3 control populations
19,28
. Informed consent was obtained from all subjects. Individuals with self-reported
autoimmune disease were excluded from the UK Blood Services - Common Controls and
NIHR Cambridge Biomedical Research Centre Cambridge BioResource controls. Samples
with self-stated non-white European ethnicity were excluded (later further confirmed
by Immunochip-based principal component ethnicity analysis for 32,806 samples). Samples
with gross discordance with Immunochip genotypes and/or with known gender or genotype
mismatch issues from previous GWAS were excluded. Samples with known duplicates or
relatedness (as distant as first cousins) were excluded, relatedness was later confirmed
by Immunochip genome wide identity-by-state analysis and by analysis of multiple rare
variant sharing in Fluidigm sequencing data. Additional independent European samples
genotyped for rs17849502 (4,313 coeliac cases and 3,954 controls) were previously
described
2
.
Wet-lab
PCR primers were designed for all RefSeq exons of 26 genes, and amplicons selected
to be 150-200bp in size. There was minor primer design dropout at IL18R1, STAT4, THEMIS,
ZMIZ1, although >94% of exon sequence was still covered at these genes. Variant calls
at the gene YDJC later proved unreliable with highly biased allele depths at heterozygote
sites, likely due to the very high exon GC content (~70%), and this gene was not further
analysed nor is it discussed elsewhere in this study. The total length of (overlapping)
amplicons was 95,927bp, with primers removed (still overlapping) 72,612bp, and with
primers removed and unique sequence 58,550 bp. PCR amplification was performed using
50ng gDNA per sample on the 48 sample/plate Fluidigm microfluidic Access Array system.
PCR primers for 511 PCR reactions were pooled up to 13-plex per well in 48 pools.
Individual per sample per pool PCR reactions took place in ~35nl reaction chambers
with ~300 DNA haplocopies/reaction. All pools per sample were combined. Each sample’s
pool was then individually barcoded in a second PCR reaction with one of 1536 10bp
Fluidigm-designed unique barcodes (Fluidigm unidirectional sequencing protocol).
Sequencing
34 libraries (each of 1536 barcoded samples) were generated. Libraries were first
sequenced on an Illumina MiSeq for rapid quality control of the barcoding step, and
to optimise loading concentrations/cluster density. Libraries were then sequenced
one per lane using 101bp paired-end reads and an 11bp index read (the last base of
each read being only used for chemistry cycle phasing purposes) on Illumina HiSeq
sequencers. Lanes were repeated if target cluster density or target clusters passing
filter were not achieved. Individual samples were demultiplexed by Illumina CASAVA
software, allowing zero mismatches per 10bp barcode. Sanger sequencing was performed
on PCR products using an ABI 3730×l DNA analyser and ABI big dye terminator 3.1 cycle
chemistry. We sequenced all samples with rare variant allele genotypes, and a control
sample, for the 74 sites selected.
Bioinformatics
PCR primers were trimmed from the 5′ end of individual reads using a modified version
of btrim
29
. Trimmed sequences were aligned to the GRCh37 human reference genome using gapped
quality-aware alignment, and base call quality recalibration implemented in novoalign
V2.07.18 with settings ‘-t 100 -H -g 65 -x 7 -o FullNW’. Data was realigned against
known (1000 genomes and Mills-Devine 2-hit) indels and per-sample called indels. SNPs
were called using GATK 1.6-5 and settings ‘-- min_base_quality_score 15 -stand_call_conf
30 --baq CALCULATE_AS_NECESSARY -glm SNP --baqGapOpenPenalty 65 -- downsampling_type
BY_SAMPLE --downsample_to_coverage 250’ and then hard filtered using GATK settings
‘QUAL<80.0 DP<20 MQ<40.0 QD<2.0 MQRankSum<-12.5 HRun>5’ (several other recommended
best practice GATK settings were not appropriate for PCR amplicon data), and around
indels. Small indels (up to 15bp gaps from novoalign) were called using GATK and settings
‘--min_base_quality_score 15 -stand_call_conf 30 --baq CALCULATE_AS_NECESSARY -glm
INDEL -- baqGapOpenPenalty 65 --downsampling_type BY_SAMPLE --downsample_to_coverage
250’ and then hard filtered using GATK settings ‘QUAL<80.0 DP<20 QD<2.0’ (several
other recommended best practice GATK settings were not appropriate for PCR amplicon
data). The most important of these settings were likely to be calling genotypes as
missing with sequencing depth <20 high quality bases and the minimum Phred 15 recalibrated
base call quality score to define high quality bases. Both samtools and vcftools software
were also used to process data. SNP genotypes (including non-reference genotypes)
were called at all 58,550 bases of amplicon sequence. Samples with <57,600 SNP genotype
calls (98.4%, a threshold determined by inspection of the call rate plot) were removed
and scheduled for repeat processing. Clusters of very close non-reference genotypes
in an individual sample were removed. Non-reference genotype sites were then identified
across all samples, and vcf-level data reduced to variants at polymorphic sites (in
one or more samples). A combined vcf file of all polymorphic sites and samples was
then loaded into PLINK/SEQ v0.09. Multiple step filtering based on call rate per-sample
and call rate per-variant site was applied, with final requirements >99.95% call rate
per-sample and per-variant site. Lower call rate samples at this stage were also scheduled
for repeat processing. We removed variants if the sum of heterozygote genotype allele
depths was <25% or >75%. The final filtered data was then exported to a vcf file containing
all variants and samples for analysis in R. Immunochip data was loaded into Illumina
GenomeStudio software from .idat files, and all samples called together in GenomeStudio
using the cluster settings as previously described
19
. Data was merged with HapMap Phase 3 genotypes, principal component analysis performed,
and the first two principal components used to validate ethnicity (Supplementary Figure
3).
Barcode and sequencing amplicon performance
Barcode evenness was excellent, with typically 99.0% of the 1536 barcodes producing
pass-filter read numbers which were between 0.033% and 0.13% of the total pass filter
reads per lane (0.065% expected), with most of the failing barcodes tagging known
water negative control samples or (based on repeat amplification with a different
barcode) due to poor DNA quality. Amplicon evenness was good, and for many genotype
calls we required to downsample data to 250 bases per site per sample (Supplementary
Figure 1). However 10 of 511 amplicons effectively failed PCR. In a typical analysis
of 100 high quality samples, 2% of the 58,550 unique amplicon bases had minimum mean
read-depth <20, nearly all accounted for by the 10 failing amplicons.
Variant annotation
Annotation of all variants was first performed using annovar (Feb 2013) and the GENCODE
V14 dataset. Coding variants were identified. Rare functional variants were identified
based on stop, frameshift indel, non-synonymous (SNP or 3n indel) or splice predictions.
We performed an additional layer of annotation for high confidence loss of function
mutations, using the methods described by MacArthur et al
30
. The Variant Effect Predictor (VEP v2.5) tool from Ensembl was modified to produce
custom annotation tags and additional loss of function (LoF) annotations. The additional
LoF annotation was applied to variants which were annotated as STOP_GAINED, SPLICE_DONOR_VARIANT,
SPLICE_ACCEPTOR_VARIANT, and FRAME_SHIFT and flagged if any filters failed. Filters
included LoF is the ancestral allele; Exon is surrounded by non-canonical splice site
(i.e. not AG/GT); LoF removes less than 5% of remaining protein; LoF is rescued by
nearby Start Codon which results in less than 5% of protein truncated; Transcript
only has one coding exon; splice site mutation within intron smaller than 15 bp; Splice
site is non-canonical OR other splice site within same intron is non-canonical; Unable
to determine exon/intron boundaries surrounding variant. A LoF variant is predicted
as high confidence (HC) if there is one transcript that passes all filters, otherwise
it is predicted as low confidence (LC). We noted that LoF mutations were seen in 21
of 25 genes, all were heterozygous genotypes, and mainly (87 of 97) as singletons
or doubletons in the 41,911 samples (Supplementary Table 3).
Statistical analysis
Most analysis was performed in R using custom code (available on request). For tests
using permutations (C-alpha, UNIQ-cases and UNIQ-controls in Figure 1), we randomly
permuted in R the case control status 10,000 times. The unconditional burden test
(Figure 1B) used a Fisher exact text. Conditional burden tests used the glm function
in R, including selected Immunochip common variants as covariates (selection based
on a stepwise regression analysis up to 10−4). For the C-alpha statistic computation
(Figure 1A), the expected proportion of rare alleles in the case/control cohorts was
set to the proportion of cases and controls. Figure 1 was generated using the fact
that under the null of no association −2log(p) is distributed as chi-squared with
2 degrees of freedom. PLINK/SEQ v0.09 (http://atgu.mgh.harvard.edu/plinkseq/index.shtml)
was used for Ti/Tv statistics, and to confirm findings of R analyses (not shown).
We used PLINK/SEQ for the genotype concordance analysis between Immunochip and Fluidigm-sequencing
data. Discordant calls were observed at 169 of 2985255 (0.0056%) genotypes, occurring
at 36 of 91 polymorphic variant sites present in both datasets. We inspected Illumina
Immunochip R theta intensity plots for the discordant genotypes, and observed 8 discordant
genotypes to be likely due to Immunochip data mis-clustering, and 11 discordant genotypes
to be due to a 3rd or 4th observed allele in the high-throughput sequencing data.
At the sites with 3rd and 4th alleles, we note the Immunochip array assays can only
call two alleles, therefore is not possible to determine whether these sequence genotype
calls are real or errors. R code used for analysis is available from V.P.
Estimation of average genetic effect contributed by rare variants
For each combination of locus by disease, we combined all rare functional variants
(frequency < 0.5% in 1,000 Genomes/NHLBI datasets and non-synonymous, LOF or splicing)
in a burden statistic X and computed the combined frequency of X in the sample. Using
a logistic regression model with the disease phenotype as outcome, we estimated the
odds ratio associated with the burden variable X. This knowledge of frequency and
odds ratio for the burden variable X enables the estimation of the average genetic
effect (AGE, as defined by Liu and Leal
23
) version of the variance explained. We then compared this variance at each combination
of locus/gene with the variance explained by what we consider to be a typical common
variant association (odds ratio 1.2, MAF 20%, assuming a single common variant per
locus). To deal with the uncertainty in estimated odds ratio and obtain a confidence
interval for this value, we randomly sampled the odds ratio from their estimated distribution
for each pair of disease/locus. Averaging over the 150 combinations of 6 diseases
by 25 loci, we estimate the ratio of heritability explained for all rare variants
by all common variants to have a mean value of 1.6%, with a confidence interval of
[1.2%-2.3%]. Liu and Leal point out that the AGE estimate can underestimate the true
explained variance by rare variants. Nevertheless, assuming that rare variants are
generally all risk or all protective at a given gene, their simulations also show
that the under-estimation is limited, in the range of a 25% decrease. Taking this
conservative estimate of the under-estimation level, we find the upper bound of the
95% of the confidence interval to be 3.05%. Hence, our data indicate that the aggregate
contribution of rare variants to the heritability (<0.5% MAF, and averaged over these
loci/diseases) is unlikely to exceed approximately 3% of the heritability assigned
to common variants. We acknowledge that a much larger under-estimation (and therefore
a much larger heritability explained for rare variants) is possible in the presence
of a combination of high risk and highly protective rare variants at the same locus.
While we cannot exclude such scenario, it is unlikely to be widespread. We also assumed
in our estimates that rare variants act additively at the log scale. While this assumption
is standard, we cannot exclude that a combination of rare variants results in a much
stronger predictive outcome than rare variants individually, hence under-estimating
the heritability associated with rare variants.
Supplementary Material
1
supporting tables
Related collections
Most cited references15
- Record: found
- Abstract: not found
- Article: not found
Rare and common variants: twenty arguments.
Greg Gibson (2011)
- Record: found
- Abstract: found
- Article: found
Rare Variants Create Synthetic Genome-Wide Associations
Samuel P. Dickson, Kai Wang, Ian D. Krantz … (2010)
- Record: found
- Abstract: found
- Article: not found
Deep resequencing of GWAS loci identifies independent rare variants associated with inflammatory bowel disease
Manuel A. Rivas, Mélissa Beaudoin, Agnès Gardet … (2011)