- Record: found
- Abstract: found
- Article: found
Non-ST-Segment Elevation Myocardial Infarction: A Novel and Robust Approach for Early Detection of Patients at Risk
editorial
Read this article at
There is no author summary for this article yet. Authors can add summaries to their articles on ScienceOpen to make them more accessible to a non-specialist audience.
Abstract
Non-ST-elevation myocardial infarction (NSTEMI) is lower on the severity spectrum
of acute coronary syndromes than is myocardial infarction (MI), resulting from complete
occlusion of a major coronary artery. As the name implies, it is a syndrome that does
not exhibit the dramatic ST elevation observed in the standard 12-lead ECG in chest
pain patients with confirmed acute MI. The important clinical significance of NSTEMI
is that delay in diagnosis can lead to increased morbidity, risk of arrhythmia, and
death. The article Clinical Utility of Ventricular Repolarization Dispersion for Real-Time
Detection of Non-ST Elevation Myocardial Infarction in Emergency Departments in this
issue of the Journal by Al-Zaiti et al1 is a timely presentation of a new approach
to quickly diagnose NSTEMI and significantly reduce the time to treatment in these
patients. The marker, ventricular repolarization dispersion (VRD), incorporates much
more information in the ECG than that provided by measuring elevation of the ST segment
and, thus, heralds the emergence of more powerful and robust methods of assessing
ECG morphology and dynamics than can be provided by classical interval and amplitude
measurements.
Non-ST-Elevation Myocardial Infarction
As the name states, NSTEMI is myocardial infarction in which the elevation—or for
that matter, depression—of ST segments is not significantly different from normal
and thus the reason that the condition is not identified in patients presenting with
chest pain. Typically, chest-pain patients without significantly abnormal ST elevation
are monitored, potentially for hours, until other tests confirm the presence of acute
infarction (eg, elevated troponin levels). There are several explanations that account
for the absence of abnormal ST elevation in acute MI. These include numerous possibilities:
that the infarcts may be relatively small; that the location of the infarcts may be
in locations only weakly sensed by the lead fields of the standard 12-lead ECG; or
that the infarct is slowly developing. Importantly, this does not mean that the QRS
and ST-T waves of the ECG do not change dynamically during the infarct’s time course.
At the cellular level, acute ischemia results in changes in action potential amplitude,
duration, triangularization or sloping of the plateau, and even reduction in action
potential (AP) upstroke velocity in affected cells. Consequently, the ECG shows a
dynamic progression of changes in ST level and slope as well as T wave amplitude and
morphology, in addition to widening of the QRS as a consequence of conduction slowing—all
with different time course and magnitude. In NSTEMI all of these may be present although
much more subtly than in ST-segment myocardial infarction, in which the ST segments
show definitive elevation. Thus, any method that is sensitive to and quantitates these
changes in QRS and ST-T waveform should greatly improve the sensitivity of the test
for infarction as well as drastically reduce the time required to diagnose the syndrome.
Figures1 and 2 show data from an unpublished study investigating depolarization and
repolarization changes induced by coronary occlusion in a canine model of acute ischemia
(Lux RL, unpublished data, NIH SCOR in Sudden Cardiac Death, P50 HL52338, 1994–2005).
Figure1 shows 272 consecutive superimposed beats from an electrogram recorded near
the anterior base of the left ventricle (LV) during atrial pacing (320-ms cycle length)
and in the first minutes after temporarily occluding the left anterior descending
coronary artery (LAD). Note the near identical P, QRS, ST-T complexes in this electrogram.
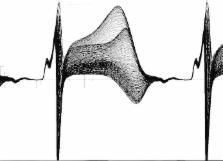
Figure2 shows the exact same beats but at a site 3 cm away and close to the left ventricular
apex. Note the dramatic changes, not only in the ST elevation, but the ST-T and even
QRS morphologies that confirm conduction (activation sequence) as well as repolarization
changes. The point of these figures is that the changes during ischemia, regardless
of how subtle, are regional and include the entire QRS, ST-T intervals. This underscores
the importance of sampling more than a few leads and taking into account the entire
QRST complex.
Figure 1
Two hundred and seventy-two consecutive, superimposed beats from a unipolar electrogram
recorded from the basal LV epicardium during atrial pacing (cycle length=320 ms) immediately
following occlusion of a major branch of the LAD in a canine model of ischemia. LV
indicates left ventricle; LAD, left anterior descending coronary artery.
Figure 2
Superposition of the same sequence of 272 consecutive beats shown in Figure1 but from
a unipolar electrogram positioned 3 cm distant from that in Figure1 and close to the
LV apex. LV indicate left ventricle.
Ventricular Repolarization Dispersion (VRD)
The VRD metric presented in the Al-Zaiti article is based on Principal Component Analysis,
a method closely related to factor analysis and Karhunen-Loeve data representation
methods. These methods provide powerful, robust statistical methods of representing
data of any number of variables or signals in a signal space of orthogonal (independent)
dimensions derived directly from the data itself. Given N ECGs whether N P-QRS-T complexes
from one lead, or N ECGs from different leads, one can calculate a set of independent
(orthogonal) and normalized waveforms (principal components) that characterize the
data from which they were derived. Each waveform has a magnitude (Eigenvalue) associated
with it that signifies the importance of that waveform in representing the data set.
Eigenvalues are ordered by magnitude and for data that are rich in variability (“nonuniform,”
“complex,” etc), and Eigenvalue magnitudes decrease gradually with number. On the
other hand, if there is significant redundancy in the data (eg, the waveforms are
very similar), then only the first few Eigenvalues and associated principal components
are significant.
The VRD metric is, in fact, identical to the complexity ratio published by Priori
et al 2 and is defined as the ratio of the second to first Eigenvalue calculated from
the Principal Component Analysis representation of each beat (QRS-ST-T). The acronym
“VRD” is somewhat misleading given that the index, as defined, includes information
in QRS as well as ST-T. In a normal ECG, there is considerable redundancy in the 12
waveforms, and this results in a low complexity ratio, where the first component carries
a much higher information content than the second, leading to a small ratio. In the
presence of acute ischemia, regional differences in action potential amplitudes and
morphologies produce varying degrees of change across all 12 leads, but particularly
in those leads that are most sensitive to the location of the ischemia. This leads
to an increase in the complexity ratio as the second Eigenvalue will be slightly less
in magnitude than the first. Thus, the magnitude and dynamics of this index over time
are exquisitely sensitive to changes in amplitude and morphology changes of the QRST,
no matter how subtle or in whichever leads.
Interestingly, Principal Component Analysis and related methods have been used to
represent ECGs, body surface potential maps, and QRST integral (ie, area) as means
to diagnose heart disease and assess arrhythmia vulnerability. Horan et al used factor
analysis to statistically characterize the QRS of the ECG.3 Urie et al applied principal
component analysis to QRST integral maps—related to Wilson’s ventricular gradient
4
—to investigate its utility in identifying patients at risk of ventricular arrhythmia.5
Lux et al6 and Evans et al7 used the Karhunen-Loeve expansion to statistically represent
the spatial and temporal information in body surface potential maps and showed the
extent of redundancy in lead systems as well as ECG waveforms and body surface potential
distributions. In each of these examples, the recorded electrocardiographic information—both
waveforms and spatial potential distributions—were reduced to independent variables
that allowed for substantial data reduction and simplification of statistical analysis.
Significance of the Method
The importance of this study is that it shows a significantly higher rate of detecting
NSTEMI than the classical ST-elevation measurement in chest-pain patients with ischemia-related
symptoms. This significantly reduces the time to treatment compared to the “wait and
watch” approach necessitated by the time required to obtain serum enzyme results.
Moreover, in addition to improved rapid detection of NSTEMI, the method shows promise
in identifying NSTEMI patients at high risk for in-hospital major adverse cardiac
events. The simplicity and ease with which the complexity ratio can be calculated
for each beat over extended time periods provides valuable information on the time
course and dynamics of ischemia that better support the diagnosis of NSTEMI than can
be provided by hours of tracking the near-normal ST segments over standard 10-s ECG
snapshots. The fact that the technology required to calculate the metric—both hardware
and software—is already commercially available (Mortara Instruments, Inc, Milwaukee,
WI) points to the potential ease of including this type of analysis in conventional
ECG carts or Holter monitoring systems used in Emergency Departments.
In conclusion, the VRD metric provides a timely, powerful, and robust tool for early
detection of NSTEMI in chest-pain patients and, if adopted, is likely to have a significant
impact on reducing time to treatment and hence morbidity and mortality. Adoption of
this diagnostic tool addresses a present need in a significant patient population.
Disclosures
The author has nothing to disclose.
Related collections
Most cited references5
- Record: found
- Abstract: not found
- Article: not found
PRINCIPAL FACTOR WAVEFORMS OF THE THORACIC QRS COMPLEX.

- Record: found
- Abstract: found
- Article: found
Clinical Utility of Ventricular Repolarization Dispersion for Real-Time Detection of Non-ST Elevation Myocardial Infarction in Emergency Departments
Salah Al-Zaiti, Clifton Callaway, Teri M. Kozik … (2015)
- Record: found
- Abstract: not found
- Article: not found
The electrocardiographic recognition of cardiac states at high risk of ventricular arrhythmias. An experimental study in dogs.
P Urie, M. J. Burgess, R Lux … (1978)