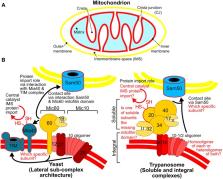
Introduction The compartmentalization of biological reactions is a critical feature of cells across phylogenetic kingdoms and is achieved through membrane-bounded organelles and the lateral organization of continuous cellular membranes. Mitochondria are double membrane-bounded organelles whose diverse functions are highly dependent on their complex structure and organization. Although mitochondrial division, fusion, motility, and positioning mechanisms determine overall mitochondrial shape and distribution in cells, far less is known about how mitochondrial membranes are subcompartmentalized and the mechanisms responsible for generating the complex internal architecture of the organelle. The internal architecture of mitochondria is in part a product of the greater surface area of the mitochondrial inner membrane relative to the outer membrane, especially under respiratory conditions. The inner membrane is differentiated into various regions that are structurally, compositionally, and functionally distinct, and the relative surface area of these different regions determines the overall inner membrane structure (Vogel et al., 2006; Wurm and Jakobs, 2006; Suppanz et al., 2009). Boundary membranes are regions of the inner membrane that are closely connected to the outer membrane. Constituents of boundary regions mediate contact site formation between the outer and inner membranes that facilitate lipid transport, mitochondrial protein import, and respiratory complex assembly (Reichert and Neupert, 2002; Wurm and Jakobs, 2006; Toulmay and Prinz, 2011). Cristae are inner membrane regions that fold into structures that penetrate into the matrix and house assembled respiratory complexes. Cristae are thought to increase the local charge density/pH to enhance ATP synthesis via oxidative phosphorylation (Strauss et al., 2008). Cristae are connected to boundary regions via relatively uniform narrow, tubular structures, termed cristae junctions (Mannella et al., 1994; Perkins et al., 1997; Perkins and Frey, 2000). Cristae junctions function to segregate soluble intermembrane space components from the boundary regions and are restructured during apoptosis to facilitate release of pro-apoptotic intermembrane space proteins such as cytochrome c (Frezza et al., 2006; Perkins et al., 2009). The mechanisms that mediate the lateral organization of mitochondrial outer and inner membranes and determine the ratio of various membrane domains within each membrane are poorly understood. Experimental evidence suggests that mitochondrial inner membrane proteins play important roles in altering membrane shape. Mgm1/OPA1 is a conserved dynamin-related protein (DRP) that catalyzes inner membrane fusion (Meeusen et al., 2006; Song et al., 2007, 2009). Mgm1 mutational analysis indicates that a C-terminal region required for DRP assembly, termed the GED (GTPase effector domain), also plays a central role in cristae structure, but the mechanism is unknown (Meeusen et al., 2006). In mammalian mitochondria, the number of cristae is dramatically decreased if the expression of OPA1 isoforms is altered (Merkwirth and Langer, 2009), and OPA1 functions at cristae junctions to control the release of cytochrome c during apoptosis (Cipolat et al., 2006; Frezza et al., 2006). ATP synthase is a large and relatively abundant complex in the inner membrane. Dimerization of ATP synthase, a process regulated by several factors, and higher order ATP synthase assemblies are also important determinants of inner membrane cristae structure (Paumard et al., 2002; Arselin et al., 2004; García et al., 2006; Campanella et al., 2008; Wagner et al., 2010). The angle created between ATP synthase monomers via the dimerization interface in the membrane-embedded F0 sector may generate and/or stabilize regions of membrane curvature required for the initiation of cristae biogenesis (Minauro-Sanmiguel et al., 2005; Couoh-Cardel et al., 2010). Additional inner membrane proteins, whose mechanisms of action are not as well understood, have also been implicated in the control of mitochondrial membrane structure. Mdm33 is a low copy fungal-specific protein with matrix localized coiled-coil regions that may function to regulate inner membrane division and/or fusion (Messerschmitt et al., 2003). Fcj1/Mitofilin is a relativity abundant conserved coiled-coil protein required for normal mitochondrial inner membrane architecture that may play a direct role in the formation and/or stabilization of cristae junctions (John et al., 2005; Rabl et al., 2009; Mun et al., 2010; Head et al., 2011). Systematic genetic interaction maps consisting of pairwise measurement of growth defects in double mutant cells provide a general strategy for comprehensively exploring gene function (Schuldiner et al., 2005; Kornmann et al., 2009). We reasoned that a genetic interaction map focused on genes encoding mitochondrial proteins would provide critical insights into large-scale questions such as how the physical and functional organization of mitochondria is achieved. Additionally, inclusion of genes encoding nonmitochondrial proteins could provide a unique perspective on molecular avenues that mediate communication between mitochondria and the rest of the cell. Accordingly, we constructed a quantitative genetic interaction map (the MITO-MAP) using genes with mitochondrial functions and with additional diverse functions likely to impact mitochondria. The MITO-MAP revealed an unprecedented level of information regarding the functions of known mitochondrial proteins and how they are integrated with one another. From the MITO-MAP, we also obtained significant insight into several poorly characterized genes, including a highly correlated cluster containing FCJ1/Mitofilin. Our analysis of this cluster revealed a large inner membrane–associated protein complex that serves to specify the organization of the mitochondrial inner membrane through the formation of an extended heterogeneous scaffold-like structure that connects to the outer and inner membranes. Results Overview of the MITO-MAP We measured 616,270 distinct genetic pairwise interactions encompassing a total of 1,482 genes (Tables S1 and S2 and Java Treeview supplemental files). This included 592 genes encoding proteins reported to localize to mitochondria (based largely on proteomic and GFP-localization studies) and 437 genes encoding proteins annotated as acting in the early secretory pathway (Fig. 1 A; Huh et al., 2003; Sickmann et al., 2003). Additionally, we included representative subsets of proteins from a wide range of cellular activities including chromatin, metabolic activities, transcription, translation, cytoskeleton, and signal transduction. The large majority (1,265) of the strains we examined involved complete deletion of nonessential components. We also included compromised (decreased abundance by mRNA perturbation [DAmP] alleles of 217 essential proteins in which the 3′ untranslated region has been deleted, leading to decreased expression levels of the otherwise intact proteins; Schuldiner et al., 2005; Breslow et al., 2008; Table S2). All pairwise mutants were made using the synthetic genetic array marker system developed by C. Boone and others that allows massively parallel, plate-based selection of haploid double mutant products after mating and sporulation (Tong et al., 2001; Schuldiner et al., 2005, 2006). Growth of the double mutants was estimated by automated colony size measurements, which were then used to determine genetic interaction values based on deviations between the observed growth of the double mutant and the value predicted by the growth phenotypes of the two single mutants, assuming the proteins were of unrelated function (Collins et al., 2006, 2010). Figure 1. Generation of the MITO-MAP. (A) Manually defined functional annotations for genes included in the MITO-MAP are summarized in pie charts: 592 genes whose products are predicted to localize to the mitochondria, 437 genes whose products are predicted to localize to the early secretory pathway (ESP), and 529 other genes. Localization groups were based on systematic results with GFP-tagged proteins and GO Slim component annotations. (B) Scatter plot of all full biological replicate genetic interaction score (S-score) measurements for double mutants generated from each of the two possible query-array parent strain combinations. The Pearson correlation for these replicates was 0.65. The MITO-MAP greatly expands, both in quantity and quality, our knowledge of genetic interactions of mitochondrial proteins. There have been several large-scale genetic interaction studies including a recent landmark analysis that covered a sizable fraction of the yeast genome (Costanzo et al., 2010). Nonetheless, no previous effort has been focused on mitochondria, and the majority (57%) of the pairwise interactions measured here were not covered in the previous study. Additionally, for gene pairs measured in both datasets, our data has higher internal reproducibility and agreement with published small-scale genetic interaction studies (Figs. 1 B and S1). A critical test of the quality of genetic interaction maps is the agreement between pairwise genetic interaction measurements when the query and array strains are flipped. This represents a particularly stringent test, as such measurements use independently derived strains measured in distinct experiments often separated by weeks to months. Overall, the Pearson correlation between all such duplicate pairs in our data was 0.65, which is comparable or better than the internal agreement that has been reported in any previous large-scale genetic interaction study (Fig. 1 B). The level of internal agreement reflects both the intrinsic quality of data and the density of genetic interaction seen between the genes present in a given study, complicating comparisons between studies. However, a comparison of pairwise interactions measured in duplicate in the present study and in the Costanzo et al. (2010) study indicates that the internal consistency for this subset of genes was higher in this study (Fig. S1; Pearson correlation of 0.71 vs. 0.39). The singularity of mitochondria Analysis of the MITO-MAP revealed a prominent modularity to organellar function (Fig. 2, A and B). Because of the high density of genes in the MITO-MAP coding for both mitochondrial and early secretory components, our map provides an unprecedented opportunity to explore the functional links between these two disparate but connected aspects of cell biology. There is a strong enrichment of genetic interaction between pairs of genes encoding proteins localized to either the ER or mitochondria (Fig. S2 A). In contrast, synthetic interactions between genes encoding ER and mitochondrial proteins are strongly de-enriched (Fig. S2 A). Furthermore, we explored the overall structure of interactions within and between these two systems by manually annotating the genes in the MITO-MAP according to published evidence supporting their role in particular pathways (Table S2), and computing whether synthetic interactions are enriched between genes pairs acting in each pair of pathways (Fig. 2 A). Enrichment of synthetic interactions between a pair of pathways indicates that mutations in one pathway make the cell increasingly reliant on proper functioning of the other pathway. In contrast, enrichment within a pathway indicates redundancy or parallel subpathways within an annotated pathway. Consistent with earlier studies (Schuldiner et al., 2005), there was considerable substructure to genes acting in the early secretory pathway. For example, protein folding, glycosylation, and trafficking genes showed enrichments for interactions with other components in the same or related pathways. The lipid biosynthetic pathways are of particular interest, as mitochondria and ER cooperate in phosphatidylethanolamine (PE) biosynthesis. Nonetheless, mitochondrial-specific lipid biosynthesis pathways interacted preferentially with mitochondrial localized functions (Fig. 2 B). Indeed, even PSD1, which encodes a mitochondrial-localized enzyme of the PE synthesis pathway, interacts predominantly with genes encoding mitochondrial proteins (Fig. S2 B). However, there are significant interactions between mitochondrial functions, sphingolipid metabolism, and lipid droplets, and, as expected, interactions between fatty acid biosynthesis and carbohydrate catabolism (Fig. 2 B). Figure 2. Structure of genetic interactions within and between mitochondria and the secretory pathway. (A) A heat map of log10 P-values for the enrichment of synthetic genetic interactions (S-score < −3) between genes annotated as functioning in different pathways of the secretory system, mitochondria, or related pathways. Genes were manually assigned a single annotation based on curation of the literature (Table S2). Enrichment P-values were calculated using the binomial distribution as the probability of observing as many or more synthetic interactions between genes with the indicated annotations, given the number of measurements and an expected probability of synthetic interaction that accounts for the overall interaction frequency for each annotation (see Materials and methods for more details). Enrichment P-values were calculated after accounting for the overall frequency of interactions for each annotation. (B) A heat map of enrichments of synthetic interactions (as in A) for the different major branches of the cellular lipid biosynthesis machinery. (C) Genetic connection scatter plot for the average of ERMES component genes MDM10, MDM12, MDM34, and MMM1. The x axis represents the cosine correlation between the mean of ERMES genes interaction scores, and the y axis indicates the mean interaction score between the ERMES genes and each gene in the MITO-MAP. Every point in the scatter plot represents one gene. The cosine correlation values for points corresponding to the selected genes themselves were computed using the mean of the interaction score vectors for the remaining selected genes. In cases where the genetic interaction score was not measured, the point is plotted in gray along the line y = 0. The ER–mitochondria interface Although the MITO-MAP indicates the singularity of mitochondria, one notable exception is the ER–mitochondria encounter structure (ERMES) complex, which is found at the interface between the early secretory pathway and mitochondrial-specific processes (Fig. 2 A). ERMES consists of proteins localized to the ER membrane (Mmm1) and mitochondrial outer membrane (Mdm10, Mdm12, and Mdm34) that interact to create a physical tether (Kornmann et al., 2009). As a tool to give a snapshot of data for one gene (or set of closely related genes) and its connections to all other genes in the MITO-MAP, we created a “genetic connection scatter plot” based on two measures of gene relatedness: the genetic interaction score and the cosine correlation between genetic interaction profiles (Collins et al., 2006). The latter represents a measure of the similarity in the genetic interaction patterns of two genes, which is a measure of their functional similarity. In these plots, the outliers represent genes with the strongest connections. A genetic connection scatter plot for the ERMES components reveals genetic interactions with both the early secretory pathway genes and the mitochondrial portion of the MITO-MAP (Fig. 2 C). Biosynthesis of PE is partially compromised in cells lacking ERMES, which require the transport of phosphatidylserine from the ER to the mitochondrial inner membrane (Kornmann et al., 2009). The negative genetic interaction (i.e., synthetic lethal/synthetic sick phenotypes for double mutants) with genes in the cardiolipin (CL) biosynthesis pathway (CRD1 and GEP4) and the high cosine correlation with PSD1 support the conclusion that ERMES is required for efficient lipid trafficking and the synthesis of PE (Kornmann et al., 2009). Also evident in the plot are strong correlations and positive genetic interactions with genes that encode components of the mitochondrial nucleoid (MGM101, MIP1, and RPO41). This strong correlation suggests that one of the major functions of ERMES is to actively mediate mitochondrial DNA (mtDNA) transmission, an idea consistent with cytological data indicating that ERMES colocalizes selectively with nucleoids engaged in mtDNA replication (Meeusen and Nunnari, 2003). MITO-MAP insights into the organization of mitochondrial functions The MITO-MAP contains many robust clusters of genes with highly similar patterns of genetic interactions. Many of these clusters contain well-characterized mitochondrial protein complexes and functions, which confirms its predictive value, and places several poorly characterized mitochondrial proteins into a functional context. Using genetic connection scatter plots, we highlight several of these, including the prohibitin complex, Ups2-mediated lipid homeostasis, mtDNA maintenance, and mitochondrial dynamics (Fig. S3). We describe the interactions and connections revealed by the MITO-MAP, as well as point out strong candidates for novel complexes and proteins that may play roles in these diverse but connected mitochondrial functions. MITO-MAP reveals a novel Fcj1-containing protein complex that interacts with the mitochondrial outer and inner membranes One robust cluster in the MITO-MAP contained FCJ1 and three poorly characterized genes, previously identified using a computational strategy to uncover genes with altered inheritance of mitochondria: AIM5, AIM13, and AIM37 (Hess et al., 2009). To determine if these proteins physically interact, we constructed strains harboring functional chromosomal C-terminal FLAG-tagged FCJ1 cluster genes, and purified the tagged proteins from crude digitonin-solubilized mitochondrial extracts. We identified interacting proteins using liquid chromatography tandem mass spectrometry (LC-MS/MS) followed by analysis of the number of unique peptides and the percent coverage of detected proteins (Fig. 3 A). As a control, we performed the identical analysis using a wild-type untagged strain. In the purification of Fcj1-FLAG, we identified Aim5 and Aim13, but not Aim37. However, purifications of Aim5-FLAG, Aim13-FLAG, and Aim37-FLAG all contained significant peptides/coverage of each other and Fcj1. From these data, we conclude that Fcj1, Aim5, Aim13, and Aim37 physically interact, as suggested by their genetic interaction profiles in the MITO-MAP. Figure 3. MitOS interacts with both outer and inner mitochondrial membranes. (A) Proteomic analysis of FLAG-tag immunoprecipitations as described in Materials and methods. For each on-bead digest of the indicated FLAG-tag purification or untagged wild type control (top row), the number of peptides (and percent coverage) are shown for each identified protein (left column). Data are represented as the mean ± standard error of three independent experiments. Asterisks indicate data represented as the mean ± standard deviation of two independent experiments. (B) Interdependent protein stability of components of the MitOS complex. The indicated relative amounts of whole-cell extract prepared from the indicated MitOS component FLAG-tag strain were subjected to SDS-PAGE and immunoblotting with α-FLAG, α-Ugo1, and α-G6PDH. (C) Genetic connection scatter plot of the average of MitOS component genes AIM5, AIM13, FCJ1, and AIM37. The x axis represents the cosine correlation between the mean of MitOS genes interaction scores, and the y axis indicates the mean interaction score between MitOS genes and each gene in the MITO-MAP. Every point in the scatter plot represents one gene. The cosine correlation values for points corresponding to the selected genes themselves were computed using the mean of the interaction score vectors for the remaining selected genes. In cases where the genetic interaction score was not measured, the point is plotted in gray along the line y = 0. (D) Genetic interaction scatter plot of the average of genes encoding components of MitOS (x axis) and POR1 (y axis). The x axis represents the mean of the genetic interaction scores of AIM5, AIM13, FCJ1, and AIM37 with each gene in the MITO-MAP, and the y axis indicates the mean interaction score of POR1 and each gene in the MITO-MAP. Significant common negative genetic interactions are highlighted. (E) Proteomic analysis of FLAG-tag immune purifications from cross-linked mitochondria as described in Materials and methods. For each on-bead digest of the indicated FLAG-tag protein or untagged wild-type control (top row), the number of peptides and percent coverage are shown for each identified protein (left column). Data are expressed as the mean ± standard error of three independent experiments. In addition to Fcj1, Aim5, Aim13, and Aim37, the above-described purifications contained significant peptides/coverage of Ycl057c-a (hereafter Ycl057c) and Ygr235c, two poorly characterized proteins that localize to mitochondria based on proteomic analyses (Fig. 3 A; Sickmann et al., 2003). To test whether Ycl057c and Ygr235c are also components of an Fcj1 complex, we created functional FLAG-tagged versions, expressed from their endogenous chromosomal loci, for purification and proteomic analysis. In purifications of Ygr235c-FLAG, a significant representation of all six components was observed, and Aim37 was identified in purifications of Ycl057c-FLAG. Furthermore, the YGR235c genetic interaction profile in the MITO-MAP was similar to the profiles of genes in the FCJ1 cluster, but the interactions were weaker, which is likely the reason it was not observed in the FCJ1 cluster (Fig. S4 A). YCL057c was not included in the MITO-MAP but, consistent with our analysis, C. elegans orthologues of both YCL057c (MOMA-1) and FCJ1 (IMMT-1) were recently identified in a screen for genes that altered mitochondrial morphology, and genetic epistasis analysis suggests that they act in the same pathway by an unknown mechanism to control mitochondrial structure (Head et al., 2011). Additional interacting proteins were also identified by LC-MS/MS, but are not likely to be common core complex constituents, as they were not highly represented and were not observed in purifications of all components. These included mitochondrial outer membrane protein Por1, the inner membrane prohibitin subunits, NADH dehydrogenase Nde1, respiratory chain assembly factors and subunits, and mitochondrial carrier proteins (Table S3). Thus, our proteomic analysis identifies a six-component Fcj1 protein complex. In support of this conclusion, data from quantitative Western analysis of our proposed complex constituents indicated that in Aim5-FLAG purifications, the yield of each adsorbed component was similar (Fig. S4 B). Based on our functional analysis (see the following sections), we term this complex mitochondrial organizing structure (MitOS), and accordingly, we name Ycl057c and Ygr235c as Mos1 and Mos2, respectively. To obtain insight into the architecture of the MitOS complex, we examined the interdependence of steady-state levels of MitOS components by Western analysis of cells expressing FLAG-tagged proteins (Fig. 3 B). The steady-state levels of non-MitOS mitochondrial proteins were not affected in cells lacking individual components of the MitOS complex (unpublished data; Rabl et al., 2009). Deletion of only two MitOS components, FCJ1 and MOS1, significantly affected the steady-state levels of other MitOS components. Specifically, in the absence of Fcj1, the steady-state protein level of Aim13 was decreased ∼50%; and in the absence of Mos1, the steady-state level Aim37 was decreased ∼80%. In contrast, there was no effect on the steady-state levels of MitOS components in Δaim5, Δaim13, Δaim37, or Δmos2 cells. These data suggest that there is a suborganization within the MitOS architecture in which Fcj1 and Mos1 are central. To gain insight into MitOS function, we analyzed genetic interaction data from the MITO-MAP using a genetic connection scatter plot (Fig. 3 C). Cells lacking single components of MitOS displayed mild growth defects on nonfermentable carbon media, with the exception of Δfcj1 and Δmos1 cells, which had significant defects (Fig. S5 A). This observation is consistent with the central roles of Fcj1 and Mos1 in MitOS complex stability (Fig. 3 B). In contrast, strong synthetic growth defects were observed for MitOS genes in the MITO-MAP on fermentable carbon media in combination with deletion of genes required for the biogenesis and homeostasis of the mitochondrial inner membrane (Fig. 3 C). Specifically, negative interactions were observed with genes encoding components of the CL biosynthetic pathway (CRD1 and GEP4), which are important for inner membrane integrity and organization (Schlame et al., 2000; Griparic et al., 2007; Song et al., 2007; Osman et al., 2009; Potting et al., 2010; Acehan et al., 2011) and genes encoding the inner membrane m-AAA-protease, AFG3 and YTA12, which function in inner membrane protein quality control (Arlt et al., 1996; Steglich et al., 1999; Korbel et al., 2004; Duvezin-Caubet et al., 2007). Strong negative interactions were also observed with ERMES complex genes (MDM10, MDM12, MDM34, and MMM1), possibly because of ERMES’s role in ER and mitochondria lipid transport (Kornmann et al., 2009). In addition, the MITO-MAP indicated a close functional relationship between MitOS and the prohibitin complex, as both neutral/slightly positive interactions and high cosine correlations exist between MitOS genes and PHB1/PHB2 (Fig. 3 C). Together, these observations suggest that MitOS functions to control the organization of the inner membrane. MITO-MAP data also pointed to a connection between MitOS and the mitochondrial outer membrane. Specifically, MitOS strongly correlates with TOM70, which encodes a central component of the outer membrane protein import machinery; OM45, which encodes an integral outer membrane protein of unknown function; and POR1, which encodes an outer membrane porin (Fig. 3 C). Shared common genetic interactions for POR1 and MitOS included negative interactions with CRD1, GEP4, MDM10, MDM12, MDM34, MMM1, and GEM1. POR1 also had a strong positive genetic interaction with MitOS genes, the strongest observed between MitOS genes and any other gene in the MITO-MAP (Fig. 3 D). Consistently, Por1 was present in purifications of Aim5-FLAG, Aim13-FLAG, Mos1-FLAG, and Mos2-FLAG (Table S3). To further examine MitOS interactions with the outer and inner membranes, we modified our proteomic approach by using chemical cross-linking to trap less stable physical interactions before solubilization and purification of MitOS components. Under these conditions, OM45 and Por1 were identified as significant components in purifications of Aim5-FLAG, Fcj1-FLAG, and Mos1-FLAG as compared with untagged controls (Fig. 3 E). Additional outer and inner membrane proteins were also identified under these conditions (Fig. 3 E). Together, our genetic and biochemical data indicate that MitOS functions at the interface between mitochondrial outer and inner membranes. MitOS is a conserved complex in the mitochondrial inner membrane Bioinformatic analysis indicated that with the exception of Aim13, MitOS components possess hydrophobic regions, which suggests that they are integral membrane proteins (Fig. 4 A). Fcj1, Aim13, Aim37, and Mos2 also possess regions predicted to form coiled coil structures, which is possibly important for formation of the MitOS complex. Although Aim5 is likely to be fungal specific, all other MitOS components are conserved or possess predicted conserved features (Fig. 4 A). Thus, the structure and function of MitOS is likely conserved. Figure 4. MitOS is a conserved mitochondrial inner membrane–associated complex. (A) Schematic representation of predicted structural features of MitOS components. As described in Materials and methods, the amino acid sequences of MitOS components were subject to bioinformatic analyses to identify conserved features. Fcj1 contains a conserved Mitofilin domain, Mos1 contains a conserved eukaryotic DUF, and Aim37 and Mos2 are both similar to apolipoproteins, predicted to form extended amphipathic α helices (Lamant et al., 2006). Aim13 contains a conserved fungal-specific DUF and a CHCHD-like motif in its C-terminal region, which is marked by two conserved cysteine residues (Cavallaro, 2010). Significantly, a human CHCHD3 protein was reported to be in a complex with Mitofilin isolated from human heart mitochondria (Xie et al., 2007). (B) Protease protection analysis of mitochondria isolated from strains expressing FLAG-tagged versions of MitOS components. Intact mitochondria (lanes 1 and 4), mitoplasts (lane 3), or solubilized mitochondria (lane 2) before treatment with (+) or without (−) trypsin were analyzed by SDS-PAGE and immunoblotting with the indicated antisera. (C) Separation of soluble and membrane proteins by alkaline extraction. Mitochondria were treated with 0.1 M NaCO3 and centrifuged into pellet (P) and soluble (S) fractions, which were analyzed by SDS-PAGE and immunoblotting with the indicated anti-sera. T, total. We tested the submitochondrial localization of the MitOS components by protease protection analysis of FLAG-tagged MitOS proteins in intact mitochondria (Fig. 4 B). Fcj1 has been previously localized to the mitochondrial inner membrane by a single N-terminal transmembrane domain, with its predicted coiled coil region and mitofilin domain in the intermembrane space (John et al., 2005). Western analysis indicated that MitOS components cosediment with mitochondria, which is consistent with proteomic studies (Sickmann et al., 2003). MitOS components were protected from trypsin proteolysis in intact mitochondria, whereas the outer membrane marker, Ugo1, was sensitive (Fig. 4 B, lane 4). However, creation of mitoplasts by selective disruption of the mitochondrial outer membrane rendered tagged MitOS components sensitive to proteolysis, similar to the behavior of intermembrane space marker protein Tim8. In all cases, the matrix marker, Mgm101, remained protected in mitoplasts, and all proteins examined were digested by trypsin when both mitochondrial membranes were solubilized by the addition of Triton X-100 (Fig. 4 B, lanes 3 and 2, respectively). We determined whether MitOS components are integral membrane proteins using alkali extraction of isolated mitochondria followed by centrifugation into supernatant and pellet fractions (Fig. 4 C). Western analysis of alkali extraction fractions indicated that Aim5, Aim37, and Mos1 were quantitatively resistant to carbonate extraction, which is characteristic of bona fide membrane proteins. In contrast, Aim13 was observed only in the supernatant fraction, and therefore, consistent with its primary structure, is a soluble protein. Fcj1 and Mos2, although predicted to be integral membrane proteins, were observed in both the alkali extraction supernatant and pellet fractions. Together, our analyses indicate that MitOS represents a conserved component of the mitochondrial inner membrane with large domains exposed to the intermembrane space. MitOS is required for inner membrane organization Deletion of FCJ1 causes defects in both inner membrane architecture and mitochondrial shape that are strikingly similar to cells that lack factors required for ATP synthase dimerization (Paumard et al., 2002; Arselin et al., 2004; John et al., 2005; Rabl et al., 2009; Mun et al., 2010; Head et al., 2011). Specifically, mitochondria in cells deficient in ATP synthase dimerization possess abnormally long lamellar cristae membranes that stack or wrap in the matrix, often forming onion-like structures, which in turn affects mitochondrial shape (Paumard et al., 2002; Arselin et al., 2004). Although these phenotypes are indistinguishable, FCJ1 deletion does not impair ATP synthase dimerization (Rabl et al., 2009). In fact, it has been reported that loss of Fcj1 stabilizes higher-order ATP synthase superstructure in the form of dimer ribbons (Rabl et al., 2009). These observations indicate that the normal mitochondrial ultrastructure, characterized by many short cristae, requires both ATP synthase dimers and Fcj1 function. To determine if MitOS components function in the Fcj1 pathway of mitochondrial inner membrane structure, we assessed mitochondrial morphology and inner membrane structure in MitOS deletion strains by fluorescent light and thin section EM, respectively (Fig. 5, A and B). We observed a similar defect in mitochondrial morphology in each MitOS deletion strain, as assessed by mitochondrial matrix–targeted GFP (mito-GFP). Specifically, aberrant mitochondrial structures composed of large, lamellar sheets were observed in MitOS deletion strains, which were similar in morphology to that described previously for ATP synthase dimerization mutants (Fig. 5 A, representative images shown). Mitochondrial inner membrane structure was also dramatically altered in MitOS deletion cells, with an observed increase in inner membrane cristae length and increase in cristae stacking and wrapping (Fig. 5 B). Furthermore, we frequently observed highly elongated and thinner mitochondria in MitOS deletion cells (e.g., Δaim37 and Δaim13 in Fig. 5 B), which likely correspond to the large, lamellar sheet regions of mitochondria observed by fluorescence microscopy (compare to Fig. 5 A). We observed less severe mitochondrial morphology defects for Δaim5 and Δmos2 cells, and a significantly less severe cristae phenotype in Δmos2, which suggests that Aim5 and Mos2 may possess a more peripheral and/or redundant role within MitOS. This observation is consistent with biochemical data indicating that the steady-state levels of Aim5 and Mos2 are independent of other MitOS subunits (Fig. 3 B). The similarity of the mitochondrial morphology phenotype among MitOS deletion strains indicates that the components of MitOS function in the same pathway to control mitochondrial structure, in agreement with the similarity of their genetic interaction profiles in the MITO-MAP. Figure 5. MitOS is required for mitochondrial structure. (A) Wild-type and indicated deletion strains expressing matrix-targeted GFP were grown in SD-dextrose and visualized by fluorescent light microscopy. Representative images of each strain are shown. The graph represents quantification of the mitochondrial morphology in the indicated strains. Data are represented as the mean ± standard error (error bars) of three independent experiments characterizing the mitochondrial morphology of ≥75 cells in each replicate. (B) Wild-type and mutant cells were analyzed by thin-section electron microscopy, and representative images of mitochondria are shown. (C) Representative images of cristae junctions (arrows) observed in wild-type and Δfcj1 cells are shown. (D) Quantification of the widths of cristae junctions observed in electron tomograms of wild-type, Δaim5, and Δaim37 cells. Data are represented as the mean ± standard deviation of three independent measurements. Bars: (A) 2 µm; (B) 200 nm; (C) 20 nm. Fcj1 has been proposed to function in cristae junction formation to maintain normal mitochondrial ultrastructure (Rabl et al., 2009). Although cristae junctions were not readily observed in thin section samples of cells lacking Fcj1, upon more extensive sampling, we detected junctions at a reduced density in mitochondria in Δfcj1 and other MitOS component deletion cells (Fig. 5 C and Fig. S4 C). Electron microscopic analysis of MitOS mutant mitochondria in ultrathin sections and by electron tomography did not reveal major alterations in the shape or dimensions of cristae junctions (Fig. 5, C and D and Videos 1–4). Together, these data indicate that MitOS is not essential for cristae junction formation and suggest that junction loss in MitOS deletion strains may be a secondary consequence caused by the formation of abnormally long cristae membranes. Thus, MitOS likely functions primarily through a different mechanism to regulate inner membrane structure and/or cristae junction maintenance. To determine the role of MitOS in the maintenance of normal mitochondrial ultrastructure, we explored its relationship to ATP synthase by examining mitochondrial morphology and ultrastructure in Δfcj1 cells lacking mtDNA (rho0), which lack assembled respiratory chain complexes. Large lamellar mitochondrial regions observed in Δfcj1 rho+ cells were absent in Δfcj1 rho0 cells, whose mitochondria were indistinguishable from wild-type rho0 control cells (Fig. 6 A, top). Significantly, the abnormally long mitochondrial inner membrane/cristae phenotype observed in Δfcj1 rho+ cells was also suppressed in Δfcj1 cells lacking mtDNA (Fig. 6 A, bottom). Indeed, cristae structures were only rarely detectable in either wild-type or Δfcj1 rho0 cells, which indicates the importance of respiratory complexes for inner membrane structure and cristae biogenesis. We also analyzed double mutant Δfcj1Δcbs1, Δfcj1Δmss51, and Δfcj1Δatp10 cells, which are selectively defective in the assembly of respiratory chain complex III (CIII, cytochrome bc1 complex), complex IV (CIV, cytochrome oxidase complex), or the ATP synthase (CV), respectively (Poutre and Fox, 1987; Costanzo and Fox, 1988; Ackerman and Tzagoloff, 1990; Decoster et al., 1990; Tzagoloff et al., 2004; Herrmann and Funes, 2005). Mitochondria in all three single respiratory chain assembly mutants were disorganized, but were not lamellar in structure (Fig. 6 B, top). In contrast, a large proportion of Δfcj1Δcbs1, Δfcj1Δmss51 cells possessed large, lamellar regions in the mitochondrial network, similar to those observed in Δfcj1 (Fig. 6 B, bottom). In contrast, Δfcj1Δatp10 cells possessed a mitochondrial morphology similar to that observed for Δatp10 cells, which indicates that MitOS-dependent mitochondrial morphology defects specifically require assembled ATP synthase. Further support for this comes from the MITO-MAP, in which we observed a highly correlated ATP synthase cluster consisting of three ATP synthase genes, which encode structural components of ATP synthase required for monomer formation: ATP1, ATP5, and ATP12. Consistent with our analysis, MitOS genes had strong genetic interactions with ATP1, ATP5, and ATP12 (Fig. 6 C). Together, our data suggest a model where the presence of ATP synthase dimers drives the formation of normal cristae membranes in a MitOS-dependent manner. Figure 6. MitOS and ATP synthase dimers function in concert to control inner membrane structure. (A) Wild-type and Δfcj1 strains with (rho+) or without (rho0) mtDNA expressing matrix-targeted GFP were visualized by light microscopy (top). Representative images are shown. The graph represents quantification of the mitochondrial morphology of the indicated strains. Data are represented as the mean ± standard error of three independent experiments characterizing the mitochondrial morphology of ≥75 cells in each replicate. Rho0 wild-type and Δfcj1 strains were analyzed by EM as described (bottom). Representative images are shown. (B) Indicated strains expressing matrix-targeted GFP were grown in SD-dextrose and visualized by light microscopy. Representative images are shown. Bar, 2 µm. The graph represents quantification of the observed mitochondrial morphology of the indicated strains. Data are represented as the mean ± standard error of three independent experiments (error bars) characterizing the mitochondrial morphology of ≥75 cells in each replicate. (C) Genetic connection scatter plot generated for ATP1, ATP5, and ATP12 as described in Fig. 2 C. Bars: (A, top) 2 µm; (A, bottom) 200 nm; (B) 2 µm. MitOS forms complex structures on the inner membrane Our data point to MitOS as a major determinant of inner membrane structure and organization. To gain insight into MitOS mechanism, we examined MitOS organization and structure in cells expressing C-terminal MitOS GFP tags. Examination of mitochondrial morphology indicated that among the six MitOS components, only Mos1-GFP was nonfunctional. To delineate the mitochondrial inner membrane, matrix-targeted dsRed (mito-dsRed) was coexpressed and, as expected, labeled relatively uniform mitochondrial tubular structures in cells (Fig. 7 A). In striking contrast, a nonuniform labeling pattern for MitOS-GFP components was observed. Specifically, Fcj1-GFP, Aim13-GFP, and Aim37-GFP formed both discrete punctate and filamentous structures around the inner membrane. In contrast, Aim5-GFP and Mos2-GFP formed filamentous structures that in comparison did not have distinct punctate features (Fig. 7 A). These differences observed in MitOS labeling patterns are consistent with our biochemical and genetic data, which indicate a suborganization within the MitOS architecture (Figs. 3 B and S5 A). To test this idea further, colocalization experiments were performed using cells coexpressing two MitOS components from their chromosomal loci: Fcj1-mCherry and Aim5-GFP, which were chosen because they label apparently distinct punctate and filamentous features of MitOS, respectively. As shown in Fig. 7 B, we observed that Fcj1-mCherry and Aim5-GFP colocalize as expected from proteomic and Western analyses; however, consistent with single label experiments, in many cases we did not observe an enrichment of Aim5-GFP in Fcj1-mCherry–labeled puncta (Fig. 7 B, arrows). Conversely, we observed filamentous regions labeled by Aim5-GFP lacking Fcj1-mCherry signal (Fig. 7 B, double arrowheads). Similar patterns of localization were observed in cells coexpressing chromosomal Fcj1-GFP and Aim5-mCherry, which indicates that the observed labeling patterns were not specific to the fluorescent protein tag (Fig. S5 B). Thus, our data indicate that MitOS components do not form a simple homogenous structure; rather, they interact to build a heterogeneous extended structure within mitochondria. Figure 7. MitOS forms a complex extended scaffold-like structure on the mitochondrial inner membrane. (A) Cells expressing GFP-tagged versions of MitOS components as indicated and mito-dsRed were visualized by light microscopy. Representative images are shown. The boxes indicate the areas shown in the inset. (B) Cells expressing Fcj1-mCherry and Aim5-yeGFP were visualized by light microscopy. Representative images are shown. The boxes indicate the areas shown in the insets. Arrows indicate Fcj1-mCherry puncta. Double arrowheads indicate areas labeled exclusively by Aim5-yeGFP. (C) Rho0 cells expressing GFP-tagged versions of MitOS components as indicated and mito-dsRed were visualized by light microscopy. Representative images are shown. Boxes indicate the areas shown in the inset. Bar, 2 µm. (D) Schematic representation of MitOS localization in mitochondria and its role as an organizer of inner membrane structure. BR, boundary membrane region; CJ, cristae junction; MIM, inner mitochondrial membrane; MOM, outer mitochondrial membrane. Bars, 2 µm. Structures labeled by MitOS components are unusual, as most mitochondrial inner membrane and intermembrane space proteins uniformly label their respective compartments (Wurm and Jakobs, 2006). Given the role of ATP synthase in MitOS-dependent membrane organization, we examined MitOS structures in rho0 cells, which lack assembled ATP synthase. In rho0 cells, the distinct labeling patterns of MitOS components were not significantly changed as compared with rho+ controls (Fig. 7 B). To determine the functional significance of MitOS structures, the pattern of MitOS-GFP–tagged proteins in MitOS deletion cells was examined. In the absence of Fcj1, the localization of Aim13-GFP and Aim37-GFP was significantly less punctate and the distribution of Aim5-GFP was more diffuse as compared with wild-type tagged cells; a similar disruption in organization relative to wild-type tagged cells was observed in Δaim13, Δaim37, Δmos1, and Δmos2 (compare Fig. S5 C with Fig. 7 A). In contrast, the localization pattern of Aim13-GFP, Fcj1-GFP, and Aim37-GFP were unaffected relative to wild-type tagged strains in Δaim5 cells (Fig. S5 D). Together, these cytological data demonstrate that MitOS assembles into a complex extended structure on the inner membrane, which is consistent with predicted coiled coil regions in several MitOS components. The assembly of MitOS structures is independent of respiratory complexes, which indicates that MitOS functions upstream or in parallel with ATP synthase to control mitochondrial inner membrane structure. Discussion The MITO-MAP provides a unique opportunity to explore the functional relationships within mitochondria and between mitochondria and the early secretory pathway. The MITO-MAP reveals a strong singularity of ER and mitochondrial functions and provides an unprecedented level of functional detail. At the interface between ER and mitochondria is the ERMES complex, which the MITO-MAP functionally connects to both phospholipid biosynthesis and mtDNA maintenance (Fig. 2, A and C; Kornmann et al., 2009). The MITO-MAP also illuminates how highly integrated mitochondrial-localized pathways are and provides wide-ranging insight into mitochondrial functions. Using this tool, we identified a cluster of highly correlated genes that encodes a complex scaffold-like structure, which we term MitOS, residing on the intermembrane space side of the mitochondrial inner membrane. Genetic, biochemical and cytological data indicate that MitOS has a defined architecture, with physically and functionally central Fcj1-Aim13 and Mos1-Aim37 subcomplexes and more peripherally associated Aim5 and Mos2 subunits. The complex architecture and function of the inner membrane is dependent on establishing and maintaining distinct membrane domains with specified functions. Our functional analysis indicates that MitOS and ATP synthase dimers act in concert to generate inner membrane structure and consequently normal mitochondrial morphology. ATP synthase dimers reside exclusively in cristae where they form higher order ribbon-like structures, which promote normal cristae morphology (Strauss et al., 2008; Acehan et al., 2011). In contrast, our analysis shows that MitOS proteins form extended heterogeneous structures that circumscribe the inner membrane in a manner independent of respiratory chain complexes. Our data also indicate that MitOS structures are positioned in the intermembrane space, where they form physical and functional contacts with both the outer and inner membranes. These observations suggest that MitOS resides in inner membrane boundary regions. We postulate that the separate and independent localization of MitOS and ATP synthase assemblies to boundary and cristae regions, respectively, serve to create spatially restricted domains, which in turn drive the formation of the distinct internal architecture of mitochondria (Fig. 7 B). Morphologically, MitOS structures have both resolvable punctate and filamentous features, which are reminiscent of the structures formed by the bacterial actin homologue, MreB. MreB provides both structural integrity and a platform for the organization of enzymes required for cell wall synthesis (Shaevitz and Gitai, 2010). We speculate that MitOS might function in a mechanistically analogous manner as a skeletal element in the establishment of inner membrane polarity. Materials and methods Construction of the MITO-MAP An array library of 1,536 strains containing KAN-marked mutations was assembled using strains from the yeast deletion collection (Giaever et al., 2002) and the KAN-marked DAmP strain collection (Breslow et al., 2008). NAT-marked query strains were generated de novo by PCR-based targeted homologous recombination to replace complete open reading frames by the NATMX6 cassette, which confers resistance to Nourseothricin in an S288C-derived MATα starting strain (genotype his3Δ1 leu2Δ0 LYS2+ met15Δ0 ura3Δ0 Δcan1::STE2pr-HIS3 Δlyp1::STE3pr-LEU2) as described previously (Schuldiner et al., 2006). Haploid double mutant strains were generated by crossing NAT-marked query strains with KAN-marked array strains, followed by sporulation and iterative selections on synthetic media selecting for haploids (canavanine and S-2-aminoethyl-l-cysteine [S-AEC], two rounds), haploids with the KAN-marked mutation (canavanine, S-AEC, and G418), and haploid double mutants (canavanine, S-AEC, G418, and Nourseothricin; Collins et al., 2010). All handling of high-density arrays of yeast strains was performed using a RoToR robot (Singer Instruments). Details that are not straightforward from the previous publication are given in the following sections. The arrayed colonies were grown for 48 h in the final selection, and then imaged with a digital camera (Canon PowerShot S3 IS; Collins et al., 2010). Colony sizes were measured using the HT Colony Grid Analyzer Java program (Collins et al., 2006), and genetic interaction scores were computed from the colony sizes using the EMAP toolbox for MATLAB, which includes normalization to account for query and array mutation growth phenotypes, as well as spatial and batch artifacts (Collins et al., 2010). Details that are not straightforward from the previous publication are given in the following sections. Annotation of genes Gene annotations used for the generation of Figs. 1 and 2 are manually curated annotations made for this study based on curation of literature. All annotations are included in Table S2. Map of enrichment of synthetic interactions between pairs of annotations The map of enrichments of synthetic interactions between pairs of annotated pathways (Fig. 2) was done similarly to a previous analysis for the secretory pathway (Schuldiner et al., 2005). Genes were manually assigned a single pathway annotation based on curation of the literature (Table S2). Color intensity in Fig. 2 represents the log10 probability of observing at least the observed number of synthetic interactions (S-score < −3) between pairs of genes with the indicated annotations. The P-values were calculated for each pair of annotations (i and j) using the binomial distribution, given the number of measurements for pairs of genes with the corresponding annotations and an expected probability pexpcted(i,j) of interaction for gene pairs with these annotations. The expected probability accounted for the overall frequency of interactions for genes with each annotation, and it was calculated as: P exp ected ( i , j ) = f i × f j f overall , where fi and fj are the frequencies of synthetic interactions for genes with annotations i and j, and foverall is the overall frequency of synthetic interactions in the entire dataset. Computation of final MITO-MAP interaction scores Because of our experimental design, many mutation pairs were represented by multiple individual genetic interaction measurements (e.g., query strain ΔgeneA crossed with array strain ΔgeneB and query strain ΔgeneB crossed with array strain ΔgeneA both give measurements for the ΔgeneA ΔgeneB double mutant; additionally, several query strains were run more than once, and a small number of array strains were present in more than one location on the array). Additionally, measurements for several gene pairs were also present in previously published EMAP datasets (Schuldiner et al., 2005; Collins et al., 2007; Wilmes et al., 2008; Fiedler et al., 2009; Aguilar et al., 2010; Zheng et al., 2010). To get our best estimate of the interaction for each pair of mutations in our map, we computed a final averaged interaction score as the mean of all individual query-array measurements for that pair of mutations over all EMAP datasets. If only one measurement was present, we performed a psuedo-averaging as described previously (Collins et al., 2006, 2010). This pseudo-averaging is the mean of the single observed measurement, and the median repeat score for mutation pairs with a similar first measurement. We also noticed that the magnitude of scores from our current dataset was larger than the magnitude in previous datasets. To merge the data, and for comparability, before merging and averaging the data, we scaled the scores in our current set multiplicatively by a factor of 0.62. This factor was determined by comparing the median absolute value of scores for mutation pairs measured both in the new dataset and in old datasets. The difference in score magnitude may result from the use of new robotic equipment (RoToR robot) and higher density strain arrays (1,536 vs. 384) in this work. The resulting final dataset consists of a symmetric 1,487 × 1,487 matrix containing scores for all mutation pairs included in this study for which we have measurements. Mutation pairs with no measurements are missing values. The entire dataset is included in Table S1 as a rectangular 1,487 × 481 matrix, which contains all the nonmissing data points in the full matrix. In the rectangular matrix, the 481 mutation dimension corresponds to the 481 mutations included as query strains in this study. The 1,487 mutation dimension includes all mutations in this study. Additional details concerning normalization of colony sizes and computation of individual query-array pair interaction scores A difficulty in large-scale genetic interaction experiments is that subtle differences in media preparation or other factors that may change over time can create systematic artifacts that differentially affect scores calculated for screens done at different times. To minimize the effects of such artifacts, screens completed at approximately the same time were grouped together and annotated as belonging to a common batch. Scores were computed separately for each batch, and the scores were then merged into a common dataset (Collins et al., 2010). Similarly, we noticed two subgroups of the array strain set that exhibited unusual behavior. This was an issue that had not been apparent in our previous genetic interaction studies. However, to avoid potential artifacts from these sets, the colony size measurements for each subgroup were multiplicatively normalized to make their medians equal to that of the rest of the array for each screen. One subgroup consisted of approximately half (124 out of 249) of the DAmP strains in the array, which exhibited subtle co-correlation in colony sizes and synthetic lethal interactions with RVS167. As the DAmP strains were constructed in a diploid background, and then sporulated to yield haploid mutant strains, we suspect that a secondary mutation may have been present in the parent strain, which was then inherited randomly in 50% of the resulting haploid strains. As a cautionary measure, all DAmP × RVS167 data points were also removed. The second subgroup consisted of a set of 263 strains that exhibited similar co-correlation in colony sizes and decreased growth on glycerol media. The strains in each of these subgroups are indicated in Table S1. Comparison of MITO-MAP data with the Costanzo et al. (2010) dataset We report genetic interaction measurements for 616,742 distinct pairs of mutations in this work. Of those, 354,410 (∼57%) were not present in the dataset of Costanzo et al. (2010), and 262,332 were analyzed in both studies. We used two methods to assess the accuracy of the datasets. The first was internal consistency for independent measurements of the same pairs of mutations. Because different sets of genes may have different frequencies of interactions or different sources of biological noise, it is important to use an identical set of pairs of mutations for comparison. For 5,616 mutation pairs, both studies include two measurements of the genetic interaction from independently constructed (query ΔgeneA cross array ΔgeneB and query ΔgeneB cross array ΔgeneA) “marker-swapped” double mutant strains. These common duplicate measurements were used for the comparisons in Fig. S1 (A–C). In some cases, additional measurements were present in our dataset. In these cases, the first measurement for each double mutant construction method was arbitrarily chosen (i.e., the first instance of query ΔgeneA cross array ΔgeneB, and, separately, the first instance of query ΔgeneB cross array ΔgeneA). Using other selection criteria in these cases gave almost identical results. A second method for estimating accuracy is comparison with previously published results. In this regard, we defined a reference set of synthetic genetic interactions from the BioGRID database (Reguly et al., 2006). The Saccharomyces cerevisiae release 3.1.72 was downloaded. The set of interactions annotated as “phenotypic enhancement,” “synthetic growth defect,” or “synthetic lethality” was taken as the reference set. For comparison, a maximal set of mutation pairs with genetic interaction measurements in each study was used so that the comparisons were done using data for an identical set of mutation pairs and an identical reference set for each study. Plots of recall versus precision were generated to measure the performance of each dataset in recapitulating the reference set. Yeast strains generation and manipulation Gene deletions were generated by PCR-based targeted homologous recombination replacing complete open reading frames by the HIS3MX6 cassette (Longtine et al., 1998). C-terminally tagged strains were constructed by PCR-based targeted homologous recombination using the GFP (S65T)-KanMX6, GFP (S65T)-HIS3MX6, or 3XFLAG-HIS3MX6 cassette. In brief, the PCR products were transformed into wild-type W303 haploids by the lithium acetate method, and transformants were plated on appropriate synthetic deficient media or YPD + 300 µg/ml Geneticin (Invitrogen) to select for the homologous recombination event. Colonies were screened first by PCR for integration of the cassette and then by whole-cell extract and SDS-PAGE and Western blotting to confirm expression of the C-terminally tagged alleles of the components of MitOS. Haploid double knockout and MitOS-FLAG/mitos knockout strains were generated by crossing, followed by sporulation or by PCR-based targeted homologous recombination. Cells were made rho0 by incubating in YPD with 25 µg/ml ethidium bromide for 48 h. For analysis of growth by serial dilution, cells were grown overnight in SD-glycerol, washed in water, and resuspended in water at a concentration of 0.5 OD 600/ml, and 10-fold serial dilutions were performed. Cells were spotted onto SD-dextrose or SD-glycerol plates and grown at 30°C. Proteomic analysis Mitochondria preparation. Strains were grown in YPEG or YPD, harvested, resuspended in NMIB (0.6 M sorbitol, 5 mM MgCl2, 50 mM KCl, 100 mM KOAc, and 20 mM Hepes, pH 7.4) with protease inhibitors (1× Calbiochem Protease Inhibitor Cocktail I [EMD]) and 1 mM PMSF [Sigma-Aldrich]). Cells were frozen as pellets in N2(l) and processed in a Spex SamplePrep 6750 freezer mill (Spex). Cell powder was thawed, an equal volume of NMIB with protease inhibitors was added, and mitochondria were isolated by differential centrifugation. Immunoaffinity purifications. Mitochondria from FLAG-tagged strains or an untagged W303 control were lysed in immunoprecipitation buffer (50 mM Tris, pH 7.5, 150 mM NaCl, 2.5 mM EDTA, and 1% digitonin) with protease inhibitors at 1 mg/ml on ice for 30 min and cleared, then the supernatant was incubated with 3 µg anti-FLAG antibody (Sigma-Aldrich) and 50 µl µMACS protein G beads (Miltenyi Biotec Inc.) on ice for 30 min. The beads were isolated using Miltenyi µ columns and a µMACS separator (Miltenyi Biotec), washed three times with wash buffer (50 mM Tris, pH 7.5, 150 mM NaCl, 2.5 mM EDTA, and 0.01% digitonin) with protease inhibitors, and washed twice with immunoprecipitation buffer containing no digitonin or protease inhibitors. On-bead trypsin digestion was performed essentially as described previously (Hubner et al., 2010). In brief, beads were incubated for 30 min at room temperature in 25 µl elution buffer I (2 M urea; 50 mM Tris, pH 7.5, 1 mM DTT, and 5 µg/ml trypsin). This was followed by 2–50 µl applications of elution buffer II (2 M urea; 50 mM Tris, pH 7.5, and 5 mM chloroacetamide). Elutions were collected and digestion was allowed to continue at room temperature overnight. Reactions were stopped with 1 µl trifluoroacetic acid (TFA). Mass spectrometry. Peptides samples were submitted to the Genome Center Proteomics Core at the University of California, Davis, for mass spectrometry (LC-MS/MS)-based protein identification. Urea from the peptide samples was removed using desalting tips (Aspire RP30; Thermo Fisher Scientific). The tips were prepared by pipetting 60% acetonitrile up and down 20 times and then equilibrated with 0.1% TFA by pipetting up and down 15 times. The peptide sample was pulled through the tip 15 times before being washed with 0.1% TFA. The peptides were eluted from the tips using 100 µl of 60% acetonitrile and dried via vacuum centrifugation. Protein identification was performed using a Paradigm HPLC and CTC Pal autosampler (both from Bruker) paired to either a LTQ ion trap mass spectrometer (Thermo Fisher Scientific) or Thermo-Finnigan LTQ-FT ultra ion trap mass spectrometer (Thermo Fisher Scientific) through a ADVANCE Plug and Play Nano Spray Source (Bruker). Peptides were desalted onto a nanotrap (Zorbax 300SB-C18; Agilent Technologies), then eluted from the trap and separated by a 200 mm × 15 cm Magic C18 AQ column (Bruker) at a flow rate of 2 µl/min. Peptides were eluted using a 60-min gradient of 2–80% buffer B (buffer A, 0.1% formic acid; buffer B, 95% acetonitrile/0.1% formic acid). The elution gradient was set at 2–35% buffer B for 30 min, increased from 35–80% buffer B for 2 min, and held at 80% buffer B for 1 min. The gradient then decreased from 80–2% buffer B over 2 min and equilibrated for 25 min. The top 10 ions in each survey scan were subjected to automatic low-energy collision-induced dissociation. Tandem mass spectra were extracted by BioWorks version 3.3. Mass charge state deconvolution and de-isotoping were not performed. All MS/MS samples were analyzed using X! Tandem. The raw data was analyzed with X! Tandem using the UniProt Saccharomyces cerevisiae database appended with the cRAP database, which includes a compilation of common laboratory contaminants, and both forward and reverse sequences were utilized in the data analysis. Trypsin was set as the cleaving enzyme in the X! Tandem search parameters. X! Tandem was searched with a fragment ion mass tolerance of 0.4 D and a parent ion tolerance of 1.8 D. Iodoacetamide derivative of cysteine was specified in X! Tandem as a fixed modification. Deamidation of asparagine and glutamine, oxidation of methionine and tryptophan, sulfone of methionine, tryptophan oxidation to formylkynurenine of tryptophan, and acetylation of the N terminus were specified in X! Tandem as variable modifications. Scaffold (version Scaffold_2_02_033_00_07; Proteome Software Inc.) was used to validate MS/MS-based peptide and protein identifications. Proteins with a t test P-value ≤ 0.05 comparing unique peptides obtained from mass spec of tagged strain to untagged control were further investigated. Bioinformatic analysis To identify the conserved regions in the MitOS components, including the Mitofilin domain, apolipoprotein-o–like domains, and conserved domains of unknown function (DUF), the amino acid sequences were subject to alignments with Protein Homology/analogY Recognition Engine (PHYRE) and the Conserved Domain Database (Kelley and Sternberg, 2009; Marchler-Bauer et al., 2011). Analysis with COILS predicted regions in Fcj1, Aim13, Aim37, and Mos2 that are likely to form coiled coils (scores of 1.0, 1.0, 0.6, and 0.5, respectively; Lupas et al., 1991). Regions of the protein likely to form transmembrane domains were predicted by the HMMTOP transmembrane prediction server (Tusnády and Simon, 1998, 2001). Protease protection analysis Mitochondria (50 µg of total mitochondrial protein) were resuspended in 500 µl of NMIB buffer (0.6 M sorbitol, 5 mM MgCl2, 50 mM KCl, 0.1 M KOAc, and 20 mM Hepes-KOH, pH 7.4), mitoplast buffer (20 mM Hepes-KOH, pH 7.4), or solubilizing buffer (0.6 M sorbitol, 5 mM MgCl2, 50 mM KCl, 0.1 M KOAc, 20 mM Hepes-KOH, pH 7.4, and 1% Triton X-100). After a 15-min incubation on ice, mitochondrial outer membranes in the mitoplast samples were disrupted by gently pipetting up and down 15 times. Trypsin was added to the indicated samples to a final concentration of 100 µg/ml, and samples were incubated on ice for 15 min. The reaction was stopped by adding 2 mM PMSF and incubating on ice for 5 min. Mitochondria from the supernatant were collected by centrifugation at 16,000 g for 10 min at 4°C. The pellets of the intact mitochondria were resuspended in NMIB containing 2 mM PMSF, and all protein, including solubilized samples and mitoplast supernatants, were subjected to precipitation by the addition of 12.5% TCA. The proteins were pelleted by centrifugation at 16,000 g for 10 min at 4°C, washed with acetone, dried, and resuspended in SDS sample buffer. The samples were analyzed by SDS-PAGE and Western blotting. The following antibodies were used: mouse α-FLAG (1:1,000; Sigma-Aldrich), rabbit α-Ugo1 (1:1,000; Hoppins et al., 2009), rabbit α-Tim8 (1:1,000, provided by C. Koehler, University of California, Los Angeles, Los Angeles, CA), and rabbit α-Mgm101 (1:1,000; Meeusen et al., 1999). Western blot analysis and quantification Proteins transferred to nitrocellulose were detected using primary rabbit or mouse antibodies and visualized with the appropriate secondary antibodies conjugated to IRDye (800CW; LI-COR Biosciences). Quantification was performed using the Odyssey Infrared Imaging System (LI-COR Biosciences). Membrane localization analysis Mitochondria (50 µg of total mitochondrial protein) were resuspended in 20 mM Hepes-KOH, pH 7.4, to a final concentration of 1 mg/ml. An equal volume of 0.2 M sodium carbonate was added and samples were incubated on ice for 30 min and subsequently centrifuged for 60 min at 100,000 g at 4°C. Proteins in the supernatant were precipitated by treatment with 12.5% TCA followed by centrifugation for 10 min at 16,000 g at 4°C. TCA pellets were washed in cold acetone and resuspended in MURB sample buffer (100 mM MES, pH 7, 1% SDS, and 3 M urea). Samples were analyzed by SDS-PAGE and Western blotting as described in “Protease protection analysis.” Whole cell extract preparation Cells were grown in SD-dextrose to mid-log phase, and 0.5 OD’s of cells were collected and washed with water. Cells were resuspended in 0.255 M NaOH and 1% β-mercaptoethanol, and incubated on ice for 10 min. Proteins were precipitated with 12.5% TCA, pelleted at 16,000 g at 4°C, washed with cold acetone, and resuspended in MURB sample buffer. Samples were analyzed by SDS-PAGE and Western blotted as described in “Protease protection analysis.” Light microscopy and image processing Cells were grown to mid-log phase, sonicated in brief, concentrated, and immobilized on microscope slides on a 3% low-melt agarose bed in growth medium. To score mitochondrial morphology (Figs. 5 A and 6, A and B), mito-GFP–expressing cells were viewed with a hybrid spinning disk confocal total internal reflection fluorescence wide-field microscope (3I) equipped with a 100×/1.40 NA oil objective lens (3I; Carl Zeiss) and with a Yokogawa spinning disk head. Light microscopy data from a z stack with 0.3-µm increments were collected at ambient temperature using Cascade back-thinned EM cameras, and a projection of the z stack was generated with 3I software. Images were manipulated in Photoshop (Adobe), making linear adjustments to brightness or contrast. To visualize components of MitOS, cells expressing MitOS-GFP and mito-dsRed (Fig. 6, A and C; and Fig. S5, C and D), Fcj1-mCherry and Aim5-yeGFP (Fig. 6 B), or Fcj1-yeGFP and Aim5-yEmCherry (Fig. S5 B) were viewed with a microscope (IX70 DeltaVision; Olympus) using a 60× 1.4 NA objective lens (Olympus) and a 100 W mercury lamp (Applied Precision). Light microscopy images composed of a z stack with 0.3-µm increments of the whole cell were collected using an integrated, cooled charge-coupled device (CCD)-based camera (CoolSNAP HQ; Photometrics) equipped with a Sony Interline Chip. Datasets were processed using DeltaVision’s iterative, constrained three-dimensional deconvolution method to remove out-of-focus light. Projection of the z stack was generated with Applied Precision software and images were manipulated in Photoshop (Adobe), making linear adjustments to brightness or contrast. Electron microscopy analysis Cells were grown to log phase in YPD medium and prepared for electron microscopy essentially as described previously (Bauer et al., 2001). Ultrathin 60-nm sections were post-stained for 10–15 min 2% uranyl acetate in H2O and for 8 min in lead citrate. Samples were examined in a JEM-2100 (JEOL Ltd.) or CEM 902 (Carl Zeiss) transmission electron microscope operated at 80 kV. Micrographs were taken using a 1,350 × 1,050 pixel Erlangshen ES500W CCD camera (Gatan) and Digital Micrograph software (version 1.70.16; Gatan). For electron tomography, single axis tilt series (±60°) were obtained from 200-nm sections using a JEM 2100 transmission electron microscope (JEOL Ltd.) operated at 200 kV, a 4,080 × 4,080 pixel UltraScan 4000 CCD camera (Gatan), serial EM software (Mastronarde, 2005), and IMOD software package version 4.1 (Kremer et al., 1996). Online supplemental material Fig. S1 shows an analysis of the internal agreement of the MITO-MAP data and consistency with previously published interactions. Fig. S2 shows an analysis of the genetic interactions between genes encoding mitochondrial proteins and proteins localized to the endoplasmic reticulum. Fig. S3 shows four genetic connection scatter plots generated from the MITO-MAP. Fig. S4 shows the high genetic correlation of YGR235c with FCJ1, AIM5, AIM13, and AIM37; the relative adsorption efficiency of the MitOS components in the FLAG-purification; and the quantification of cristae junctions in strains lacking components of MitOS. Fig. S5 shows the growth analysis of cells lacking components of MitOS, the colocalization of Fcj1-yeGFP and Aim5-yemCherry, and the localization pattern of GFP-tagged components of MitOS in Δfcj1 or Δaim5. Table S1 includes all final scores for the MITO-MAP. Table S2 is a summary of all the mutations included in the MITO-MAP. Table S3 is a complete summary of the proteomic analysis from on-bead digests of Fcj1-FLAG, Aim5-FLAG, Aim13-FLAG, Aim37-FLAG, Mos1-FLAG, or Mos2-FLAG purifications. Table S4 includes all individual interaction measurements from the MITO-MAP. Videos 1–4 show EM tomograms of the mitochondria in wild-type, Δaim5, and Δaim37 chemically fixed cells. Java Treeview files of the MITO-MAP data are included as a tool to visualize the hierarchical clustering and genetic interaction data. Online supplemental materials are available at http://www.jcb.org/cgi/content/full/jcb.201107053/DC1.