- Record: found
- Abstract: found
- Article: not found
Fluorescent Sensors for Measuring Metal Ions in Living Systems
review-article

03 March 2014
Read this article at

There is no author summary for this article yet. Authors can add summaries to their articles on ScienceOpen to make them more accessible to a non-specialist audience.
Abstract
1
Introduction
All
life forms have an absolute requirement for metals, as metals
play critical roles in fundamental processes, including osmotic regulation,
catalysis, metabolism, biomineralization, and signaling. Group I and
II metals (alkali and alkaline earth metals such as sodium, potassium,
calcium, and magnesium) are highly abundant in most biological organisms.
Gradients of group I and II metals across membranes represent a classical
way to store potential energy, and these ions play roles in osmotic
regulation, generation of action potentials, and signaling. Transition
metals that are generally recognized as playing critical roles in
biology include iron, zinc, copper, manganese, cobalt, nickel, molybdenum,
tungsten, chromium, and vanadium.
1
These
elements are often referred to as trace elements because they are
present at much lower levels than the group I and II metals, although
it is important to note that iron and zinc are often found in substantial
amounts and hence their characterization as trace elements is sometimes
misleading. Transition metal abundance and usage differs notably across
different superkingdoms. For example, eukaryotes devote a higher proportion
of their proteome to binding zinc than bacteria or archaea, but the
reverse is true for iron, manganese, and cobalt.
2
A growing number of comparative genomics studies suggest
that iron and zinc are widely used in biology, whereas other metals
such as copper, molybdenum, tungsten, nickel, and cobalt are used
more sporadically across groups of organisms.
3
To add an additional level of complexity, a recent proteomics study
suggested the microbial metallome, that is, the full distribution
of metals used by an organism, is largely uncharacterized, and there
may be additional uses of transition metals, such as cadmium, uranium,
arsenic, and lead not commonly recognized as being beneficial biometals.
4
One of the first steps in defining the
usage of metals by different
organisms is to establish a metal inventory by quantifying the metal
content of cells and tissues. Biological metals may exist in different
forms, including as hydrated ions, tightly bound forms such as metal-bound
cofactors and protein- or nucleic-acid bound species, or loosely bound
forms in association with a diverse heterogeneous buffer, which can
consist of low molecular weight species such as amino acids, glutathione,
or citric acid, and labile species. The total metal content consists
of the sum of all of these diverse forms. Historically elemental analysis
was carried out by either flame or graphite furnace atomic absorption
spectroscopy (AAS), a technique that enables quantification of the
average total metal content from a digested sample at parts per billion
(μg/L) sensitivity, one metal at a time.
5
Since its introduction in the 1980s, inductively coupled plasma
mass spectrometry (ICP-MS) has largely surpassed AAS as the analytical
method of choice for quantification of metals in a bulk sample due
to its ability to measure multiple metals at once, increased sensitivity
(0.1–10 parts per trillion, i.e., ng/L, for most transition
metals), and increased dynamic range.
6
While
these techniques are instrumental in defining metal abundance in a
bulk sample, they do not permit single cell analysis or subcellular
analysis of the location of metals within a sample. Yet to fundamentally
gain insight into the mechanisms by which cells and organisms regulate
and use metals, it is essential to go beyond quantification of total
metal content in a bulk sample, and to define the speciation, distribution,
and accessibility of metals in individual cells, tissues, and whole
organisms.
Elemental mapping of metals involves measurement
of the distribution
of metals in a biological sample in a spatially resolved manner. One
method for accomplishing this is to adapt mass spectrometry techniques
to permit spatial resolution of total metal content in fixed biological
specimens at the cellular and subcellular levels.
5,7
Some
of the more widely used techniques include secondary ion mass spectrometry
(SIMS), nano-SIMS,
8
and laser ablation
coupled with ICP-MS (LA-ICP-MS).
9
Additional
analytical techniques that permit mapping of total metal content with
high sensitivity and spatial resolution involve synchrotron or focused
ion-beam microprobes.
10
Many of these techniques
have recently been comprehensively reviewed elsewhere and will not
be the focus of this Review.
5,7−11
As a complement to the above techniques, it is important to
define
the chemical form or speciation of metal ions in biological samples
and the distribution between free hydrated ions, loosely bound ions,
and a tightly bound, largely inaccessible, pool. Currently, there
is no single technique available that permits measurement of all of
these different species within the same specimen. Yet there are some
techniques that permit measurement of different subsets of these pools,
for example, the use of fluorescent sensors as detailed below. Thus,
combinations of complementary methods will be required for a comprehensive
view of cellular metal regulation. Another important factor is the
measurement of metal ions in live samples. Life is by definition dynamic,
and this dynamism is key to understanding the mechanisms between cause
and effect for biological processes. Analytical methods that permit
examination of accessible metal pools in live samples would enable
identification of metal ion fluxes, dynamics, and movements in response
to environmental perturbations, a critical step in defining how metals
are regulated and used in cells. An analogy that has often been used
to emphasize the importance of visualization of living specimens is
that reconstructing the basic rules and their consequences of a sports
game such as football from a series of still images taken at different
times from different games would be exceedingly challenging, if not
impossible.
12
This is because events are
not simply a factor of time, but are also a consequence of factors
that happened earlier within the same game.
Light microscopy
is an indispensible tool for cell and molecular
biology and is compatible with visualization of living specimens.
The human eye can only resolve objects on the order of 0.1 mm, but
cells are orders of magnitude smaller, often ranging from 5 to 30
μm. Moreover, bacteria (1 μm), viruses (10–100
nm), and subcellular structures such as the nucleus (10 μm),
mitochondrion (2–5 μm), or microvilli (1 μm) are
smaller still.
13
Because a traditional
light microscope can resolve objects on the order of 250 nm, it has
been an instrumental tool for studying the microscopic world. Recent
advances in super-resolution microscopy have extended the resolution
limit, permitting visualization and analysis of nanoscale structures.
14
The biggest challenge with microscopy is differentiating
the interesting (i.e., a specific object, structure, molecule, or
metal) from the uninteresting (i.e., the background).
Metals
have long been identified and classified by colorimetric
methods due to their light absorption properties, which lead to rich
and highly characteristic optical transitions.
1
Yet in the complex environment of a cell, where multiple metals
and other absorbing species are present in differing quantities, additional
approaches are required to visualize the metal of interest. One strategy
for accomplishing this is to use a chromogenic stain or dye for the
metal of interest to isolate the metal and enhance contrast between
the signal (i.e., presence of the metal) and background. Since the
introduction of Perls’ Prussian blue in 1867 as a stain for
nonheme iron,
15
chromogenic dyes have been
widely used histology tools for visualizing the presence of metals
in fixed cells.
10a
Yet dyes that rely on
absorption of light have limited sensitivity as compared to fluorescence,
thus driving the development of fluorescent sensors for metals to
be used in conjunction with fluorescence microscopy to map metals
in cells.
This Review focuses on fluorescent sensors for transition
metals
commonly found in biological organisms. Generally speaking, such sensors
are designed to measure the accessible or labile pool of metals (free
hydrated and loosely bound, buffered ions), and thus access a subset
of the total metal content of a cell. For sensors to be minimally
perturbing, they should not engage in competitive exchange with tightly
bound endogenous metal complexes, a property that depends on the affinity
of the sensor, its concentration within the cell, and the nature of
the diverse bound-metal pool. A deeper discussion of this point and
strategies for critically evaluating whether sensors perturb metal
speciation will be discussed in section 3.2. We start this Review by giving a basic
overview of fluorescence
imaging and sensor design, followed by a critical analysis of parameters
and properties to consider when using sensors in biological systems.
We then present a historical perspective of how the field has evolved.
While this Review focuses on transition metals, we discuss some of
the key advances/milestones achieved in the development of fluorescent
Ca2+ indicators as these helped lay the groundwork for
much of the subsequent work developing sensors for transition metals.
Finally, we highlight progress in sensor development for biological
metals, emphasizing recent advances, while including a discussion
of the most widely used sensors. To demonstrate what kind of measurements
can be made and what kind of information can be learned from using
fluorescent sensors, we review several applications of sensors for
defining metal homeostasis and dynamics in cells or organisms. We
would also like to call readers’ attention to several excellent
prior
16
reviews that focus on different
aspects of sensor development.
17
Additionally,
important practical considerations for using probes and experimental
protocols have been reported elsewhere.
18
One of the most exciting and powerful possibilities of fluorescence
microscopy is that it can provide a window into the intracellular
metabolism of metals in live intact systems. Fluorescence microscopy
permits visualization of an object of interest in unicellular organisms,
individual cells from multicellular organisms, cells encapsulated
in 3D matrices, organotypic cultures, ex vivo models, and, with the
right instrumentation, whole organisms (bacteria, yeast, plants, flies,
worms, fish, and mice).
19
The application
of fluorescent sensors and fluorescence microscopy, in combination
with other analytical techniques for mapping total metal content,
offers researchers the opportunity to address fundamental questions
about cellular metal homeostasis. Some of these basic unanswered questions
include: What is the amount and speciation of metals in cells? Where
are metals located? How do metal ion concentrations change in response
to cellular events, environmental changes, or onset of disease? Finally,
how do cells regulate metal dynamics, and how do metal dynamics impact
cellular function?
2
General Features of Fluorescent
Sensors for
Metal Ions
Fluorescence involves the emission of photons
that occurs nanoseconds
after an absorption event. A fluorescence microscope takes advantage
of the shift in wavelength between the absorbed and emitted light
by filtering out light due to the excitation source without blocking
the emitted light.
20
Fluorescent sensors
for metals contain two essential features: a metal chelating or binding
moiety and at least one fluorophore capable of absorbing and emitting
light. To function as a sensor, metal binding must alter either the
electronic structure or the molecular structure of the sensor. Changes
in the electronic structure can lead to a change in the intensity
or wavelength of light absorption or emission, while changes in the
molecular structure can alter the distance or orientation between
a pair of fluorophores that serve as a donor–acceptor pair.
A fluorescence microscope permits visualization of changes in fluorescence,
and hence the target of a particular sensor, which in this case is
a specific metal ion of interest, in a spatially resolved manner.
2.1
Photophysical Properties of Fluorophores
Arguably the
most important property of a fluorescent sensor is
its ability to be detected within the complex environment of a cell
or organism. The sensitivity and signal-to-noise ratio of a sensor
are highly dependent on the brightness and stability of the sensor’s
fluorophore(s), as well as the characteristics of the instrumentation.
21
Brighter fluorophores require less excitation
light, thus causing less photodamage to the living specimen. Additionally,
brighter sensors can be used at lower concentrations, thus minimizing
perturbation of metal ion homeostasis. The stability of a fluorophore
is particularly important for time-lapse imaging. While in principle
all fluorophores can cycle between the ground and excited state many
times, repeated exposure to light inevitably leads to photobleaching,
where bleaching is a generic term for all of the myriad processes
that cause permanent decay in fluorescence intensity. Photobleaching
not only limits the length of time a process can be monitored, it
can contribute to phototoxicity as well.
The theoretical brightness
of a fluorophore is defined as the product of the extinction coefficient
and the quantum yield.
22
The extinction
coefficient is the efficiency with which a chromophore absorbs light,
while the quantum yield represents the efficiency with which a fluorophore
emits light after absorption. In this Review, we calculate the theoretical
brightness of sensors by multiplying the quantum yield and extinction
coefficient reported in the literature. Because many metal sensors
involve a change in brightness upon metal binding, we report brightness
in the metal-free and metal-bound state. However, there may be differences
in the photophysical properties of a sensor in vitro (i.e., in a cuvette)
versus in situ (i.e., inside a cell) due to differences in viscosity,
pH, solvent, accessibility to oxygen, or other factors associated
with the cellular environment.
23
Moreover,
the theoretical brightness of the fluorophore is not the only factor
to consider when defining the detection sensitivity.
An additional
important factor that impacts detection sensitivity
in cells is the wavelength of excitation and emission. Many biomolecules
absorb light in the UV and visible spectrum. Because excited molecules
can react with molecular oxygen to produce free radicals, exposure
to electromagnetic radiation can produce reactive oxygen species,
which are damaging to biological samples.
24
Generally speaking, higher energy, lower wavelength light causes
greater photodamage than lower energy, longer wavelength light.
25
In addition, because many biomolecules emit
light in the UV and visible range, the background signal from the
cellular milieu is higher at higher energy.
26
Light is also scattered when it encounters matter, and this scattering
depends on the nature of the tissue and wavelength of light.
27
Scattering limits the depths to which light
can penetrate a biological specimen; for example, a photon is scattered
once for every 47 μm that it transits through an adult rat brain,
limiting the effective imaging depth to ∼50 μm using
confocal laser scanning microscopy.
19
As
a general rule, fluorescent sensors that absorb and emit at longer
wavelengths give rise to less phototoxicity, decreased background
autofluorescence, and are subject to decreased scattering.
Of
course it is important to note that the detection sensitivity,
often referred to as the contrast between signal and background, will
depend not just on the inherent properties of the sensor and the biological
specimen, but also on the instrumentation available. Excitation source
(intensity and nature of the source – for example, how well
a laser line overlaps with the excitation of the fluorophore), filter
sets (both the bandwidth and the transmission), camera sensitivity,
and the objective are all factors that influence the intensity of
a measured fluorescence signal.
20
2.2
Mechanisms of Altering a Fluorescence Signal
As stated
above, metal binding must alter the electronic and/or
molecular structure of the sensor to induce changes in fluorescence
properties that can be detected by a fluorescence microscope. Two
common mechanisms by which a metal can modulate the electronic structure
and hence fluorescence are energy transfer or electron transfer between
the metal and photoexcited fluorophore. Both processes can give rise
to either a “turn-off” or a “turn-on”
fluorescence response, due to fluorescence quenching or enhancement,
respectively. A variety of clever approaches have been used to manipulate
these properties to design platforms for optical detection of metal
ions. There is an extensive body of literature on chemosensors whose
optical properties are altered by analyte binding, and that make use
of small-molecule fluorophores, polymers, solids and gels, material
surfaces (quantum dots, glass or gold surfaces, carbon nanotubes),
and mesoporous materials.
28
Such probes
exploit a variety of different mechanisms for chemical or environmental
detection of metal ions. In some cases, such probes have been used
for biological detection of transition metals. This Review focuses
on fluorescent sensors for metals that have been applied to biology,
and so the discussion below focuses on the mechanisms that are prevalent
in the subset of probes that have been applied for biological detection
of transition metals.
Energy transfer can occur between transition
metals with partially filled d-orbitals of appropriate energy and
a photoexcited fluorophore by a double electron exchange process (Figure 1A). This
type of energy transfer, first postulated
by Dexter, is also referred to as short-range or collisional.
29
It is a form of quenching whereby an excited
electron from one molecule (the donor) is transferred to another molecule
(the acceptor). Figure 1A displays a schematic
of Dexter energy transfer. The process is active only at very short
distances, typically less than 10 Å, because it requires wave
function overlap. This electron exchange is one of the primary mechanisms
by which the emission of organic fluorophores can be quenched by metal
ions.
30
While this quenching property means
that most metal ions are capable of directly modulating fluorescence
emission, it also poses a challenge in distinguishing between different
metals if multiple metals capable of quenching are present in a complex
sample. It also complicates the design of “turn-on”
sensors in which a fluorescence signal is increased in response to
metal ions.
Figure 1
Schematic of Dexter energy transfer (A), “turn-on”
PET (B), and FRET (C).
In addition to energy transfer, fluorescence properties can
also
be modulated by electron transfer between the metal and the fluorophore
or modulation of electron transfer within a self-contained fluorophore–chelate
unit upon metal binding (Figure 1B).
30a,30b
This process requires separation of charge and therefore excitation
of the donor by light; hence it is typically referred to as photoinduced
electron transfer (PET). As with energy transfer, electron transfer
can lead to either quenching or enhancement of fluorescence. Direct
electron transfer between a photoexcited fluorophore and a metal ion
with low energy empty or partially filled d-orbitals typically leads
to quenching.
Fluorescence quenching by metal ions does not
have to be deleterious,
and the right sensor design can turn it into a benefit. As one example,
Kool and co-workers created polyfluorophore sensors on a DNA backbone
that take advantage of quenching properties.
28d
The molecular design of these sensors incorporates fluorophores
and metal binding ligands into DNA-like oligomers. A variety of fluorescence
responses were observed including fluorescence enhancement and red-
and blue-shifts. A panel of sensors was then used to differentiate
eight metal ions that are typically implicated in fluorescence quenching,
including Hg2+, Cu2+, Co2+, Ni2+, Pb2+, Ag+, Cr3+, and Fe3+. While this approach was
only employed for chemical detection
of metals in solution, recent efforts by the same research group have
demonstrated that polyfluorophores can be fused to a protein of interest
in a mammalian cell using the HaloTag technology, opening the possibility
that this sensor platform could be adapted for cellular detection
of metal ions.
31
PET can also give
rise to fluorescence enhancement (Figure 1B).
This phenomenon is most commonly observed in
small-molecule sensors comprised of a fluorophore, linker domain,
and an electron-rich metal chelate. In the absence of a metal, excitation
leads to separation of charges, and PET between the fluorophore and
the chelate competes with fluorescence emission. Thus, PET gives rise
to an efficient relaxation pathway, decreasing the quantum yield of
the fluorophore. Modulation of PET can occur when binding of a metal
ion to an electron-rich chelating moiety shifts the charge density,
effectively quenching the PET decay pathway and increasing the quantum
yield.
28a,28c,32
The development
of fluorescent Ca2+ sensors in 1980 by Roger Tsien was
one of the first examples of how tuning of this photophysical mechanism
can lead to robust fluorescent sensors, in this case for Ca2+, demonstrating the potential
of this design for biological fluorescence
imaging.
33
The modularity of the PET platform
has been exploited for the development of sensors with enhanced properties.
This platform consists of three components: a fluorophore, linker,
and chelator that can all be individually modified to alter PET within
the probe. In particular, tuning of electron density by incorporation
of electron-withdrawing groups, altering the nature of the PET “switch”,
and changing the linker between the chelate and fluorophore can tune
the PET efficiency, thus influencing the relative brightness of the
sensor in the unbound and bound state.
17b,28c
A slightly
modified sensor platform characterized by an integrated
fluorophore–chelate system without a clear spacer can also
be exploited for metal sensing.
32
Although
this design sacrifices some of the modularity and tunability of the
classical three-component system, internal charge transfer (ICT) can
lead to a shift in wavelength of excitation or emission, which if
large enough can result in a ratiometric sensor. For ratiometric sensors,
fluorescence images are collected at two different wavelengths, typically
the wavelength maxima in the metal-free and bound state, enabling
the free and bound states of the indicator to be monitored simultaneously.
Such sensors permit normalization for perturbations of fluorescence
that are not related to changes in metal ions such as changes in the
path length, sample thickness, dye concentration, or movement of the
sample. Such sensors also allow researchers to quantify the concentration
of dye within cells, which is an important control when assessing
whether the sensor perturbs metal homeostasis.
Another mechanism
that has been exploited for the development of
metal sensors is Förster resonance energy transfer (FRET).
This phenomenon was described by Theodor Förster in 1948 and
involves dipole–dipole coupling between a photoexcited donor
and an acceptor.
34
This is a radiationless
process in which energy is transmitted by coupling of the two oscillating
dipoles (Figure 1C). The probability of energy
transfer is described by the FRET efficiency, which is highly dependent
on the distance between the two chromophores (inversely proportional
to the sixth power of the distance between the donor and acceptor),
overlap between the donor emission and acceptor absorption, and the
relative orientation of the transition dipoles of the donor and acceptor
(maximal transfer for collinear dipoles, zero transfer for perpendicular
dipoles). The acceptor can either be a chromophore, simply capable
of absorbing energy, or a fluorophore in which case the excited molecule
emits a photon upon relaxation to the ground state due to sensitized
emission. FRET causes a decrease in donor emission and a decrease
in the donor lifetime, and hence can be monitored at the donor wavelength
only. However, all FRET-based sensors for metal ions employ two fluorophores
so that measurement of both donor emission and sensitized emission
from the acceptor yields a ratiometric sensor. For such sensors, the
FRET ratio is the ratio of the sensitized acceptor emission and the
donor emission and can either reported as either acceptor/donor or
donor/acceptor. A typical sensor design employs two fluorophores (a
donor and acceptor) and a metal chelating unit. Metal binding induces
a change in the molecular structure that alters either distance, orientation,
or both so as to either promote or disrupt FRET.
A final mechanism
that is increasingly employed is to exploit the
unique chemical reactivity of different metal ions to generate probes
in which a metal-catalyzed reaction leads to a change in fluorescence.
Specificity in such probes is encoded by the fact that only a certain
metal (or small subset of metals) is capable of mediating the reaction.
Two classic examples are the chelation-induced spirolactam ring-opening
employed in sensors for Cu2+, Fe3+, and Hg2+.
17e,35
Another chelation-enhanced fluorescence
was used early on to develop a probe for the toxic metal Pb2+.
36
2.3
Classes
of Sensors for Live-Cell Imaging
2.3.1
Molecular
Probes
Molecular probes
are compromised of small-molecule fluorophores coupled to a metal
chelating unit. They may be entirely chemical in nature or comprised
of peptide or nucleic acid components. The distinguishing feature
of these probes is that they cannot be synthesized within a living
cell or organism and hence must be delivered in some way. Some molecular
sensors are naturally membrane permeable, and hence delivery simply
involves adding the sensor to cells and waiting an appropriate length
of time for the sensor to diffuse into the cell. However, many metal
chelates contain charged carboxylate moieties, which prevent cell
entry. In 1981, Roger Tsien introduced a clever trick of masking the
four carboxylates in a Ca2+ sensor by esterifying them
with an acetoxymethyl (AM) ester, thus rendering the sensor cell permeable.
37
Upon entry into cells, exposure to cellular
esterases led to hydrolysis of the AM ester, thus trapping the charged
indicator in cells and rendering it Ca2+ sensitive once
again. This approach has subsequently been used to facilitate cell
permeability of some fluorescent sensors for transition metals, as
detailed in sections 5–9 of this Review. In an exciting recent development, Tian et
al. tested a series of synthetic branched esters against a panel of
esterases and identified selective enzyme–substrate pairs.
38
Expression of different esterases in different
cell types then permits cell-specific delivery of small-molecule fluorophores.
Such an approach could be used to trap metal sensors to permit monitoring
of metal homeostasis in specific subsets of cells in intact multicellular
organisms.
Another method of delivery is attachment of a molecular
sensor to a cell penetrating peptide. An array of naturally occurring
and synthetic peptides have been shown to be spontaneously transported
into mammalian cells and are capable of carrying along cargo as large
as a 120 kDa protein.
39
While the mechanisms
of entry remain controversial, and the ultimate destination of cargo
is complicated and in some cases unpredictable, nevertheless there
have been many successes of using cell penetrating peptides as an
efficient delivery method.
39
For example,
this approach was employed in early generations of Zn2+ sensors based on carbonic
anhydrase covalently linked to a small-molecule
fluorophore, AlexaFluor.
40
Finally,
molecular sensors can be microinjected into individual
cells.
41
This method allows delivery of
a well-defined concentration of sensor into single cells as long as
the cells are robust enough to withstand penetration by a micropipet.
This approach is not widely used because the invasive nature may lead
to sustained damage of the plasma membrane, dyes must be loaded one
cell at a time, and this approach does not permit delivery into multiple
cells in whole tissues or organisms.
42
A convenient feature of molecular sensors is their modular construction
and the opportunity to exploit a large repertoire of well-characterized
fluorophores. Small-molecule fluorophores tend to have excellent photophysical
properties (brightness and photostability), where the best organic
dyes emit 10–100-times more photons before bleaching when compared
to fluorescent proteins.
43
Although such
photophysical properties may not be maintained within a sensor, there
are a large number of excellent dyes from which to choose as the basic
building blocks for sensor construction. The majority of molecular
platforms rely on coumarin, fluorescein, boron-dipyrromethene (BODIPY),
and rhodamine.
2.3.2
Genetically Encoded Probes
Genetically
encoded probes are fluorescent sensors that are encoded by a nucleic
acid sequence and are synthesized entirely by a cell. The largest
category of genetically encoded sensors is comprised of protein-based
probes that utilize one or more fluorescent proteins (FP) as the fluorophore.
The sensors also contain a peptide or protein moiety that serves as
a metal binding domain. For single FP-based sensors, metal binding
induces a change in the chemical or electronic environment around
the chromophore, causing either a change in intensity or a shift in
the excitation or emission spectrum.
44
Sensors
containing two FPs typically exploit the principle of FRET, where
metal binding induces a conformational change, thereby either promoting
or disrupting FRET between the two FPs.
An under-explored platform
for creating genetically encoded sensors is the use of nucleic acids.
The recent discovery of naturally occurring metal-sensing RNAs, called
riboswitches, that sense Mg2+ levels and regulate the expression
of metal transporters, demonstrates that nucleic acids can function
as robust metal-dependent switches in cells.
45
Structure–function studies on the Mg2+-sensing
riboswitches, so-called M-box riboswitches, revealed that in vitro
these riboswitches bind different metal ions with varying affinity,
but similar cooperativity.
46
While the
naturally occurring riboswitches control Mg2+ regulatory
genes, one can imagine engineering a riboswitch to drive the expression
of a fluorescent reporter, thus generating a genetically encoded nucleic
acid-based Mg2+ sensor. Furthermore, tuning of the ligand
binding site might enable the development of sensors specific for
different transition metals.
2.3.3
Hybrid
Probes
Probes that involve
a combination of genetically encoded and small molecular elements
are referred to as hybrid probes. Such probes involve introduction
of the genetically encoded component by transfection, viral transduction,
or some other transgenic technology and introduction of the small
molecular component by the means described above. This approach typically
makes use of protein or peptide tags, although nucleic acid-based
targeting could be an area of future development. A number of peptide/protein
tags have been developed that are capable of binding small-molecule
agents in cells, including the FlAsH/ReAsH system,
47
SNAP-tag,
48
HaloTag, and peptides
selected for sensor binding.
49
There are
a handful of fluorescent probes for different analytes that fall in
this category, although only the SNAP-tag technology has been used
to genetically target metal-based sensors. One of the first examples
was the use of SNAP-tag technology to target the small-molecule ZP1
sensor to mitochondria and Golgi.
50
To
be compatible with SNAP-tag technology, the ZP1 probe was modified
to incorporate a benzylguanine moiety that could serve as a substrate
for O
6-alkylguanine-DNA alkyltransferase
(AGT). AGT acts on benzylguanine-tethered sensors through an active
site cysteine, which attacks the O
6-benzylguanine,
leading to covalent attachment of the sensor to AGT and release of
guanine.
48
Transfection of cells with AGT
that is genetically targeted to a specific compartment (such as mitochondria
or Golgi) provides the opportunity to localize a small-molecule sensor
in a particular location. This approach has been used to target Ca2+ sensors,
51
Zn2+ sensors,
50
and H2O2 sensors
52
to specific cellular compartments, and in principle
is generalizable to any sensor platform that can be modified with
an O
6-BG moiety.
Another example
of a hybrid probe platform is that of the carbonic anhydrase (CA)
family of Zn2+ probes. The CA-probes were recently re-engineered
to replace the covalently attached small-molecule fluorophore with
a red FP.
53
The CA-FP fusion protein has
been expressed in both bacterial and mammalian cells. Addition of
dapoxyl sulfonamide, a cell permeable probe that binds to an open
coordination position on Zn2+ when it is bound to CA, leads
to FRET between the dapoxyl sulfonamide and red FP. Because the CA-FP
fusion is synthesized by the cell, signal peptides can be used to
target the sensor to intracellular organelles, and this sensor was
successfully targeted to mitochondria of mammalian cells.
53a
3
Important
Considerations for Introduction of
Sensors
In addition to the photophysical properties of sensors
(brightness,
photostability, wavelength range) and biochemical properties (affinity
and specificity for the target metal), there are a number of factors
that influence the use of fluorescent sensors for mapping accessible
pools of metal ions in cells. For such applications, factors such
as the intracellular concentration of the sensor, where it is located
within cells, and the extent to which metal ions are buffered in the
cellular milieu will strongly influence the resulting measurements.
For example, if the sensor concentration greatly exceeds the metal
ion concentration, the sensor can sequester the entire metal ion pool
and perturb the system. However, this effect can be mitigated if there
is a large reservoir of buffered metal ion and the sensor concentration
is substantially less than this reservoir. Likewise, if the sensor
affinity is high and the concentration is substantial, the sensor
may engage in competitive exchange with endogenous bound metal complexes.
A discussion of these factors is presented below.
3.1
Factors
Affecting the Intracellular Concentration
of Sensors
The intracellular concentration of a sensor is
governed by a combination of how much of the probe is incorporated
or expressed in cells, and how well the sensor is retained. Molecular
probes are applied to cells or tissues, and either diffuse passively
into cells if they are sufficiently hydrophobic, or are aided by the
processes described above. It is important to recognize that the amount
of dye applied to cells, tissues, or organisms may differ substantially
from the intracellular concentration, and the only way to truly define
how much dye is present is to measure the concentration inside cells,
although this is challenging unless the probe is ratiometric. There
are some mechanisms by which probes become trapped in cells, leading
to accumulation and concentration in the cellular milieu. Such mechanisms
may also affect the localization of probes within cells, as detailed
in section 3.3.1. Cleavable esters, which when
hydrolyzed by cellular esterases yield a charged probe that does not
freely diffuse out of cells, are often used to promote accumulation
of probes within cells.
37,38
In fact, AM-ester-based
probes are often concentrated at least 100-fold inside cells, yielding
intracellular concentrations in the hundreds of micromolar up to millimolar.
54
Intracellular accumulation can also be facilitated
by pH for dyes that are generally lipophilic and hence membrane permeable,
but that are also weak acids or bases.
55
Such probes tend to concentrate in either basic or acidic compartments,
respectively, and are further discussed in section 3.3.1. The unfortunate reality
is that cell loading remains poorly
understood and still poses a challenge for many otherwise promising
molecular sensors.
The retention of probes is also an important
consideration, as over time all molecular probes will be expelled
from cells, either by active extrusion or by passive leakage. Probes
with poly carboxylates (such as the free acid form of AM-ester based
probes) can be extruded by nonspecific anion transporters by a mechanism
that is similar to organic anions.
56
This
process can be minimized by probenecid and sulfinpyrazone, which inhibit
uric acid transport, and increase the retention of probes within cells.
57
However, it is not only the free acid form that
is expelled from cells as one multidrug resistance protein (MDR1)
has been shown to extrude the AM-ester, but not the hydrolyzed free
acid form of sensors, suggesting multiple mechanisms for expulsion
of dyes.
58
There are also many examples
of leakage of fluorescein-based probes from cells, where the rate
of leakage is often dependent on the charge of the molecule with more
highly charged probes leaking more slowly.
55,59
Genetically encoded sensors are most commonly incorporated
into
cells as plasmid DNA. Transient transfection of cells with plasmid
DNA results in expression of genetically encoded sensors anywhere
from 1 to 5 days, whereas viral transduction can result in the stable
expression of a sensor due to genomic incorporation. The amount of
sensor present in cells depends on the method of incorporation (transfection
versus viral transduction) and the strength of the promoter that drives
sensor expression.
3.2
Buffering
Defining
the concentration
of sensor in cells is an important consideration when evaluating the
extent to which the sensor perturbs what you are trying to measure,
the free, labile, or accessible metal pool. If the concentration of
sensor is too high, this could lead to buffering of the metal, perturbation
of cellular metal pools, and an inner filter effect. One method to
determine whether the sensor perturbs the free ion pool is to measure
the metal concentration as a function of sensor concentration. Such
an analysis has been carried out for the small-molecule Zn2+ sensor FluoZin-3 AM in
two different cell types
54b,60
and the genetically encoded Zn2+ sensor (ZapCY platform)
targeted to a variety of locations.
60,61
For these
two probes, it was revealed that treatment of cells with increasing
concentrations of FluoZin-3 AM led to depletion of the Zn2+ pool, perhaps because
high levels of accumulation of the dye led
to intracellular concentrations that rivaled the buffered Zn2+ pool (i.e., hundreds
of micromolar). On the other hand, the ZapCY
sensor, which was present at concentrations in the low micromolar
range, did not lead to measurable perturbations of the Zn2+ pool. While little is
known about the buffering capacity of different
kinds of cells for different metal ions, a reasonable guideline is
to minimize the sensor concentration. Moreover, for quantitative measurements,
that is, determination of metal ion concentrations within cells, it
is essential to perform measurements at a range of concentrations
to define whether the resulting measurements are influenced by the
sensor concentration. Finally, the inner filter effect arises if the
concentration of dye molecules is sufficiently high that the excitation
light is not constant over the illumination spot.
62
Again, inner filter effects can be minimized by minimizing
dye concentrations.
3.3
Localization
One
of the primary applications
of fluorescent sensors is that they permit measurement of metal ions
in a spatially defined manner. Eukaryotic cells are by definition
compartmentalized, containing a nucleus that is separated from the
cytoplasm as well as membrane enclosed organelles. Even bacteria display
compartmentalization with the cytoplasm separated from the periplasm.
Compartmentalization leads to different chemical environments, with
changes in pH, reduction potential, and of course biochemistry. It
is well established that different metalloproteins and metalloenzymes
localize to different cellular compartments, for example, zinc-dependent
polymerases in the nucleus, iron–sulfur cluster biogenesis
machinery in mitochondria, and manganese-dependent photosystem II
in the thylakoid membrane of chloroplasts. Just as different cells
and organisms have different metal requirements,
2
so too will compartments within cells. In fact, even in
cells with minimal compartmentalization such as bacteria, differences
between metal availability in the cytosol and periplasm may play a
critical role in ensuring proper metalation of proteins. In a proof
of principle study, Robinson and co-workers demonstrated that the
compartment in which a protein folds can determine which metal is
bound to the protein, suggesting that one important feature of compartmentalization
is to segregate metals to ensure that the right proteins have access
to the right metals.
63
One of the exciting
applications of fluorescent metal sensors is the potential to visualize
and quantify the accessible metal pool in the cytoplasm as well as
in distinct compartments.
Given the compartmentalized nature
of cells and the growing evidence that metal distribution is heterogeneous,
it is essential to define the precise localization of fluorescent
probes, and to assess whether the probe reports on multiple compartments.
The location of a fluorescent sensor can result from either direct
targeting or serendipitous localization. Localization is typically
defined by comparing the colocalization of the probe with a well-established
organelle marker and quantifying the overlap using some sort of correlation
coefficient, such as Pearson’s correlation coefficient. While
colocalization is a standard practice in light microscopy, it is important
to note that not all cellular organelles have clearly defined and
unique markers and likewise not all markers are restricted to single
cellular compartment, or even have homogeneous distribution within
a single compartment. A notorious example relates to defining vesicle
populations, where RabGTPases generally mark vesicular populations,
but these proteins are rarely restricted to a single type of vesicle.
64
The discussion below will be divided into molecular
probes, whose localization is governed by chemical nature of the probes,
and genetically targeted sensors (genetically encoded and hybrid probes),
whose localization is directed by signal peptides or fusion to other
proteins. A summary of sensors that have been targeted to specific
subcellular locations is presented in Figure 2.
Figure 2
Diagram of sensors that have been targeted to specific organelles
for subcellular metal ion imaging, either with peptide signaling motifs
or with chemical groups known to associate with a particular subcellular
location. Additionally, probes for which spontaneous accumulation
in an organelle has been verified by colocalization studies are shown.
More detailed descriptions of particular targeting strategies are
discussed in later sections.
3.3.1
Factors Governing Localization of Molecular
Probes
Even after many years of study on fluorescent indicators,
particularly those for Ca2+ and pH, we still lack a comprehensive
understanding of the principles that govern the intracellular distribution
of fluorescent probes.
55,59,65
Molecular probes must be sufficiently lipophilic to pass through
the plasma membrane, but not so lipophilic that they accumulate within
membranes. Plasma membrane permeability often means the probes will
cross intracellular membranes as well, which, given the altered chemical
environment of intracellular compartments, may lead to trapping of
sensors in intracellular organelles. For some dyes, particularly those
that are weak acids or bases, accumulation and hence cellular distribution
depends on pH.
55
The neutral form of the
probe may readily diffuse through membranes; however, the charged
form does not diffuse through membranes as readily, and instead accumulates
in subcellular compartments. For example, weak bases that become protonated
cations in acid compartments may be trapped in compartments such as
endosomes, lysosomes, Golgi, and secretory vesicles, whereas weak
acids that become anions in more basic compartments may accumulate
in mitochondria.
55
Many AM-ester
based probes also exhibit complex and heterogeneous localization.
In addition to passing through the plasma membrane, AM-ester probes
can often penetrate intracellular membranes, and it has been shown
that enzymatic hydrolysis of AM esters can occur within subcellular
compartments.
66
Moreover, de-esterification
is often not complete, influencing both localization and dye retention.
23b,54a,55,65
These probes have been detected in an array of intracellular compartments
including endosomes/lysosomes, vesicles, Golgi, ER, mitochondria,
and plasma membrane.
23b,54a,60,65
Moreover, it is common for a probe to exhibit
different spontaneous localization in different cell types.
60,65
In an effort to predict properties of dye uptake and intracellular
localization, Thompson et al. examined the molecular charge and lipophilicity/hydrophobicity
by the logarithm of the octanol–water partition coefficient
(logP) for a series of fluorescent probes, and found that both of
these parameters play a role.
65
In addition,
some cell types can endocytose sensors, which may or may not be able
to escape from the endosome. For example, AM-ester-based probes can
be endocytosed and then hydrolyzed in the lumen of the vesicle, thus
trapping the sensor in the endocytic pathway.
66
Finally, tweaks in molecular design of small-molecule probes
often
result in changes in localization. A commonly employed technique for
promoting accumulation of a probe into mitochondria is the incorporation
of lipophilic delocalized cations such as phosphonium ions or use
of positively charged rhodamine derivatives, whose uptake into mitochondria
is enhanced by the negative mitochondrial membrane potential.
67
However, as shown by Chyan et al., a cation
such as triphenylphosphonium alone is not sufficient for mitochondrial
targeting, as probes require a minimum level of lipophilicity to prevent
endo/lysosomal accumulation.
68
Two clever
approaches for targeting the plasma membrane involved addition of
dodecyl alkyl chains or a peptide-targeting motif to a Zn2+ sensor that facilitated
the anchoring of the sensor on the extracellular
side of the plasma membrane, facilitating measurement of Zn2+ release from cells.
69
In another example
that resulted in a serendipitous change in localization, recently
developed benzoresorufrin-based probes accumulate in the ER, whereas
similar fluorescein-based probes do not.
70
Another potentially complicating factor that could influence
intracellular
properties and localization is solubility. Fahrni et al. recently
demonstrated that a number of small-molecule Cu+ probes
formed colloidal aggregates in aqueous buffer.
71
While it remains to be seen whether this affects the cellular
properties of these probes, it is an important reminder that all probes
are prone to potential artifacts, and careful controls must be conducted
to minimize artifacts.
Finally, spontaneous localization may
change between different
types of cells. This is well documented for calcium probes,
65
but occurs for metal sensors as well. Qin et
al. demonstrated that while the small-molecule sensor FluoZin-3 AM
shows the strongest colocalization with the Golgi in HeLa cells, it
shows the strongest colocalization with VAMP2 (a marker of vesicles)
in cortical neurons.
60
However, in both
cell types, there was also FluoZin-3 present in the cytosol. Moreover,
the bright signal of FluoZin-3 in the Golgi was unresponsive to perturbations
of cellular Zn2+, revealing that the high fluorescence
intensity resulted from a high dye concentration, rather than a high
Zn2+ concentration.
While the uncertainty in dye
localization can give rise to numerous
artifacts, it is possible to empirically change experimental conditions
(concentration of the probe, loading time and temperature, cell type)
to minimize intracellular compartmentalization. Moreover, compartmentalization
can be an advantage for measuring metal ions within compartments.
3.3.2
Genetic Targeting of Probes
The
localization of genetically encoded probes and hybrid probes is defined
by genetic targeting, such as attachment of the sensor to a signal
peptide, or fusion to a protein of interest to direct the sensor to
a particular location. Common targeting motifs are presented in Table 1. Such strategies
can be used to localize a probe
with high fidelity. Localization should always be confirmed by visual
comparison with well-established organelle markers and quantification
of colocalization, as sometimes genetic targeting fails to properly
localize the probe.
4
A Brief
History of Visualizing Cellular Metal
Ion Distribution with Probes
To place the current efforts
in the development of metal sensors
in perspective, it is instructive to look at how the field of mapping
metals in biological organisms has evolved to where it is today. Figure 3 presents
a historical timeline that highlights
some of the key landmarks in the past 150 years, and we elaborate
on these discoveries below. Transition metals were first shown to
be necessary for life when Raulin demonstrated that zinc was essential
for growth of the common bread mold Aspergillus niger.
72
This discovery catalyzed active research
into the concentration of different metal ions and their distribution
throughout cells and tissues. The history of visualizing metal ions
in cells begins with histological staining. Histology typically involves
sectioning and staining cells or tissues before examination under
a light or electron microscope. Specific structures can be visualized
by staining with certain dyes, among which hematoxylin (nuclei) and
eosin (cytoplasm) are some of the most widely used. One of the earliest
histological stains for a biological trace metal is the Prussian blue
method pioneered by Perls, who first described staining tissues for
nonheme iron in 1867.
15
Perls treated tissue
samples first with potassium ferrocyanide followed by HCl. The acid
released iron from the tissue, which then could react with the ferrocyanide
ion to generate the insoluble Prussian blue precipitate. The resulting
tissues samples were stained a vivid blue-green in the presence of
iron. Around the same time, Quincke used ammonium sulfide to visualize
iron in tissues as black iron sulfide.
83
Another alternative, the Turnbull method, uses acid-ferricyanide
instead of the acid-ferrocyanide reagent of Perls.
84
The ferricyanide ion reacts with Fe2+ to produce
the insoluble Turnbull blue precipitate. These basic methods are still
employed today for the detection of nonheme iron but have been subjected
to various optimizations and improvements, the details of which can
be found elsewhere.
85
Figure 3
Timeline of historical
developments in visualizing metal ions in
cells.
Table 1
Signal Peptides and
Fusions Commonly
Used for Genetic Targetinga
targeted
location
signal peptide
(source: sequence)
refs
nucleus
NLS: PKKKRKVEDA (at C-terminus)
(73)
ER lumen
calreticulin ss: MLLSVPLLLGLLGLAAAD
(at N-terminus)
(61a,73a,74)
bovine prolactin ss + 10
aa of mature domain: MDSKGSSQKAGSRLLLLLVVSNLLLCQGVVS-TPVCPNGPGN
KDEL (at C-terminus)
mitochondrial
matrix
CytCOx ss:
MSVLTPLLLRGLTGSARRLPVPRAKIHSLGDP
(N-term)
(61b,75)
DAKAP1a ss: MAIQLRSLFPLALPGMLALLGWWWFFSRKK
(N-term)
(73b)
mitochondrial membrane
Tom20 ss: MVGRNSAIAAGVCGALFIGYCIYFDRKRRSDPN
(N-term)
(73c,76)
Golgi lumen
fusion to GalT (at N-terminus)
(61a,77)
Golgi
membrane
eNOS ss:
MGNLSKSVAQEPGPPCGLGLGLGLGLCGKQCPA
(N-term)
(73c,76)
plasma membrane,
intracellular surface
MGCIKSKRKDNLNDDGVDMKT (at
N-term, MyrPalm)
(73c,75,78)
KKKKKSKTKCVIM (at C-terminus,
polybasic + Farn)
(73b)
KLNPPDESGPGCMSCKCVLS
(at
C-terminus)
(79)
MLCCMRRTKQVEKNDEDQKI (at
N-terminus, PalmPalm)
(79)
plasma membrane
secretion singal: MGTDTLLLWVLLLWVPGSTGD
(N-terminus)
(80)
extracellular
surface
transmembrane
anchoring
domain of PDGFR
vesicles
VAMP2 (at N-terminus) fusion
(81)
synaptophysin fusion
(82)
VGLUT-1 fusion
(82)
endosomes
VAMP3 fusion
(81a)
a
Abbreviations used in the table
are as follows: NLS, nuclear localization signal; CytCOx, cytochrome c oxidase; Tom20,
mitochondrial import receptor subunit
Tom20; eNOS, endothelial nitric oxide synthase; GalT, human galactosyltransferase
type II; MyrPalm, myristoylation and palmitoylation; Farn, farnesylation;
PalmPalm palmitoylation and palmitoylation; PDGFR, platelet-derived
growth factor receptor; VAMP2, vesicle associated membrane protein
2 (also known as synaptobrevin 2); VGLUT-1, vesicular glutamate transporter
1; VAMP3, vesicle associated membrane protein 3 (also known as synaptobrevin
3).
At the end of the 19th
century, one of first reports of copper
distribution was enabled by the cytoplasmic dye hematoxylin to stain
copper in diseased oysters.
86
This dye
was also used by Mendel and Bradley to visualize the distribution
of metals in hepatic tissues of the sea snail Sycotypus
canaliculatus.
87
This study
also employed sodium nitroprusside in what was the first demonstration
of labile Zn2+ in these tissues. Although this technique
suffered from low sensitivity and therefore attracted little attention
at the time, the reaction was later shown to be specific for Zn2+ detection.
88
These studies represent
some of the earliest attempts to visualize the distribution of transition
metals throughout tissues using exogenous probes, and they set the
stage for imaging these ions in living cells with fluorescent sensors.
Subsequent improvements in histological staining methods allowed
for new discoveries concerning the distribution of trace metals throughout
tissues. Okamoto developed the use of rubenic acid-based methods for
the detection of copper in the late 1930s.
89
Although it can form colored complexes with other metal ions, notably
Ni2+, Ag+, and Co2+, these complexes
have different colors and solubility in acetate and ethanol than the
dark green precipitate that forms upon reaction with Cu2+ ions. With a detection limit
in the low micromolar range, this technique
is not suitable for examining healthy concentrations of Cu2+ in tissues; however,
it has been used to visualize excess Cu2+ accumulation in tissues from Wilson’s disease
patients.
90
In later years, rhodanine was established for
the selective staining of Cu+ over divalent ions.
91
Other methods for histochemical staining of
copper include diethyldithiocarbamate, dithizone, and orcein, but
all of these methods are only able to detect abnormally high concentrations
of copper in tissues and often produced conflicting results.
92
In the early 1940s, Okamoto applied dithizone
for the histochemical
visualization of Zn2+ in islets of Langerhans of the pancreas.
93
For many years, this was one of the few histochemical
methods available for Zn2+ visualization and was used to
identify labile Zn2+ pools in numerous tissues. For example,
the presence of labile Zn2+ in the brain was first demonstrated
in 1955 by Maske and co-workers with intraperitonial dithizone injections.
94
In addition to chromogenic dyes, autometallographic
methods have
been used for visualizing metals in tissues. Briefly, autometallography
involves the silver-amplified detection of selenide or sulfide nanocrystals
formed with endogenous or toxic metal ions. The large silver nanocrystals
can be visualized via light or electron microscopy. This technique
for transition metal detection was originally proposed by Timm in
1958,
95
and has subsequently been optimized
for visualization of labile Zn2+ pools, most notably by
Danscher and co-workers.
96
While such techniques
have been used mostly for Zn2+ detection, they have been
applied to other metals as well.
97
The last 50 years have given rise to a gradual evolution in the
development of fluorescent indicators for imaging metal ions in cells,
tissues, and organisms. Such probes offer greater optical sensitivity
than the chromogenic stains discussed above and the potential for
imaging metal ions in live specimens. The use of fluorescent indicators
for metal ions dates back to 1968, when Mahanand and Houck used 8-hydoxyquinoline
as a fluorescent stain for Zn2+ in human plasma.
98
In an attempt to find a stain that combined
the sensitivity and resolution of silver-amplification methods with
the specificity of dithizone, Frederickson and co-workers screened
several quinoline-based compounds.
99
In
vitro experiments revealed that 6-methoxy-8-p-toluenesulfonamido-quinoline
(TSQ) had the most intense fluorescence when complexed with Zn2+ as compared to related
molecules. Building on previous work
with Zn2+-containing neurons, this study highlighted the
use of TSQ for selectively labeling Zn2+-rich regions of
the central nervous system for both quantitative estimates of labile
Zn2+ pools and qualitative assessments of localization.
While TSQ improved upon earlier histological stains, it was never
successfully used in live-cell experiments.
Live-cell imaging
of metal ions began not with transition metals,
but with the development of the Ca2+ sensor Quin2 by Roger
Tsien in the early 1980s. At the time, a regulatory role for cytosolic
Ca2+ had been proposed, but measurement of the free Ca2+ concentration in live cells
was a challenging analytical
problem. Tsien and co-workers developed a fluorescent probe with high
affinity for Ca2+ over other ions such as Mg2+ and H+ that had a large increase in
fluorescence intensity
in response to Ca2+ binding,
33
and a way to trap the probe in cells with nonpolar ester groups
that were cleaved by intracellular esterases to reveal membrane-impermeable
carboxylate anions.
37
This new tool allowed
for real-time, noninvasive measurements of cytoplasmic free Ca2+ in intact lymphocytes.
100
Further
optimization of the sensor platform revealed the possibility of systematically
modifying the modular chelate-linker-fluorophore platform and resulted
in the first ratiometric fluorescent sensors for Ca2+.
101
Over 10 years after Quin2 was introduced, a
similar tool became available for Zn2+. Building on the
histofluorescence studies by Frederickson and the probe-trapping technique
pioneered by Tsien, Zalewski and co-workers developed Zinquin by adding
an ethyl ester to the 6-methoxy group of TSQ, improving its solubility
and cellular retention.
102
This new probe,
the first fluorescent transition metal sensor used in live cells,
was used to study the correlation between apoptosis and intracellular
Zn2+ levels. To address some of the shortcomings of Zinquin,
in particular phototoxicity caused by the UV-wavelength excitation
light, many groups have worked on making the plethora of improved
small-molecule sensors for Zn2+ that will be discussed
in section 5. Another major development in
the field was the creation of the first genetically encoded sensor
for a transition metal (also for Zn2+) by the Eide laboratory
in 2006.
103
The design platform was based
on previously developed Ca2+ sensors,
73a
and resulted in a probe that could be introduced into cells,
tissues, or organisms as a DNA fragment that is subsequently transcribed
and translated by cellular machinery into a fully functional sensor.
Shortly thereafter, it was demonstrated that genetically encoded sensors
could be targeted to subcellular compartments,
80
offering the exciting possibility of constructing a complete
map of labile metal ion distribution throughout the cell.
The
historical timeline in Figure 3 illustrates
how studies on Ca2+ set the framework for cellular imaging
of metal ions. Tools for imaging labile Zn2+ have expanded
substantially in the last 10 years. These probes possess a range of
chemical and photophysical properties, and it is now possible to define
the concentration of accessible Zn2+ in the cytosol, nucleus,
ER, Golgi, and mitochondria, and visualize Zn2+ fluxes.
Likewise, the arsenal of fluorescent probes for Cu+ continues
to grow, and these probes are sufficiently sophisticated to permit
imaging Cu+ in vivo. It is also apparent that probes for
other metal ions have lagged substantially behind those for Zn2+ and Cu+. Still developments
in the last two decades
are promising. The lessons learned from the tuning of small-molecule
sensors, as well as the development of genetically encoded sensors,
should prove fruitful for expanding the repertoire of fluorescent
sensors for other transition metals.
5
Probes
for Zinc
5.1
Zinc Homeostasis
Zinc (Zn2+) is ubiquitous in all forms of life and is the second most abundant
transition metal in the human body after iron. Zn2+ is
not redox active in the cellular environment and is present in the
+2 oxidation state.
104
Mammalian cells
sequester high levels of Zn2+ from the extracellular environment:
an average cellular concentration of total Zn2+ in a mammalian
cell is in the hundreds of micromolar range, while the concentration
of Zn2+ in serum or plasma is approximately 1–10
μM.
105
The vast majority of the cellular
Zn2+ pool is bound to proteins, enzymes, metabolites, and
other low molecular weight ligands such that the labile or accessible
pool of Zn2+ in the cell is in the picomolar range.
54b,61a,81b,106
This pool represents biological Zn2+ available for newly
synthesized proteins or potential signaling functions. Bioinformatics
work by Andreini et al. has suggested that up to 10% of the proteins
encoded by the human genome contain a putative Zn2+ binding
motif,
107
underscoring the importance of
Zn2+ in biological systems. Given the importance of Zn2+ in biology and the growing
evidence that Zn2+ levels are both heterogeneous and dynamic, it is perhaps not surprising
that Zn2+ sensors constitute the largest family of fluorescent
indicators for transition metals. In the large arsenal of fluorescent
Zn2+ sensors, there are probes in all three main classes:
small-molecule probes, genetically encoded sensors, and hybrid probes.
Small-molecule sensors constitute the largest class by far, and this
group can be further subdivided into two categories: intensity-based
probes, where Zn2+ binding induces an increase in fluorescence
intensity, or ratiometric probes, where Zn2+ binding shifts
the excitation and/or emission wavelength. There are multiple families
of genetically encoded Zn2+ sensors based on FRET between
two fluorescent proteins, and many of these have been targeted to
different cellular locations. Finally, there are a handful of hybrid
probes, which as the name suggests are a combination of the aforementioned
classes and have both genetically encoded and exogenous elements.
These hybrid probes include small molecules with targeting groups
that interact with specific enzymes and genetically encoded proteins
whose signal output is modulated by binding of a small-molecule fluorophore.
This Review will focus on recent advances in these areas, but we encourage
readers to refer to several recent reviews for further information
regarding the development of Zn2+ probes.
16,17,108
5.2
Small-Molecule
Probes for Zn2+
5.2.1
Intensity-Based Probes
The majority
of small-molecule probes for Zn2+ undergo a change in fluorescence
intensity upon Zn2+ binding. Most of these sensors operate
on the principle of PET between the fluorophore and the metal-binding
group. In the absence of Zn2+, the fluorophore is quenched
by PET from the electron-rich chelating group. Upon binding Zn2+, PET between the
chelating moiety and the fluorophore is
disrupted, leading to an increase in fluorescence emission. Manipulation
of the fluorophore and binding motif platform can tune the efficiency
of PET, affecting the brightness in both the bound and the unbound
states of the sensor and therefore the magnitude of fluorescence change
with Zn2+ binding. This can be accomplished by the incorporation
of electron-withdrawing groups, alteration of the linker between the
chelator and fluorophore, and by changing the nature of the PET “switch”
itself. Table 2 presents a comprehensive list
of the photophysical and biochemical parameters of many current small-molecule
intensity-based Zn2+ sensors.
Early imaging studies
of cellular Zn2+ were carried out with probes based on
the UV-excitable quinoline fluorophore and a sulfonamide Zn2+ chelating group (Figure
4). The use of this
class of probes began with histochemical studies in fixed tissues.
In 1987, Frederickson and co-workers used N-(6-methoxy-8-quinolyl)-p-toluenesulfonamide
to identify a pool of histochemically
reactive Zn2+ in the vesicles of axon boutons.
99
TSQ staining was found to not only correspond
very well with previous studies of Zn2+ visualization in
the brain, but improved on earlier histochemical methods by combining
the sensitivity and resolution of silver-amplification methods (i.e.,
Timm’s stain) with the specificity of dithizone. Building on
the work with TSQ, the related probe Zinquin was developed by Zalewski
and co-workers as a probe of labile Zn2+ in living cells.
102
This study found that decreased labile Zn2+ levels lead to apoptotic events in mammalian
cells. Conversely,
it appeared that increasing cellular Zn2+ levels could
prevent DNA fragmentation upon pharmacological induction of apoptosis.
While these probes permitted visualization of cellular pools of labile
Zn2+ in living cells, they were hampered by their UV-range
excitation wavelength, which leads to photodamage and high background
fluorescence in the cell. Recent work from the Petering lab has demonstrated
that these probes form ternary complexes with Zn2+-containing
proteins.
135
Thus, it appears that instead
of imaging the free or labile pool of Zn2+ within cells,
these probes actually image part of the Zn2+ proteome.
While this indicates such probes do not report on the accessible Zn2+ pool, it suggests
they may have an unintended use in examining
the proteome. It is becoming increasing clear that within the complex
environment of the cell, probes can be involved in interactions that
are difficult to predict based on the conditions used for in vitro
biochemical characterization. Similar studies on other small-molecule
probes have not been reported, but it is possible that other probes
interact with cellular components.
135b
Figure 4
Quinoline-,
fluorescein-, 4-aminonapthalimide-, and BODIPY-based
Zn2+ sensors.
Table 2
Intensity-Based, Small-Molecule Fluorescent
Sensors for Zn2+
excitation
emission
brightnessb
sensor
λfree (nm)
εfree
a
λbound (nm)
εbound
a
λfree (nm)
φfree
λbound (nm)
φbound
free
bound
DRc
K
D (M)
ref
TSQ
380
ND
380
ND
495
ND
495
0.1
ND
ND
100
ND
(99)
Zinquin
370
ND
370
ND
490
ND
490
ND
ND
ND
ND
2.0 × 10⁻¹⁰
(102)
3-Zn
343
7.6
343
6.8
450
0.038
450
0.88
0.2888
5.984
23
5.0 × 10⁻⁷
(109)
ZP1
515
67
507
78
531
0.38
527
0.87
25.46
67.86
3.1
7.0 × 10⁻¹⁰
(110)
ZP2
498
44
490
53
522
0.25
517
0.92
11
48.76
6
5.0 × 10⁻¹⁰
(111)
ZP3
502
75
492
85
521
0.15
516
0.92
11.25
78.2
6
7.0 × 10⁻¹⁰
(112)
ZP4
506
61
495
67
521
0.06
515
0.34
3.66
22.78
5
6.5 × 10⁻¹⁰
(113)
ZP5
504
83
495
91
520
0.29
517
0.48
24.07
43.68
1.6
5.0 × 10⁻¹⁰
(114)
ZP6
506
89
495
98
519
0.1
517
0.34
8.9
33.32
2.7
5.0 × 10⁻¹⁰
(114)
ZP7
505
68
495
77
521
0.04
517
0.05
2.72
3.85
0.4
5.0 × 10⁻¹⁰
(114)
ZP8
500
81
489
78
516
0.03
510
0.35
2.43
27.3
11
6.0 × 10⁻¹⁰
(115)
ZP9
505
51
494
44
526
0.02
521
0.41
1.02
18.04
12
6.9 × 10⁻⁷
(116)
ZP10
506
55
497
45
523
0.08
516
0.33
4.4
14.85
10
1.9 × 10⁻⁶
(116)
ZPF1
533
99
525
120
547
0.11
544
0.55
10.89
66
5
9.0 × 10⁻¹⁰
(112)
ZPCl1
534
97
527
120
550
0.22
549
0.5
21.34
60
1.8
1.1 × 10⁻⁹
(112)
ZPBr1
534
45
528
86
549
0.25
547
0.36
11.25
30.96
1.7
9.0 × 10⁻¹⁰
(112)
ZPF3
520
87
510
93
537
0.14
533
0.6
12.18
55.8
3.6
8.0 × 10⁻¹⁰
(112)
Me2ZP1
515
74
505
80.6
528
0.18
524
0.61
13.32
49.166
4
3.3 × 10⁻⁹
(117)
Me4ZP1
516
56
506
47.4
529
0.17
525
0.35
9.52
16.59
2
6.0 × 10⁻⁷
(117)
ZPP1
505
ND
500
ND
532
0.052
523
0.7
ND
ND
13
5.1 × 10⁻⁹
(118)
DA-ZP1-TPP
510
ND
510
ND
529
0.001
529
0.75
ND
ND
12
6.0 × 10⁻¹⁰
(68)
ZS1
510
83.9
501
75.2
531
0.5
526
0.7
41.95
52.64
1.4
ND
(119)
ZS2
499
66.9
489
67.6
523
0.39
516
0.69
26.091
46.644
2
ND
(119)
ZS3
500
86.9
ND
ND
525
0.71
525
NA
61.699
ND
1
ND
(119)
ZS4
507
81.1
495
ND
522
0.12
520
0.5
9.732
ND
4.5
ND
(119)
ZS5
497
33
490
42
522
0.36
517
0.8
11.88
33.6
4.6
1.5 × 10⁻⁶
(120)
ZS6
515
ND
505
ND
533
0.44
527
0.64
ND
ND
3.3
ND
(120)
ZS7
500
62
490
66
524
0.25
518
0.79
15.5
52.14
2.7
3.7 × 10⁻⁶
(120)
ZSF6
532
63
522
70
549
0.19
545
0.63
11.97
44.1
2
4.6 × 10⁻⁶
(120)
ZSF7
521
62
511
70
535
0.24
527
0.68
14.88
47.6
2.5
5.0 × 10⁻⁶
(120)
QZ1
505
68.9
498
69.8
524
0.024
524
0.78
1.6536
54.444
42
3.3 × 10⁻⁵
(121)
QZ2
499
37.2
489
33.6
520
0.005
518
0.7
0.186
23.52
150
4.1 × 10⁻⁵
(121)
QZ2E
499
27.2
496
16
519
0.004
514
0.73
0.1088
11.68
120
1.8 × 10⁻³
(122)
QZ2A
498
64.1
492
40
515
0.012
515
0.51
0.7692
20.4
30
1.3 × 10⁻⁴
(122)
FluoZin-1
496
ND
496
ND
515
ND
515
ND
ND
ND
200
7.8 × 10⁻⁶
(123)
FluoZin-2
495
ND
495
ND
525
ND
525
ND
ND
ND
12
2.1 × 10⁻⁶
(123)
FluoZin-3
495
ND
495
ND
516
ND
516
ND
ND
ND
200
1.5 × 10⁻⁸
(123)
ZnAF-12
492
74
492
63
514
0.02
514
0.23
1.48
14.49
17
7.8 × 10⁻¹⁰
(124)
ZnAF-23
492
78
492
76
514
0.02
514
0.32
1.56
24.32
51
2.7 × 10⁻⁹
(124)
ZNAF-1F
489
77
492
70
515
0.004
515
0.17
0.308
11.9
69
2.2 × 10⁻⁹
(125)
ZnAF-2F
490
74
492
73
515
0.006
515
0.24
0.444
17.52
60
5.5 × 10⁻⁹
(125)
ZnAF-2M
490
53
492
52
515
0.03
515
0.27
1.59
14.04
6.8
3.8 × 10⁻⁸
(126)
ZnAF-2MM
490
111
493
88
515
0.01
515
0.1
1.11
8.8
12.3
3.9 × 10⁻⁶
(126)
ZnAF-3
490
71
493
62
515
0.03
515
0.38
2.13
23.56
10.4
7.9 × 10⁻⁷
(126)
ZnAF-4
490
68
492
64
515
0.01
515
0.22
0.68
14.08
16.3
2.5 × 10⁻⁵
(126)
ZnAF-5
490
64
492
43
515
0.004
515
0.21
0.256
9.03
34.3
6.0 × 10⁻⁴
(126)
Newport
Green DCF
505
ND
505
ND
535
ND
535
ND
ND
ND
5
4.0 × 10⁻⁵
(127)
Newport
Green PDX
495
ND
495
ND
520
ND
520
ND
ND
ND
ND
3.0 × 10⁻⁴
(123)
ZIMIR
493
73
493
73
515
0.0032
515
0.225
0.2336
16.425
70
4.5 × 10⁻⁶
(69a)
ZnAB
499
ND
499
ND
509
0.003
509
0.058
ND
ND
ND
ND
(128)
BDA
491
19.5
491
18
509
0.077
509
0.857
1.5015
15.426
10.5
1.0 × 10⁻⁹
(129)
WZS
499
17.1
499
17.1
550
0.03
550
0.19
0.513
3.249
6
6.2 × 10⁻¹⁰
(130)
RhodZin-3
550
ND
550
ND
575
ND
575
ND
ND
ND
75
6.5 × 10⁻⁵
(67a)
RA1
535
45
535
1.3
561
0.7
561
0.78
31.5
1.014
ND
1.3 × 10⁻⁶
(131)
ZRL1
569
ND
569
20.8
595
<0.001
595
0.22
ND
4.576
220
7.3 × 10⁻⁵
(132)
Rhod-5f
571
ND
571
ND
594
0.28
594
0.13
ND
ND
11.6
4.1 × 10⁻⁶
(133)
ZBR1
514
19.3
525
26.4
625
0.067
628
0.41
1.2931
10.824
8.4
6.9 × 10⁻¹⁰
(70)
ZBR2
550
16.9
530
25.6
630
0.069
630
0.22
1.1661
5.632
ND
7.0 × 10⁻¹⁰
(70)
ZBR3
530
13.3
535
19.3
623
0.342
628
0.6
4.5486
11.58
ND
1.0 × 10⁻¹²
(70)
DPA-CY
606
150
606
190
800
0.02
800
0.41
3
77.9
20
6.3 × 10⁻⁸
(70)
SiR-Zn
650
98
651
110
665
0.009
665
0.12
0.882
13.2
15
1.4 × 10⁻⁹
(134)
a
Molar extinction coefficients given
as ε/103 M–1 cm–1.
b
Brightness is defined
as the product
of the molar extinction coefficient and the quantum yield (ε
× φ).
c
There is
no systematic way to present
dynamic range (DR), so we encourage readers to refer to the original
publications for more details about this value. For intensity-based
probes, this number is generally the maximum fold change in fluorescence
intensity upon Zn2+ binding. ND, not determined.
To overcome the limitations of these
quinoline-based probes, there
has been a surge in development of sensors based on other fluorophore
platforms. Fluorescein, which has a high quantum yield and lower energy
excitation and emission profiles more amenable for live-cell imaging,
has been used to design numerous Zn2+ sensors. One of the
largest families of fluorescein-based sensors is the Zinpyr or ZP
family (Figure 5). In the past decade, this
family of sensors has undergone extensive tuning of photophysical,
chemical, and thermodynamic properties. The first iteration of this
probe ZP1 featured a di-2-picolylamine (DPA) Zn2+ chelator
and a dichlorofluorescein (DCF) fluorophore.
136
This probe was more suited to live-cell imaging than previous quinoline-based
probes as it featured excitation and emission wavelengths above 490
nm and could be passively incorporated into cells. ZP2 was created
shortly thereafter in an attempt to lay out a more general strategy
for the construction of fluorescein-based sensors.
111
While ZP2 improved upon the dynamic range of its predecessor
(6-fold versus 3.1-fold for ZP1), both probes still had relatively
small changes in fluorescence intensity upon Zn2+ binding
and were pH sensitive. In an effort to control the pH sensitivity
of these sensors, Chang et al. explored the effect of electronegative
substitution on the fluorescein backbone and generated ZP3, a new
probe with a lower pK
a (6.8) as compared
to previous ZP sensors.
112
ZP3 has a dynamic
range similar to that of ZP2, but can be prepared in a single synthetic
step instead of the many steps required for the construction of ZP2.
112
By incorporating a modified Zn2+ binding moiety onto an unsymmetrically functionalized
fluorescein
scaffold, Burdette et al. generated ZP4, a sensor with lower background
fluorescence that formed only mononuclear Zn2+ complexes.
113
It was initially thought that this probe was
unable to cross cell membranes, a property that was exploited for
detailed imaging of damaged neurons: tissue sample preparation allowed
the dye to enter brain slices, but only neurons damaged by Zn2+ release during seizures
showed fluorescent staining. Visualization
of such tissue damage would have been much more difficult with TSQ
or even ZP1, which would stain healthy and damaged neurons indiscriminately.
Follow-up work with ZP4 indicated that it may in fact be able to enter
cells, albeit less efficiently than some other probes.
114
Such studies highlight the need for rigorous
experimentation before assigning localization of any small-molecule
dye. Further work on this asymmetric scaffold led to the development
of ZP5–7 and ZP8, which demonstrated how electron-withdrawing
groups on the Zn2+ binding moiety and fluorophore could
alter pH sensitivity and dynamic range.
114,137
The binding affinity for Zn2+ could be manipulated by
incorporating a pyrrole into the Zn2+-chelating group of
the asymmetric probes (ZP9 and 10) or methylating four pyridyl groups
in the symmetric ZP1 scaffold (Me4ZP1).
116,117
ZPP1, created by replacing one pyridine at each DPA group of ZP1
with a pyrazine, featured lower background fluorescence, increased
dynamic range (13-fold), and decreased affinity for Zn2+ than its predecessor.
118
Figure 5
The ZP family of Zn2+ sensors.
ZP1 has recently been
delivered to the mitochondria by a Zn2+-depended ester
cleavage reaction and tryphenylphosphonium
(TPP) targeting.
68
Addition of a TPP group
is a widely used method of targeting a molecule to the mitochondria,
but this strategy is dependent on mitochondrial membrane potential,
and therefore the respiratory state of the cells can affect probe
localization.
67b,67c
Conjugation of a TPP motif to
the 6-position of the benzoic acid group of diacetylated ZP1 (DA-ZP1-TPP)
allowed for successful delivery of the probe to mitochondria. DA-ZP1-TPP
is nonfluorescent and resistant to intracellular esterases over a
2 h period, but Zn2+-mediated hydrolysis of the acetyl
groups reveals ZP1-TPP, which localizes to mitochondria and has a
12-fold increase in fluorescence intensity in response to Zn2+. Using this probe,
Chyan et al. were able to observe decreased mitochondrial
Zn2+ uptake in cancerous prostate cells lines as compared
to healthy cells.
Concurrent with the development of the ZP
family, the Nagano laboratory
developed another fluorescein-based sensor platform (Figure 4). One issue with early
ZP sensors was high background
fluorescence in the absence of a bound Zn2+ ion, due to
incomplete PET quenching of the fluorophore in the apo-state. In an
effort to reduce this background, the DPA chelating group was attached
to various positions of the benzoic acid moiety.
124
Amino-substituted fluoresceins have a very low quantum
yield, so in the absence of Zn2+ this probe exhibits very
low background fluorescence. The first generation of ZnAF probes,
ZnAF-1 and ZnAF-2, featured low quantum yields in the absence of Zn2+ (0.022 and 0.023,
respectively) and high turn-on responses
to Zn2+ (17-fold and 51-fold increases in fluorescence
intensity, respectively) and a pK
a value
of 6.2 for the phenolic hydroxyl group of the fluorophore. Although
the original probes were not able to cross the cell membrane, diacetyl
derivatives masked the negative charge on the probes, allowing them
to be used to stain intracellular Zn2+. In an effort to
lower the pK
a and further decrease background
fluorescence, ZnAF-1F and ZnAF-2F were created by substitution of
fluorine at the ortho-position of the phenolic hydroxyl group.
125
The probes had extremely low quantum yields
in the absence of Zn2+: 0.004 for ZnAF-1F and 0.006 for
ZnAF-2F. Additionally, Zn2+ binding increased the fluorescence
by 69-fold for ZnAF-1F and 60-fold for ZnAF-2F, yielding some of the
highest turn-on responses available. However, the quantum yields in
the Zn2+-bound state of ZnAF-1F and ZnAF-2F are still fairly
low, rendering the probes somewhat dim for intensity-based sensors.
Addition of the fluorine atoms decreased the pK
a of these probes to 4.9, affording stable fluorescence under
neutral and slightly acidic conditions. Later, a suite of ZnAF probes
with a range of affinities for Zn2+ from 10–10 to 10–3 M were developed by modifying
the Zn2+ chelating group.
126
To our knowledge,
this family of probes still features some of the lowest levels of
background fluorescence and largest magnitude turn-on responses upon
Zn2+ binding of available probes.
Many more intensity-based
Zn2+ probes have been developed
in the past decade using fluorescein and other fluorophores (Figure 4). Several Zn2+
probes have been based
on existing sensors for Ca2+, including FluoZin-3.
123
FluoZin-3 in particular was generated by removing
one of the acetate groups on the well-characterized Ca2+ chelator bis(o-aminophenoxy)-ethane-N,N,N′,N′-tetraacetic
acid (BAPTA) to reduce affinity for Ca2+. FluoZin-3 has high affinity for Zn2+ (K
D 15 nM), shows minimial Ca2+, and approximately
a 200-fold fluorescence increase upon Zn2+ binding. Furthermore,
the FluoZin-3 AM variant is membrane-permeable and trapped in cells
upon cleavage of the AM groups by esterases. FluoZin-3 is a very widely
used small-molecule Zn2+ sensor and has been used in hundreds
of publications. The fluorescein-based dyes Newport Green DCF
127
and Newport Green PDX
123
have been developed with lower affinities for Zn2+ (K
D = 1 μM for DCF and K
D = 30–40 μM for PDX). In addition to the
ZP family, the Lippard lab has also developed the Zinalkylpyr (ZAP),
138
Zinspy (ZS),
119,120
and QZ families
of sensors (Figure 6).
121,122
The ZAP analogues of ZP1 have an alkyl group in place of one of
the Zn2+-binding picolyl moieties.
138
This change increased the quantum yield of the probes in
the Zn2+-free state such that they no longer exhibit a
fluorescent response to Zn2+ binding. Although these analogues
are not useful as live-cell probes, they helped demonstrate how the
picolyl groups were involved in pH-dependent quenching in ZP sensors.
The DPA ligands of the early ZP sensors possess high affinity for
other first row transition metals such as Fe2+ and Cu2+; to improve selectivity, the
ZS family was constructed with
pyridyl-amine-thioether ligands for Zn2+.
119
Early iterations of this sensor platform (ZS1–4)
suffered from high background fluorescence and narrow dynamic range.
To address these issues, the thioether ligands were replaced with
thiophene moieties. These less basic groups are unable to coordinate
Zn2+ and confer both lower background fluorescence (and
thus higher dynamic range) and decreased affinity for Zn2+ to the new probes while
maintaining the improved Zn2+ selectivity of the first ZS sensors. Other modifications
of the
Zn2+-chelating group led to the generation of QZ1 and QZ2,
which used 8-aminoquinoline moieties to bind Zn2+.
121
These sensors have exceptionally large dynamic
ranges (42 and 150, respectively) and micromolar affinities for Zn2+, rendering them
useful for exploring larger pools of labile
Zn2+. Derivatives of these sensors were later generated
that were cell trappable (QZ2E) and cell-impermeable (QZ2A).
122
Figure 6
The ZS, QZ, and ZAP families of Zn2+ sensors.
While the majority of Zn2+ sensors have used a fluorescein-based
scaffold, many sensors have employed other fluorophore platforms,
including coumarin,
109,139
boron dipyrromethene (BODIPY)
derivatives,
128,129
4-aminonapthalimide,
130
rhodamine,
131−134
and tricarbocyanine.
140
The use of coumarins for Zn2+ probes
in live-cell applications has been largely underdeveloped, but a handful
of these probes have been generated and tested in vitro. In particular,
the DPA-coumarin probe 3-Zn2+ has a respectable dynamic
range (23-fold) and good selectivity toward Zn2+, but was
never used in cells.
139
BODIPY-based sensors
are generally less sensitive to pH than those based on fluorescein:
the probe BDA has a very low pK
a (2.1),
high quantum yield in the Zn2+-bound state (0.857), nanomolar
affinity for Zn2+, and was used to visualize Zn2+ in mammalian cells.
129
In the past few
years, several rhodamine-based Zn2+ probes have been developed.
Rhodamine-based platforms feature longer-wavelength excitation and
emission profiles than fluoresceins, generally good quantum yields,
and can be highly photostable. The probes RA1 and Rhod-5f were well-characterized
in vitro, but never used in live cells.
131,133
On the other hand, ZRL1 is cell-permeable and was used to detect
Zn2+ in HeLa cells.
132
One particularly
interesting rhodamine probe contains silicon at the 10 position of
the xanthene chromophore (SiR-Zn).
134
Placement
of the group 14 element in the rhodamine background resulted in a
probe that was active in the near-infrared region (near-IR) while
retaining the high quantum yield and water solubility of original
rhodamines. Near-IR probes are attractive because their low-energy
excitation and emission profiles are well-suited for imaging deeper
in tissues and have reduced interference from cellular autofluoresence.
SiR-Zn features nanomolar affinity for Zn2+, a 15-fold
increase in fluorescence upon Zn2+ binding, and is functional
in cells. Another near-IR probe uses DPA as a Zn2+-binding
group and tricarbocyanine as a fluorophore and was also shown to be
functional in cells.
140
These sensors based
on longer wavelength fluorophores are shown in Figure 7. Expanding the repertoire
of probes for Zn2+ by
exploring new fluorophores opens the possibility of simultaneously
monitoring different metal pools, whether for different metals or
different concentrations of the same metal.
Figure 7
Rhodamine-, resorufin-,
and cyanine-based small-molecule Zn2+ sensors.
One complication with small-molecule sensors is
their unpredictable
localization within a cell. For example, FluoZin-3 AM has been shown
to localize to the cytosol,
141
Golgi,
60
lysosomes,
142
and
vesicles,
143
with different locations in
different cell types.
60
While this has
led to the use of FluoZin-3 for monitoring multiple Zn2+ pools, it can lead to complications
because the probe may report
on Zn2+ within multiple cellular locations. Several strategies
have been used to address this. One of the first available targeted
sensors for Zn2+ was RhodZin-3, which accumulates in active
mitochondria as confirmed by colocalization with MitoTracker dye.
67a,123
This probe was generated by replacing the fluorescein group of FluoZin-3
with the positively charged rhodamine fluorophore, which accumulates
in mitochondria due to the negative membrane potential. However, this
probe requires proper mitochondrial membrane potential for localization,
making it dependent on the metabolic state of the cell.
80
In an effort to design probes with longer-wavelength
excitation
and emission profiles more suitable for prolonged live-cell imaging
experiments, Lin and co-workers developed the benzoresorufin-based
probes ZBR1–3 (Figure 7).
70
Intriguingly, colocalization experiments with
a number of established dyes in several cell lines revealed that these
probes localized spontaneously to the ER. These probes were used to
visualize labile Zn2+ released from the ER in response
to peroxynitrite-induced stress in neural stem cells. Recently, Li
and co-workers developed ZIMIR, a sensor displayed on the extracellular
side of the membrane (Figure 4).
69a
The probe consists of fluorescein attached
to a DPA Zn2+-binding moiety and two dodecyl alkyl chains
that anchor it in the plasma membrane. Because it is not membrane
permeable, the probe remains anchored to the extracellular side of
the cell membrane and was used to detect Zn2+ release from
insulin-secreting cells. An alternative method of localizing sensors
to the plasma membrane was used to construct Palm-ZP1 and Palm-ZQ.
69b
These probes feature a peptide with an N-terminal
palmitoyl group, a polyproline helix, and two Asp residues covalently
attached to Zinpyr-1 (Palm-ZP1) or Zinquin (Palm-ZQ) with a C-terminal
Lys residue. These sensors were used to visualize Zn2+ addition
to the extracellular milieu of HeLa and prostate cells. The modularity
of this approach led to the proposal that this system could, in theory,
be used to attach other peptide targeting motifs to other small-molecule
Zn2+ sensors.
The intensity-based small-molecule
probes described above have
been instrumental in revealing exciting new processes in Zn2+ biology. To emphasize
the kind of information that can be learned
using small-molecule Zn2+ sensors and highlight the complexity
of the studies that can be carried out, we profile four examples of
how small-molecule sensors have transformed our understanding of zinc
homeostasis and signaling. In the first example, ZP1 was used in Arabadopsis to study
the effects of Zn2+-deficiency mutations.
144
Although Zinquin
was previously used to study Zn2+ excretion from the roots
of tobacco,
145
the work by Sinclair et
al. was the first reported use of a small-molecule sensor to visualize
Zn2+ within plants. They studied how Zn2+ localization
in plants was affected by mutations in two transporters that lead
to Zn2+ accumulation in root tissue and a Zn2+-deficient growth phenotype due to lack
of Zn2+ translocation
throughout the plant. Treatment of wild-type seedlings with ZP1 revealed
Zn2+ localization in the xylem, whereas mutant plants showed
high fluorescence in pericycle cells adjacent to the phloem. Furthermore,
treatment with TPEN or exogenous ZnCl2 led to expected
changes in ZP1 fluorescence, indicating that the probe was functional
in Arabadopsis. This work demonstrated
the utility of small-molecule Zn2+ sensor as tools to investigate
Zn2+ homeostasis in plants.
In the next example,
the Kornfeld laboratory used FluoZin-3 to
visualize Zn2+ in the gut granules of C.
elegans,
146
demonstrating
the feasibility of using this small-molecule Zn2+ probe
and imaging Zn2+ in an optically transparent living organism.
By simply incubating C. elegans on
plates supplemented with FluoZin-3 AM, distinct fluorescent puncta
could be seen. Treatment with additional Zn2+ or the Zn2+ chelator N,N,N′,N′-tetrakis-(2-pyridylmethyl)-ethylenediamine
(TPEN) increased or decreased FluoZin-3 fluorescence, respectively,
indicating that the dye was monitoring accessible Zn2+ pools
and not aggregating in the subcellular compartments. The goal of the
study was to define the relationship between cellular storage of excess
Zn2+ and the response to Zn2+ deficiency at
the organismal level. By using the Zn2+ probe in conjunction
with LysoTracker and fluorescent protein fusions of lysosomal proteins,
Kornfeld and co-workers were able to see a remarkable bilobal morphology
of the gut granules when C. elegans were fed a high Zn2+ diet. This led to the hypothesis
that these granules may be storing excess Zn2+ for later
utilization during times of Zn2+ deficiency. To this end,
they investigated the genetic pathway for the formation of these bilobal
granules and showed Zn2+ could be indeed be mobilized from
these cellular stores in response to Zn2+ deficiency. This
result suggested that Zn2+ may be sequestered into these
granules when Zn2+ is abundant (high Zn2+ diet)
and can be mobilized when the worms are switched to a low Zn2+ diet.
In the third example, the O’Halloran laboratory
used FluoZin-3
to study Zn2+ dynamics during oocyte fertilization, demonstrating
the power of time lapse imaging and revealing exquisite Zn2+ transients.
147
Using a cell-impermeable
version of the dye, they were able to observe a release of Zn2+ into the extracellular
environment upon fertilization or
chemical activation. These bursts of Zn2+ were dubbed sparks,
by analogy to Ca2+ sparks produced upon release of Ca2+ from the ER. These sparks
were also associated with an intracellular
Ca2+ signal, which was monitored by using a cell-permeable
Ca2+ probe in conjunction with the impermeable FluoZin-3.
Furthermore, the Zn2+ sparks did not occur without the
Ca2+ transient, suggesting some level of coordination between
the signaling and control of these two metal ions. Using a combination
of X-ray fluorescence microscopy and live-cell imaging with intracellular
FluoZin-3 and Zinquin, the distribution of Zn2+ was mapped
to cortically polarized puncta within the cell. When cellular Zn2+ levels were elevated
by treatment with Zn2+-pyrithione
after activation, the eggs re-established metaphase arrest. Conversely,
chelation of intracellular Zn2+ allowed for cell cycle
resumption. Visualization of the extracellular Zn2+ sparks,
as well as pharmacological manipulation of Zn2+ levels,
gave way to a model where a decrease in Zn2+ availability
for the oocyte is necessary for proper cell cycle resumption after
fertilization.
In a final example, a recent clinical application
of a fluorescent
Zn2+ probe came from the Lippard lab. Ghosh et al. used
a new sensor from the Zinpyr family (ZPP1) to look at Zn2+ levels in prostate cancer.
148
In a cell
culture model, they found significantly decreased ZPP1 fluorescence
in a cancerous versus healthy prostate cell line when Zn2+ was added. Furthermore,
they found ZPP1 fluorescence accumulated
in the prostate of mice injected with ZPP1 by both epifluorescence
whole-body imaging and intravital microscopy of dissected glands.
Co-injection with ZPP1 and Zn2+ chelator revealed that
the sensor responded specifically to Zn2+ in the animals.
The group found substantially decreased ZPP1 fluorescence in a mouse
model of prostate cancer, leading them to suggest that Zn2+ levels could potentially
be used as an imaging biomarker for detection
and progression of prostate cancer.
5.2.2
Ratiometric
Probes for Zn2+
For ratiometric Zn2+ probes, Zn2+ binding
alters the excitation wavelength, emission wavelength, or both. With
such probes, fluorescent images are typically collected at the wavelength
maxima for both the free and the bound states, and fluorescence changes
are reported as a ratio of the fluorescence intensity at the two wavelengths.
While this approach minimizes artifacts from cellular movements, sample
thickness, and sensor concentration, these probes typically have smaller
changes in signal upon Zn2+ binding than intensity-based
probes. Furthermore, acquisition of images at two different wavelengths
requires more sophisticated microscopy instrumentation. However, a
major advantage of this class of probes is that they are more suitable
for accurate quantification of Zn2+ levels.
There
is currently a much more limited repertoire of ratiometric small-molecule
probes than intensity-based ones, likely because of the challenge
in engineering probes that undergo a shift in wavelength upon Zn2+ binding. As such,
this class of probes has undergone far
less optimization in terms of tuning photophysical and Zn2+-binding properties. For
many of these probes, Zn2+ binding
alters the electronic structure of the molecule, thus modifying internal
charge transfer or excited state proton transfer, which in turn affects
the excitation and/or emission profiles.
17b
The Ca2+ sensors fura-2 and indo-1 have been modified
for use as ratiometric Zn2+ sensors. In the presence of
increasing Zn2+ levels, FuraZin exhibits an excitation
wavelength shift from 378 to 330 nm, while IndoZin shifts emission
wavelength from 480 to 395 nm.
123
The O’Halloran
laboratory developed Zinbo-5, a probe built around a fluorescent benzoxazole
core.
149
This probe has nanomolar affinity
for Zn2+, is functional in cells, and can be used in two-photon
experiments. Upon Zn2+ binding, the emission wavelength
undergoes a red shift from 407 to 443 nm. This probe was used to image
exogenously added Zn2+ in fibroblast cells, as well as
Zn2+ fluxes in Plasmodium falciparum parasites.
150
The parameters of these
and a handful of other ratiometric sensors are shown in Table 3.
131,139,151
The Coumazin sensors use a different mechanism: the dyes Zinpyr
(ZP) and coumarin are joined together by an ester linker that can
be cleaved by intracellular esterases upon internalization of the
probe.
152
The esterases split the original
molecule into ZP and coumarin fragments. The ZP fluorescence intensity
changes in response to Zn2+ levels, but the coumarin intensity
stays constant and thus acts as an internal standard. One can take
the ratio of the correct optical channel for each fluorophore, but
careful controls and analysis must be taken to ensure that the dyes
are not differentially localized or extruded from the cell. Representative
ratiometric probes for Zn2+ are shown in Figure 8.
Figure 8
Ratiometric small-molecule Zn2+ sensors.
Table 3
Ratiometric Small-Molecule
Zn2+ Sensors
excitation
emission
brightnessb
name
λfree (nm)
εfree
a
λbound (nm)
εbound
a
λfree (nm)
φfree
λbound (nm)
φbound
free
bound
K
D (M)
DR (R
max/R
min)
ref
FuraZin
378
ND
330
ND
510
ND
510
ND
ND
ND
2.1 × 10⁻⁶
9
(123)
IndoZin
350
ND
350
ND
480
ND
395
ND
ND
ND
3.0 × 10⁻⁶
ND
(123)
ZnAF-R1
359
ND
329
ND
532
0.088
528
0.031
ND
10.199
7.9 × 10⁻¹⁰
ND
(151a)
ZnAF-R2
365
ND
335
ND
495
0.17
495
0.1
ND
33.5
2.8 × 10⁻⁹
7
(151a)
Zinbo-5
337
ND
376
ND
407
0.02
443
0.1
ND
37.6
2.2 × 10⁻⁹
33
(150)
ZNP1
503/539
7.2/6.7
547
ND
528/604
0.02
624
0.05
ND
ND
5.5 × 10⁻¹⁰
17.8
(151b)
RF3
514
9.5
495
4.4
540
0.62
523
0.52
5.89
257.4
2.2 × 10⁻⁵
2.4
(131)
DIPCY
627
70
671
85
758
0.02
765
0.02
1.4
13.42
9.8 × 10⁻⁸
1.5
(151c)
4-Zn
400
16.9
431
ND
484
0.64
505
ND
10816
ND
5.0 × 10⁻⁷
17.8
(139)
CZ1
445
37.2
445
41
488
0.01
488
0.01
0.372
4.45
2.5 × 10⁻¹⁰
8
(152a)
505
38.6
505
38.1
534
0.02
534
0.04
0.772
20.2
CZ2
450
26
448
26.6
490
0.01
490
0.02
0.26
8.96
2.5 × 10⁻¹⁰
4
(152b)
526
22.4
521
24.3
535
0.01
535
0.04
0.224
20.84
a
Molar extinction
coefficients given
as ε/103 M–1 cm–1.
b
Brightness is defined
as the product
of the molar extinction coefficient and the quantum yield (ε
× φ). ND, not determined.
5.3
Genetically Encoded Sensors
for Zn2+
Recently, significant work has led to
the generation of
Zn2+ sensors based entirely on protein or peptide motifs.
Such constructs can be introduced into cells, tissues, or whole organisms
as DNA by transient transfection or viral transduction. The sensors
are then transcribed and translated by the machinery of the cell and
do not require the addition of any exogenous cofactors for functionality.
Currently, all genetically encoded Zn2+ sensors operate
by Förster resonance energy transfer (FRET) between donor and
acceptor fluorescent proteins (FPs). As a general design, the donor
and acceptor FPs are joined by a domain that binds Zn2+ and changes conformation in
such a way that the FRET efficiency
is altered (Figure 9A,B). Thus, changes in
Zn2+ levels can be monitored by changes in FRET efficiency.
Experimentally, researchers excite the donor fluorophore and measure
the resulting emission from the acceptor fluorophore, and then take
the ratio (R) of FRET emission intensity to donor
emission intensity. The ratiometric nature of these sensors means
they can allow for more accurate quantification of labile Zn2+ levels than intensity-based
sensors. The overall sensitivity and
dynamic range are defined by the ΔR and R
max/R
min parameters.
Current genetically encoded Zn2+ sensors and their biophysical
parameters are summarized in Table 4.
Figure 9
Mechanisms
of metal ion sensing by genetically encoded and hybrid
probes for Zn2+. (A) The Zap and Zif families consist of
one or two Zn2+-finger domains between two FPs. Zn2+ binding induces a conformational
change in the Zn2+-finger that leads to a change in FRET ratio. (B) The eCALWY family
uses Zn2+ binding domains from Atox1 and WD4. The two FPs
associate in the absence of Zn2+, but Zn2+ binding
causes association of the binding domains and reduces the FRET efficiency.
(C) The hybrid probe CA-FP has an FP linked to CA. When Zn2+ binds to CA, an exogenously
added dapoxyl sulfonamide (blue hexagon)
can bind to an open site on the Zn2+ ion, leading to a
FRET response between the small-molecule fluorophore and the FP.
The first genetically encoded
sensors to monitor Zn2+ in cells were developed by the
Eide laboratory and consisted of
pairs of Zn2+ fingers from the yeast transcription factor
Zap1 between CFP and YFP.
103
These sensors
were expressed in yeast and demonstrated that manipulation of Zn2+ levels could induce
a change in FRET signal, thus demonstrating
the feasibility of such a sensor platform. Merkx and co-workers introduced
an alternative design strategy in their CALWY family of sensors.
154
Instead of a Zn2+ finger motif that
folds into a compact three-dimensional structure in the presence of
Zn2+, these sensors rely on Zn2+-induced association
of metal-binding domains from the copper ATPase ATP7B (fourth domain
referred to as WD4) and the copper chaperone protein Atox1. The name
of these sensors derives from the molecular components: CFP-Atox1-Linker-WD4-YFP.
Through engineering of the metal binding
domains and linker region, the Merkx group was able to generate a
panel of sensors that was specific for Zn2+ and had a wide
range of affinities. While these first generation sensors were never
tested in cells, they showed the functionality of this platform. By
enhancing the dynamic range, the Merkx laboratory created the eCALWY
family and used these improved sensors to measure cytosolic Zn2+ levels in a variety
of mammalian cell types.
81b
The Palmer lab has continued work on the Zn2+ finger-based sensor platform. Current
sensors include the
ZifCY and ZapCY family that feature single or double Zn2+ fingers derived from the
transcription factors Zif268 or Zap1, respectively,
and a cyan-yellow FRET pair (hence the designation “CY”)
comprised of a truncated CFP and citrine variant of YFP or circularly
permuted Venus FP.
61,80,153
By mutating the metal ion-coordinating residues, the lab has generated
sensors with affinities for Zn2+ that range from a K
d of 2.5 pM to hundreds of micromolar, and used
the sensors to measure Zn2+ in a variety of cell types.
Both the Palmer and the Merkx laboratories have enhanced the dynamic
range and other properties of their sensors by optimizing the linker
between the FPs and Zn2+ binding domains, manipulating
the dimerization tendency of the FPs, and exploring alternate FP FRET
pairs.
Table 4
Genetically Encoded Zn2+ Sensors
FP
excitation
emission
name
donor
acceptor
λdonor
εdonor
a
λacceptor
εacceptor
a
λdonor
.φdonor
λacceptor
φacceptor
K
D (M)
DR (R
max/R
min)
ref
ZifCY1
ECFP
mCitrine
439
32.5
516
77.0
476
0.40
529
0.57
1.0 × 10⁻⁶
1.4
(80)
ZifCY2
ECFP
mCitrine
439
32.5
516
77.0
476
0.40
529
0.57
1.0 × 10⁻⁴
4.0
(80)
ZapCY1
ECFP
mCitrine
439
32.5
516
77.0
476
0.40
529
0.57
2.5 × 10⁻¹²
3.0
(61a)
ZapCY2
ECFP
mCitrine
439
32.5
516
77.0
476
0.40
529
0.57
8.1 × 10⁻¹⁰
1.5
(61a)
eCALWY-1
Cerulean
Citrine
433
43.0
516
77.0
475
0.62
529
0.57
2.0 × 10⁻¹²
2.0
(81b)
eCALWY-2
Cerulean
Citrine
433
43.0
516
77.0
475
0.62
529
0.57
9.0 × 10⁻¹²
2.0
(81b)
eCALWY-3
Cerulean
Citrine
433
43.0
516
77.0
475
0.62
529
0.57
4.5 × 10⁻¹¹
1.7
(81b)
eCALWY-4
Cerulean
Citrine
433
43.0
516
77.0
475
0.62
529
0.57
6.3 × 10⁻¹⁰
2.0
(81b)
eCALWY-5
Cerulean
Citrine
433
43.0
516
77.0
475
0.62
529
0.57
1.8 × 10⁻⁹
1.8
(81b)
eCALWY-6
Cerulean
Citrine
433
43.0
516
77.0
475
0.62
529
0.57
2.9 × 10⁻⁹
1.8
(81b)
eZinCH
Cerulean
Citrine
433
43.0
516
77.0
475
0.62
529
0.57
8.0 × 10⁻⁶
4.0
(81b)
ZapSM2
tSapphire
mKO
399
44.0
548
51.6
511
0.60
559
0.60
ND
1.1
(153)
ZapSR2
tSapphire
tagRFP
399
44.0
555
98.0
511
0.60
584
0.41
ND
1.2
(153)
ZapOC2
mOrange2
mCherry
549
58.0
587
72.0
565
0.60
610
0.022
ND
1.1
(153)
ZapOK2
mOrange2
mKate
549
58.0
588
31.5
565
0.60
635
0.28
ND
1.1
(153)
ZapCmR1.1
Clover
mRuby2
505
111
559
113
515
0.77
600
0.38
ND
1.5
(153)
a
Molar extinction coefficients given
as ε/103 M–1 cm–1. ND, not determined.
While
the majority of genetically encoded Zn2+ sensors
utilize CFP and YFP variants as the FRET pair, there have been recent
attempts to develop alternatively colored sensors based on green-red
or orange-red platforms. Two advantages of this system over the CFP-YFP
platform are an increase in theoretical brightness and ability to
excite the donor with a common 488 nm laser line. Additionally, an
expanded color palette of sensors can allow for simultaneous imaging
of Zn2+ in different subcellular compartments. The Palmer
lab generated sensors that used mOrange2/mCherry as well as Clover/mRuby2,
a newly designed FRET pair.
153,155
These sensors, ZapOC
and ZapCmR, were used in conjunction with ZapCY sensors to monitor
Zn2+ uptake into the nucleus and other organelles simultaneously.
Additionally, the Merkx laboratory developed redCALWY-1 and redCALWY-4
by introducing an R125I mutation in both fluorescent proteins that
promotes self-association of the two FPs.
156
Dimerization of the two FPs and Zn2+-induced association
of the Atox1 and WD4 domains are mutually exclusive, so Zn2+ binding decreases the
FRET ratio of this sensor platform.
A major advantage of genetically encoded sensors is the ability
for relatively easy and precise targeting to specific subcellular
compartments. By incorporating localization sequences such as those
listed in Table 1 into the constructs, the
Palmer lab has been able to target sensors to the cytoplasm, nucleus,
endoplasmic reticulum (ER), Golgi apparatus, mitochondria, and extracellular
side of the plasma membrane in various cell types.
61,80,153
Meanwhile, the Merkx lab targeted their
eCALWY sensors to vesicles by fusing the sensor to the single-pass
transmembrane protein synaptobrevin 2, also known as vesicle-associated
membrane protein 2 (VAMP2).
81b
As emphasized
previously, when using a targeted sensor, it is critical to verify
proper localization by comparing sensor expression with established
organelle markers. Additionally, it is necessary to carefully inspect
images to ensure expression of the sensor does not disrupt proper
organelle structure. For example, Snapp and co-workers have observed
altered ER morphology in cells that express weakly dimerizing FPs
in the secretory pathway.
157
Because
of their ratiometic nature and the fact that they do not
appear to perturb accessible Zn2+ pools, ZapCY sensors
targeted to different organelles within mammalian cells have revealed
substantial heterogeneity in the spatial distribution of accessible
Zn2+ pools. As shown in Figure 10, the level of buffered or accessible Zn2+ in the
ER and
Golgi of HeLa cells is approximately 100-fold lower than in the cytosol,
and the accessible pool is lower still in the matrix of mitochondria.
An important point to consider is that fluorescent sensors only access
a subset of the total Zn2+ pool, the so-called accessible/buffered/labile
pool, and a full accounting of the Zn2+ status of these
organelles would require measurement of the total Zn2+ and/or
the tightly bound pool as a complement to the above studies. Intriguingly,
measurements on different types of cells have revealed different levels
of buffered Zn2+ in different cell types, for example,
a decrease in cytosolic Zn2+ in RWPE1 normal prostate cells
as compared to an increase in a cancerous prostate cell line LNCaP,
60
and an increase in Zn2+ within the
mitochondrial matrix of insulin secreting Min6 cells and neurons as
compared to other cell types measured.
61b
Furthermore, ER-targeted ZapCY1 helped reveal a degree of coregulation
and crosstalk between Ca2+ and Zn2+ in the ER.
61a
Influx of Ca2+ into the cytosol
led to a concomitant loss of Zn2+ from the ER. Similarly,
exogenously added Zn2+ led to Ca2+ release from
the ER. While the precise mechanisms behind these processes are still
unclear, this study provides some direct evidence that fluctuations
in Ca2+ or Zn2+ levels can affect the homeostasis
of other metal ions within the cell.
Figure 10
Heterogeneous distribution of Zn2+ throughout the mammalian
cell. Genetically encoded sensors can be targeted to specific compartments
with a signaling sequence to selectively monitor the Zn2+ pool of that organelle.
5.4
Hybrid Probes for Zn2+
The last class of currently available Zn2+ sensors is
comprised of hybrid probes, which have genetically encoded components
and an exogenous cofactor. Two basic designs have been utilized for
Zn2+ probes: the SNAP-tag system and the carbonic anhydrase
platform. The general features of the SNAP-tag system have been described
elsewhere in detail,
48b,48c,158
and are introduced in section 2.3.3. The
power of this technique is that it allows small-molecule Zn2+ probes to be targeted
to specific cellular locations. While the
Zn2+ sensing and photophysical properties of the particular
probe are unchanged, this strategy does overcome the issues with ambiguous
localization inherent to small-molecule sensors. The Lippard lab used
a BG-conjugated version of ZP1 and targeted it to the mitochondria
and Golgi with the SNAP-tag system, demonstrating the feasibility
of this approach for targeting small-molecule sensors.
50
One potential challenge of this technique is
that modification of a fluorescent probe with the BG moiety can impact
cell permeability, as demonstrated by the Chang lab for fluorescent
probes designed to sense hydrogen peroxide.
52
The second hybrid system is based on a variant of carbonic
anhydrase (CA), an enzyme that binds Zn2+ with a K
D of approximately 4 pM. In elegant molecular
engineering work, the Fierke laboratory was able to tune the specificity
and affinity of CA to create a series of probes that could respond
to physiological concentrations of Zn2+.
159
Early generations of these probes featured a small-molecule
fluorophore covalently linked to carbonic anhydrase. When Zn2+ binds carbonic anhydrase,
a second cofactor (the fluorophore dapoxyl
sulfonamide) binds to an open site on the Zn2+ ion, allowing
energy transfer from the dapoxyl moiety to the fluorophore on the
enzyme. Recently, Zeng et al. reported a long wavelength, emission
ratiometric modification of the carbonic anhydrase Zn2+ sensor that could be amenable
to imaging in tissues.
160
This new system uses Alexa Fluor 594 as a FRET
donor and Chesapeake Blue sulfonamide as the acceptor fluorophore.
One limitation of these versions of the sensor is the requirement
for microinjection or the attachment of cell-penetrating peptides
to introduce it into cells, because covalent attachment of the fluorophore
prevented the probe from being genetically encodable.
40
However, recent iterations have replaced the small-molecule
fluorophore with a FP, thus allowing part of the probe (CA-FP) to
be genetically encoded and transfected into cells. The membrane-permeable
dapoxyl sulfonamide can be added directly to cells to complete the
hybrid system (Figure 9C).
So far, this
platform has been used to image Zn2+ in
both E. coli and in the cytosol and
mitochondria of mammalian cells.
53,161
A CA-RFP
variant was used to measure the median labile Zn2+ concentration
in E. coli at 20 pM,
53b
and to monitor transient spikes in Zn2+ concentration
upon sudden exposure to toxic levels of Zn2+.
161
After exposure to Zn2+ shock, intracellular
free Zn2+ increased to nanomolar levels for approximately
1 h. The activity of the Zn2+-responsive transcription
factor ZntA was also measured in response to Zn2+ shock.
In vitro studies of this transcription factor had previously shown
that it senses femtomolar concentrations of free Zn2+ ions,
but in live bacteria ZntR appeared to be activated by nanomolar Zn2+ spikes. This
difference may be due to competition with and
regulation by other factors within the cell. This study highlights
how measurements of labile Zn2+ levels in live cells can
be coupled with other cellular experiments to more precisely define
protein functions.
6
Probes for Copper
Copper is a trace metal nutrient essential for most forms of life
and is the third most abundant transition metal in humans.
162
Copper serves as a structural and catalytic
cofactor for many proteins and enzymes including important metabolic
factors such as cytochrome c oxidase and copper–zinc
superoxide dismutase.
162b,162c,163
Copper occurs in two oxidation states within biological systems,
either oxidized (Cu2+) or reduced (Cu+). Cu+ is thought to be the dominant oxidation
state of labile copper
in cells, where this speciation is largely ascribed to the function
of membrane reductases that reduce extracellular Cu2+ prior
to import as well as the reducing environment maintained within the
cytosol.
162,164
The redox activity of copper
is critical for several key physiological processes; however, unregulated
levels of copper can induce oxidative stress and toxicity in cells.
Like zinc, dysregulation of copper homeostasis is associated with
disease, including the following neurodegenerative disorders: Alzheimer’s
disease, amyotrophic lateral sclerosis, Menkes disease, Parkinson’s
disease, and Wilson’s disease.
165
Cells must maintain optimal concentrations and speciation of copper
by tightly regulating the uptake, distribution, storage, mobility,
and efflux of this ion. Much of the total cellular copper is associated
with high affinity binding proteins, and what is considered labile
copper is effectively buffered by a plethora of cellular ligands that
minimize free copper ions.
162,164
Live-cell fluorescence
microscopy using copper selective sensors
provides a valuable method to better understand the complex handling
of copper in cells. However, there are added challenges posed by targeting
copper ions over Zn2+ due to the need for selectivity between
different oxidation states, the fluorescence quenching activity of
Cu2+, and the fact that sensors must have high enough affinities
to compete for copper within its biological window (10–21–10–17 M).
166
As a result, only a handful of copper sensors have been generated
for biologically accessible copper. Most of the probes designed for
biological systems target Cu+.
17b
It is noteworthy that a substantial body of work has been devoted
toward production of small molecule, nucleic acid, and protein-based
fluorescent sensors for both mono- and divalent copper; however, this
Review will focus only on the sensors applied to imaging Cu+ in biological systems.
The biophysical parameters of these Cu+ probes are displayed in Table 5.
The first small-molecule sensor for detecting labile copper in
cells, CTAP-1, was developed by the Fahrni group in 2005.
167
CTAP-1 uses an azatetrathiacrown Cu+ binding motif linked to a pyrazoline-based dye
that excites in the
UV region. This sensor is selective for Cu+ over Cu2+ or other cellular ions and displays
up to a 4.6-fold increase
in fluorescence intensity upon Cu+ binding. The fluorescence
enhancement upon Cu+ binding is consistent with a mechanism
that involves modulation of PET between the chelate and fluorophore.
Experiments using fixed NIH 3T3 fibroblast cells stained with CTAP-1
and complemented with organellar costains and X-ray fluorescence microscopy
mapped cellular copper for the first time and showed that labile copper
is localized largely to mitochondria and the Golgi apparatus in these
cell types under acute copper overload.
10b,167
Table 5
Small-Molecule Sensors for Cu+
excitation
emission
brightnessb
sensor
λfree (nm)
εfree
a
λbound (nm)
εbound
a
λfree (nm)
φfree
λbound (nm)
φbound
free
bound
DRc
K
D (M)
ref
CTAP-1
365
ND
365
480
0.003
480
0.14
ND
ND
4.6
4.00 × 10⁻⁸
(167)
CS1
540
30.0
540
40.0
566
0.016
561
0.13
0.48
5.20
10
3.60 × 10⁻¹²
(168)
CS3
550
31.0
540
46.0
560
0.007
548
0.4
0.22
18.40
75
8.90 × 10⁻¹⁴
(169)
RCS1
480
43.0
548
40.0
505, 570
0.002, 0.003
556
0.002, 0.05
0.13
2.00
20
4.00 × 10⁻¹¹
(170)
Mito-CS1
555
28.0
550
26.0
569
0.009
558
0.05
0.25
1.30
10
7.20 × 10⁻¹²
(67c)
ACu1
359
ND
363 (750)*
ND
492
0.028
482
0.13
ND
ND
4
2.00 × 10⁻¹¹
(171)
CS790
760
ND
760
ND
790
0.0042
790
0.072
ND
ND
15
3.00 × 10⁻¹¹
(172)
CTAP-2
ND
ND
396
29.0
ND
ND
508
0.083
ND
2.41
65
4.00 × 10⁻¹²
(71)
Cao Cu-3
696
ND
750
ND
792
ND
ND
ND
ND
ND
9.6
6.10 × 10⁻¹²
(173)
a
Molar extinction coefficients given
as ε/103 M–1 cm–1.
b
Brightness is defined
as the product
of the molar extinction coefficient and the quantum yield (ε
× φ).
c
There is
no systematic way to present
dynamic range (DR), so we encourage readers to refer to the original
publications for more details about this value. For intensity-based
probes, this number is generally the maximum fold change in fluorescence
intensity upon Cu+ binding. ND, not determined.
Soon after this study, the Chang
laboratory presented a live-cell
Cu+ responsive fluorescent probe called Coppersensor-1
(CS1).
168,174
CS1 is composed of a boron-dipyrromethene
(BODIPY) dye platform and a thioether-rich receptor chemically similar
to the azatetratiocrown used by CTAP-1. CS1 is excited and emits in
the visible region, offering decreased phototoxicity as compared to
CTAP-1, and it undergoes a greater increase in fluorescence intensity
in the presence of Cu+ (10-fold vs 4.6-fold). Using CS1,
dynamic changes in copper pools could be visualized in real time during
Cu+ uptake of HEK 293T cells under acute copper overload.
168
However, some challenges associated with the
use of this sensor in neuronal and glial cell lines treated with CuCl2 or Cu(II)(gtsm)
were identified in a recent study by Price
et al., including pH sensitivity and lysosomal uptake.
175
Tuning the BODIPY scaffold of CS1 to
improve optical brightness
and turn-on enhancement produced the second-generation sensor CS3.
169
Exchanging the fluoro substituents with methoxy
groups increased electron density over the fluorophore, yielding a
higher dynamic range and a brighter Cu+–dye complex.
CS3 undergoes a 75-fold increase in fluorescence intensity upon binding
Cu+.
169
These improvements over
the first generation sensors, CTAP-1 and CS1, provided the ability
to detect Cu+ under both basal and depleted levels, whereas
the previous sensors only detected Cu+ overload. In conjunction
with synchrotron-based X-ray fluorescence microscopy, CS3 was successfully
used to reveal that hippocampal neurons redistribute large pools of
copper from somatic regions to peripheral processes upon depolarization.
This study established a link between copper mobilization and calcium
release, suggesting that some aspects of copper regulation might be
correlated with major cell signaling pathways.
Mitochondria
require Cu+ to function due to its role
as an essential cofactor in aerobic respiration.
162a
Cells tightly control Cu+ uptake and transport
to avoid accumulation of reactive free ions. Cu+ is highly
buffered in the cytoplasm and shuttled to mitochondria by chaperone
proteins where it has been shown to collect in the matrix.
176
To monitor the accessible or labile Cu+ pool in the mitochondrial matrix, the Chang
group developed
a mitochondrial-localized sensor, Mito-CS1, using a modified BODIPY
platform, similar to the other CS sensors. By incorporating a TPP
moiety into the CS1 platform, Chang and co-workers were able to monitor
mitochondrial Cu+ in live HEK 293T and human fibroblast
cells.
67c
The results of this study suggest
that cells maintain mitochondrial copper homeostasis in a narrower
range relative to other areas of the cell as mitochondrial Cu+ levels were only moderately
altered as compared to total
Cu+ levels between states of Cu+ deficiency,
mitochondrial metallochaperone malfunction, and healthy cells.
To further the characterization of copper homeostasis and obtain
a more cohesive picture of copper regulation, sensors can be used
to image Cu+ in cells over longer durations as well as
in more complex samples, such as tissues or intact multicellular organisms.
However, as discussed earlier, sensor excitation with short wavelength
light limits the penetration depth, increases cellular autofluorescence,
and inevitably induces photodamage to cells and photobleaching of
the probe. These phenomena limit the usefulness of the above sensors
for long-term imaging or imaging of tissues and organisms. One way
to circumvent these limitations is to use two-photon excitation microscopy.
177
Most of the examples discussed thus far involve
standard microscopy, where two-photon excitation microscopy differs
as a nonlinear optical technique that uses low energy infrared photons.
The first Cu+ selective probe designed specifically for
two-photon excitation, ACu1, uses a naphthalene-based reporter that
can be excited by two near-infrared photons.
171
This is an intensity-based probe that gives rise to a 4-fold change
in fluorescence intensity upon Cu+ binding. ACu1 was successfully
used to visualize Cu+ distribution in rat hippocampal slices
at depths up to 200 μm.
Another way to achieve increased
sample penetration, reduced phototoxicity,
and reduced autofluorescence is by single-photon excitation in the
near-infrared. Using different functionalized tricarbocyanine derivatives,
two near-infrared “turn-on” sensors for Cu+ have recently been developed. One of these,
which we refer to as
Cao Cu-3, after the author and sensor number, uses the thio-rich bis(2-((2-(ethylthio)ethyl)-thio)ethyl)amine
(BETA) moiety as a high affinity receptor for Cu+. Cao
Cu-3 undergoes a 9.6-fold increase in fluorescence upon Cu+ binding and was used to
image labile Cu+ mobilized by
ascorbic acid treatment in MG63 cells.
173
By adjusting the fluorophore of the CS series to a cyanine dye (Cy7)-based
platform, Chang and co-workers produced another far red Cu+ sensor CS790, which as
its name suggests has an emission maximum
at a wavelength of 790 nm.
172
CS790 is
available in an aqueous compatible and membrane permeable acetoxymethyl
ester form (CS790AM) that was used to visualize dynamic copper fluctuations
at endogenous levels in living mice. CS790AM showed promise for monitoring
labile copper in a single mouse over time, tracking different stages
of health and disease. Used in a Wilson disease mouse model (Atp7b–/–), CS790AM showed
atypical copper accumulation
over time, consistent with progression of this disease. As CS790AM
permitted visualization of fluctuations in bioavailable copper in
living animals, it enables the potential for tracking copper accumulation
and distribution throughout disease development.
As with all
metal sensors, there is a continual push to optimize
the photophysical properties of copper sensors as well as features
such as metal-sensor stoichiometry. One recently recognized issue
along these lines concerns many of the current small-molecule copper
sensors: the BODIPY-based CS sensors as well as CTAP-1 can form spontaneous
dimers or colloidal aggregates at low micromolar concentrations in
aqueous solutions.
71
These sensor–sensor
interactions affect the sensitivity and photophysical properties of
the probes. BODIPY dimers show blue-shifted absorption and emission
spectra, and aggregates are completely nonfluorescent. In response
to these findings, the Fahrni group produced a series of new Cu+ selective sensors,
including CTAP-2, which remains monomeric
up to 10 μM in aqueous environments.
71
CTAP-2 contains a modified thiocrown receptor that incorporates
four hydroxymethyl groups and is combined with a triarylpyrazoline
fluorophore functionalized with a solubilizing sulfonate group. CTAP-2
undergoes a 65-fold fluorescence enhancement upon binding Cu+, although the quantum
yield is not improved over other pyrazoline-based
sensors. A great comprehensive review of small-molecule Cu+ sensors discusses in detail
how sensor design corresponds to these
and other observed photophysical properties.
164
Although the above intensity-based probes have been useful
for
visualizing the localization and redistribution of Cu+ in
cells, variations in probe concentrations between cells, heterogeneous
distribution within cells, and issues associated with cell thickness
and movement complicate their use in detecting quantifiable changes
in copper concentrations. These issues can be addressed by ratiometric
imaging. The Chang group developed a small-molecule ratiometric reporter
for Cu+, based on an asymmetric BODIPY platform and referred
to as ratiometric CS1 (RCS1).
170
Upon binding
Cu+, RCS1 undergoes an impressive 20-fold fluorescence
ratio change with excitation and emission in the visible regime. Treatment
of HEK 293T cells with RCS1 enabled monitoring transient increases
in cytosolic Cu+ that originated from intracellular stores
after stimulation with ascorbate.
170
The
molecular sensors for Cu+ are shown in Figure 11.
Figure 11
Molecular Cu+ sensors.
Continuing efforts to expand the palette of ratiometric Cu+ sensors have led to the
generation of a few genetically encodable
Cu+ FRET sensors (Figure 12). FRET-based
sensors can overcome some of the challenges small-molecule fluorophores
face due to water insolubility and cytotoxicity. In addition, genetically
encodable FRET sensors provide the opportunity to target specific
subcellular organelles. The He laboratory has developed three FRET-based
sensors for visualizing cellular Cu+: AMT1-FRET, Ace1-FRET,
and Mac1-FRET.
166b,178
These sensors were constructed
with a cysteine-rich Cu+ binding domain placed between
a CFP and YFP FRET pair (Figure 12A). All three
sensors bind up to four equivalents of Cu+, where the eight
cysteines contained in each copper binding domain form a tetracopper(I)
cluster. The different binding domains that give these sensors their
names derive from different yeast-based Cu+-dependent transcriptional
regulators. Amt1 activates genes for detoxification and efflux in
the presence of excess Cu+. Ace1 is a homologue of Amt1.
In contrast, Mac1 activates the expression of Cu+ uptake
factors during copper depletion.
178
These
three genetically encoded Cu+ sensors offer a range of
affinities, which has enabled quantification of the window of biologically
available copper in yeast (10–21–10–17 M).
166b
Figure 12
Mechanism of metal ion sensing by genetically
encoded probes for
Cu+. (A) AMT1-FRET, Ace1-FRET, and Mac1-FRET have a cysteine-rich
Cu+-binding domain between a CFP/YFP FRET pair such that
metal binding results in an increased FRET signal. (B) Cu+ binding to EGFP-Amt1 distorts
the β-barrel of EGFP and decreases
fluorescence. (C) YFP-Ace1 and related sensors have the Cu+-binding domain of Ace1
inserted between two strands of EYFP. Cu+ binding alters the local environment of
the chromophore and
leads to an increased fluorescent signal. (D) The eCALWY Zn2+ sensor platform can
be tuned for improved selectivity toward Cu+. In the absence of Cu+, association between
two
FPs produces a FRET signal. CU+-induced association between
the metal binding domains of Atox1 and WD4 changes the structure of
the sensor and results in a decreased FRET signal.
More recently, a unique approach has been used
to design a single
FP sensor, EGFP-145Amt1.
179
In this sensor,
the Amt1 Cu+ binding domain was inserted between residues
145 and 146 of EGFP. Cu+ binding induces a structural distortion
of the EGFP β-barrel structure, decreasing the fluorescence
intensity of this sensor by about 50% (Figure 12B).
180
Recently, another single fluorescent
protein Cu+ reporter, YFP-Ace1, was created using a similar
approach.
181
YFP-Ace1 consists of the Cu+ binding domain of Ace1 inserted between the residues
145
and 146 of EYFP. The inserted Cu+ binding domain is positioned
close enough to the fluorophore of EYFP to cause a change in the local
environment and detectably alter its fluorescent properties when Cu+ binds (Figure
12C). In this case,
Cu+ binding results in up to a 40% increase in fluorescence
intensity. YFP-Ace1 was then used to generate a family of sensors
called YAGn, where n denotes the
linker length used to connect the Cu+ binding domain. The
YAGn series offers a variety of Cu+ binding
affinities ranging from 8.29 × 10⁻²¹ to 8.61
× 10–16 M, and was successfully used to visualize
Cu+ in HeLa cells.
Because of the unique coordination
chemistry of transition metals,
binding sites can be manipulated to design sensors selective for one
metal over another. The Merkx lab recently took advantage of the differential
coordination chemistry of Cu+, Cu2+, and Zn2+ to reversibly tweak the affinity of
a Zn2+ sensor
toward Cu+ (Figure 12D).
182
Cu+ preferentially binds to soft
ligands such as the sulfur donors cysteine or methionine and forms
either a 2-coordinate linear or a 3-coordinate trigonal geometry.
162a,182
Cu2+ and Zn2+ will accommodate harder ligands
such as nitrogen donors like histidine or oxygen donors like aspartate
or glutamate. Furthermore, Zn2+ prefers tetrahedral four-coordinate
binding sites.
162a,182
With this in mind, Merkx and
co-workers designed a class of sensors called eCALWYs that combine
two Cu+ binding motifs (ATOX1 and the fourth domain of
ATP7B (WD4)) oriented to form a tetra cysteine Zn2+ binding
site. The small Cu+ binding motifs are separated by a flexible
linker and bridge the FRET pair Cerulean (donor) and Citrine (acceptor).
This unique design was recently shown to be tunable for selecting
either Cu+ or Zn2+. Systematically replacing
the binding site cysteines with methionines produced conformational
variants that regained affinity for Cu+ and lost the ability
to form stable tetrahedral Zn2+ complexes. So far, the
affinities of the eCALWY mutants remain outside the biological window
for Cu+(∼10–15 M); however, they
may be suited for monitoring cells under conditions of extreme Cu+ stress. Table 6
lists some of the
important features of the genetically encoded sensors discussed above.
7
Probes for Iron
7.1
Iron Homeostasis
Iron is the most
abundant transition metal in the human body: the average adult human
contains approximately 3–5 g of this trace element, and the
total cellular concentration is approximately 50–100 μM.
183
Iron is involved in numerous cellular processes
from metabolism, electron transport, and DNA synthesis.
184
In myoglobin and hemoglobin, Fe2+ bound to a heme cofactor is critical for oxygen
transport throughout
the body. Iron is also found in iron–sulfur cluster proteins
(e.g., aconitase), heme enzymes (e.g., cytochrome P450), and nonheme
iron enzymes (e.g., ribonucleotide reductase). Biological iron almost
exclusively exists in the ferrous (Fe2+) or ferric (Fe3+) state, although other oxidation
states are possible during
catalytic cycles. Cells must carefully control iron levels, distribution,
and speciation. Disruption of iron regulation has been linked to disorders
such as anemia, hemochromatosis, and Alzheimer’s.
185
The reduction potential in the cytosol favors
Fe2+ over Fe3+, and, furthermore,
186
Fe3+ is poorly soluble at neutral
pH in aqueous media. On the other hand, free Fe2+ ions
are capable of participating in Fenton chemistry, leading to the generation
of harmful free radicals; therefore, the amount of free Fe2+ in cells must be kept
to a minimum.
187
Table 6
Genetically Encoded Cu+ Sensors
FP
excitation
emission
name
donor
acceptor
λdonor (nm)
εdonor
a
λacceptor (nm)
εacceptor
a
λdonor (nm)
φdonor
λacceptor (nm)
φacceptor
DR (R
max/R
min)
K
D (M)
ref
Amt1-FRET
ECFP
EYFP
439
32.5
514
83.4
476
0.60
527
0.61
ND
2.50 × 10⁻¹⁸
(178)
Ace1-FRET
ECFP
EYFP
439
32.5
514
83.4
476
0.60
527
0.61
ND
4.70 × 10⁻¹⁸
(166b)
Mac1-FRET
ECFP
EYFP
439
32.5
514
83.4
476
0.60
527
0.61
ND
9.70 × 10⁻²⁰
(166b)
eCALWY-C2M/C3M
Cerulean
Citrine
433
43.0
516
77.0
475
0.62
529
0.76
ND
<1 × 10–17
(182)
YAG(n), n = 0
EYFP
ND
514
83.4
ND
ND
527
0.61
ND
ND
ND
8.20 × 10⁻¹⁸
(181)
YAG(n), n = 1
EYFP
ND
514
83.4
ND
ND
527
0.61
ND
ND
ND
2.00 × 10⁻¹⁸
(181)
YAG(n), n = 2
EYFP
ND
514
83.4
ND
ND
527
0.61
ND
ND
ND
1.20 × 10⁻¹⁸
(181)
YAG(n), n = 3
EYFP
ND
514
83.4
ND
ND
527
0.61
ND
ND
ND
4.60 × 10⁻¹⁹
(181)
YAG(n), n = 4
EYFP
ND
514
83.4
ND
ND
527
0.61
ND
ND
ND
3.30 × 10⁻¹⁹
(181)
EGFP-145Amt1
EGFP
ND
484
32.5
ND
ND
507
0.60
ND
ND
ND
4.60 × 10⁻¹⁹
(179)
a
Molar extinction coefficients given
as ε/103 M–1 cm–1. ND, not determined.
The
idea of a labile iron pool was first suggested by Greenberg
and Winthrop in 1946,
188
and later by Jacobs
in 1977,
189
and there has been substantial
interest in defining it further since then.
190
However, in the absence of good methods to monitor this iron pool,
its biological function is not completely clear. Fluorescent probes
are attractive tools to visualize the distribution and speciation
of labile iron. Ideally, such probes should be able to selectively
respond to either Fe2+ or Fe3+ or be able to
detect iron species such as heme–iron or iron–sulfur
clusters. One major challenge with detection of iron using fluorescent
sensors is the paramagnetic quenching nature of both ions; as such,
many early probes for iron exhibit “turn off” fluorescence
response to iron binding. Moreover, probes must be able to distinguish
the two oxidation states of iron. In the last several years, new probes
have been developed for Fe2+ and Fe3+ that may
allow new discoveries regarding cellular iron homeostasis. Although
most of these probes have only been used for modest applications in
living cells so far, further developments on these tools will undoubtedly
yield new insights into iron biology. A summary of the photophysical
properites of a number of iron probes is presented in Table 7.
Table 7
Fluorescent Probes
for Fe2+ and Fe3+
excitation
emission
brightnessb
name
λfree (nm)
εfree
a
λbound (nm)
εbound
a
λfree (nm)
φfree
λbound (nm)
φbound
free
bound
K
D (M)
DRc
ref
calcein
486
ND
486
ND
517
ND
517
ND
ND
ND
2.2 × 10⁻⁷
43%
(191)
Phen Green SK
507
ND
507
ND
532
ND
532
ND
ND
ND
ND
96%
(192)
RhoNox-1
492
24
555
ND
575
0.01
575
0.3
ND
ND
ND
30
(193)
BDP-Cy-Tpy
485
ND
485
ND
507
ND
507
ND
ND
ND
2.5 × 10⁻⁶
ND
(194)
569
ND
596
ND
635
ND
635
ND
ND
ND
AGD
430
5.2
430
ND
480
0.103
480
0.0057
ND
ND
2.4 × 10⁻⁵
33%
(195)
IP1
470
0.4
470
0.4
508
ND
508
ND
ND
ND
ND
ND
(196)
OuYang Fe-1
520
ND
520
ND
561
ND
583
0.13
ND
ND
ND
1000
(197)
NBD-DFO
475
7
475
ND
548
0.79
548
ND
ND
ND
ND
ND
(198)
SF34
491
49.6
491
ND
514
ND
514
ND
ND
ND
ND
77%
(199)
Pyochelin-1
470
ND
470
ND
545
6
545
0.5
ND
ND
1.6 × 10⁻¹¹
290
(200)
Pyochelin-2
470
ND
470
ND
545
ND
545
ND
ND
ND
3.8 × 10⁻²⁰
320
(200)
RNP1
371
ND
371
ND
431
0.004
594
0.14
ND
ND
5 × 10⁻⁵
ND
(201)
a
Molar extinction coefficients given
as ε/103 M–1 cm–1.
b
Brightness is defined
as the product
of the molar extinction coefficient and the quantum yield (ε
× φ).
c
There is
no systematic way to present
dynamic range, so we encourage readers to refer to the original publications
for more details about this value. For turn-on probes, this number
is generally the maximum fold change in fluorescence intensity upon
Fe2+/Fe3+ binding. For turn-off probes, this
is the % quenching of maximal signal upon Fe2+/Fe3+ binding. ND, not determined.
7.2
Early Probes for Labile Iron
Among
the first reports of visualizing the labile iron pool was the use
of calcein, a fluorescein derivative, by Breuer et al. in 1995, and
it is still one of the most common protocols for measuring labile
iron.
191
Cells are loaded with the nonfluorescent,
membrane-permeable acetoxymethyl derivative of calcein. Upon entering
the cell, the ester groups are removed by intracellular enzymes to
reveal the fluorescent calcein probe (Figure 13A). Metal ion binding quenches fluorescence,
and the emission from
the probe can be restored by subsequent addition of a membrane-permeable
iron chelator such as salicylaldehyde isonicotinoylhydrazone (SIH).
In this way, the labile pool of iron can be quantified. This method
suffers from a number of drawbacks: the probe can form redox-active
and potentially toxic complexes with iron,
202
addition of a chelator is required for quantification, and the probe
cannot adequately distinguish between oxidation states. As an alternative,
Petrat et al. used the fluorescein-based probe Phen Green SK (Figure 13B), which includes
a 1,10-phenanthroline chelating
group to study the labile iron pool in cultured hepatocytes.
192,202
This probe has a greater turn-off response to iron than calcein
(93% versus 46% quenching, respectively). Using a novel ex situ confocal
microscopy technique, Petrat et al. measured the concentration of
labile iron in hepatocytes to be approximately 2.5–9.8 μM,
which accounts for roughly 1% of the total iron content. However,
both of these probes are not specific for either Fe2+ or
Fe3+ and can also interact with other metal ions, leading
to an interfering signal.
Figure 13
Calcein (A) and Phen Green SK (B) represent
early fluorescent tools
for visualizing cellular iron homeostasis.
7.3
Probes for Fe2+
Because
of the propensity for Fe2+ to be oxidized to Fe3+ in aerobic aqueous environments,
it has been difficult to design
probes specific for ferrous ions. Two early Fe2+ probes,
pyrene-TEMPO and DansSQ, exhibit turn-on responses to Fe2+ by different mechanisms.
When linked to pyrene, the organic radical
TEMPO quenches fluorescence, but Fe2+ is able to reduce
TEMPO in aqueous solution and restore fluorescence to pyrene.
203
While selective for Fe2+, this probe
has limited application for intact biological systems for two reasons:
the reaction must be carried out in acidic solution, and it can be
triggered by other radicals. DansSQ consists of a dansyl group linked
to styrylquinoline.
204
Binding of Fe2+ disrupts internal charge transfer between the two fragments
and results in a 15-fold increase in fluorescence at 460 nm. However,
the probe is not entirely selective for Fe2+ and is only
soluble in acetonitrile and 10% H2O, making biological
application of DansSQ challenging.
The past few years have seen
a growing number of new Fe2+ probes suitable for live-cell
imaging experiments (Figure 14). The first
turn-on, Fe2+-selective probe that was used in live cells
was developed by Hirayama et al. in 2013.
193
RhoNox-1 is a rhodamine-based probe that makes use of the chemical
reactivity of Fe2+: the metal ion reduces an N-oxide group on the probe to reveal
a tertiary amine. This reaction
does not occur in the presence of Fe3+. Cells treated with
a chelator displayed significantly lower levels of fluorescence than
untreated cells, indicating that RhoNox-1 was able to detect endogenous
levels of Fe2+. Co-localization experiments revealed that
this probe localized to the Golgi apparatus. Despite the attractiveness
of a Fe2+-selective sensor for live-cell imaging, the mechanism
of sensing was not shown to be reversible, limiting the ability of
RhoNox-1 to monitor fluxes in labile Fe2+ levels. Another
Fe2+ sensor has been developed by the Chang laboratory
that utilizes a biomimetic oxidative dealkylation to reveal a fluorescent
fluorescein derivative.
196
Iron probe 1
(IP1) is selective for Fe2+ over other metal ions at their
biological concentrations and can detect endogenous levels of labile
Fe2+. Furthermore, IRP1 was used to demonstrate elevated
intracellular labile Fe2+ levels in a liver cell line caused
by treatment with hepcidin or ascorbic acid. However, like RhoNox-1,
this reaction-based probe was not shown have a reversible mode of
detection. AGD is a coumarin-based probe with 2-amino-2-(hydroxylmethyl)propane-1,3-diol
as a ferrous binding domain that has a fluorescence quenching response
to Fe2+ binding.
195
While selective
for Fe2+ over other transition metal ions, the probe still
exhibited some quenching by excess Fe3+. This probe appeared
to be concentrated to the plasma membrane, an idea that was supported
by molecular dynamics simulations. This probe was used in cells to
detect exogenously added ferric nitriloacetic acid complexes. Fluorescence
was restored by treatment with bipyridyl and quenched by subsequent
addition of ferrous ammonium sulfate, demonstrating the reversible
mode of action of this sensor.
Figure 14
Small-molecule Fe2+ sensors.
Li and co-workers developed a
new ratiometric sensor for Fe2+, BDP-Cy-Tpy.
194,205
As described in previous
sections, dual-emission ratiometric probes have the advantages of
minimizing artifacts from cellular movement, variable sample thickness,
and sensor concentration. This probe links the near-IR fluorophore
cyanine (Cy) to the Fe2+-binding group 4′-(aminomethylphenyl)-2,2′,6′,2″-terpyridine
(Tpy) such that Fe2+ binding leads to PET-induced quenching
of Cy fluorescence. The probe also features a BODIPY fluorophore that
is unaffected by the presence of metal ions. This sensor was used
in mammalian cells to monitor an ascorbic acid-induced increase in
labile Fe2+ levels.
7.4
Probes
for Fe3+
In contrast
to the relatively small number of Fe2+ probes available,
there are many probes selective for Fe3+. A recent review
by Sahoo et al. exhaustively profiles the development of molecular
and supramolecular probes for Fe3+; however, the vast majority
of these have not been used for biological investigations and will
not be included in this Review.
206
A representative
sample of Fe3+ sensors is shown in Figure 15. Some microorganisms, especially bacteria
and some fungi,
produce siderophores to scavenge Fe3+ from their environments.
Uptake of this essential nutrient is hampered by the very low solubility
of the Fe3+ ion in oxidizing environments such as the sea
or soil. Secreted siderophores form soluble complexes with Fe3+ that can then be taken
up by the organism by active transport
mechanisms. These compounds are among the tightest known binders of
Fe3+, and have been exploited to develop several fluorescent
probes for this ion. One of the first reported fluorescent sensors
for iron was modeled on the siderophore desferrioxamine B (DFO) linked
to the fluorophore 7-nitrobenz-2-oxa-1,3-diazole (NBD).
198
This probe, appropriately designated NBD-DFO,
was demonstrated to extract metals from Fe3+-loaded siderophores
and ferriproteins in vitro. Addition of the hydrophobic fluorophore
improved the membrane permeability of the probe over DFO alone, and
thus NBD-DFO could be used to monitor Fe3+ extraction in
cultured hepatoma cells. Although the probe was not used in imaging
experiments, Fe3+ extraction could be quantified by measuring
NBD-DFO fluorescence in a cuvette in a fluorometer. This probe was
also used to monitor Fe3+ uptake in cotton (Gossypium spp.) and maize (Zea mays L.)
plants.
207
DFO has also been conjugated
to other fluorophores: for example, fluorescein-DFO has been used
to assess the presence of serum Fe3+ in patients undergoing
chelation therapy.
208
Figure 15
Small-molecule Fe3+ sensors.
Two new siderophore-based
probes have been developed on the basis
of pyochelin, a molecule produced by the Gram-negative bacteria Pseudomonas aeruginosa
and Burkholderia
cepacia.
200
These probes
feature a 4-nitro-benzo[1,2,5]oxadiazole (NBD) fluorophore and exhibit
a fluorescence increase upon Fe3+ binding. On the basis
of quantum yield measurements, it was speculated that pyochelin quenches
the fluorescence of the NBD group, but in the presence of Fe3+, the intrinsic fluorescence
of the siderophore is completely quenched.
The end result of Fe3+ binding is an increase in NBD fluorescence.
Wild-type bacteria were able to uptake the probes, but a strain lacking
the appropriate outer membrane receptor for the siderophore were not
labeled. It should be noted that the physiological role of pyochelin
is not completely clear, and recent studies have re-evaluated the
affinity of this molecule for Fe3+, Cu2+, and
Zn2+.
209
These or similar tools
could nevertheless be useful for exploring siderophore-dependent uptake
pathways. Fakih et al. introduced a fluorescein-based probe, SF34,
with a 3-hydroxy-4-one Fe3+ chelating unit.
199
The fluorescence of SF34 is quenched by 77.4%
upon Fe3+ binding and is selective for ferric ions over
other biological metals including Zn2+, Ca2+, and Mg2+. While the probe could be introduced
into mammalian
cells, the charged nature of the molecule led to the proposal that
it was engulfed by pinocytosis or macropinocytosis and unable to diffuse
across the plasma membrane. Further analysis revealed that the probe
was concentrated in an endosomal or lysosomal compartment. Probes
for this compartment, which may be involved in trafficking and storage
of labile iron,
210
have not been previously
available. Additionally, SF34 was used to monitor the compartment-specific
effects of different chelating agents on iron homeostasis.
Several
“turn-on” fluorescent probes for Fe3+ have
been developed on the basis of the equilibrium between a nonfluorescent
spirolactam and fluorescent ring-opened amide forms of rhodamine.
The basic premise of such probes is that Fe3+ can shift
the equilibrium toward the ring-opened form, leading to an increase
in fluorescence intensity. In the past few years, several groups have
developed variants of these rhodamine-based probes by exploring the
use of different chelating groups.
211
Although
these studies have generated a new series of probes and demonstrated
some degree of modularity for the rhodamine-based platform, the biological
applications of these probes have been mostly limited to proof-of-principle
detection of exogenously added Fe3+ in cells. Recently,
OuYang et al. developed a novel optical-electrochemical multichannel
sensor for Fe3+.
197
Some rhodamine-based
sensors are subject to interference by Cr3+, but the multichannel
nature of this probe allowed OuYang et al. to use differential pulse
voltammetry to understand the different electrochemical responses
to these two ions. A ratiometric sensor, RNP1, has also been developed
featuring a naphthalene chromophore attached to the rhodamine backbone.
212
In the presence of Fe3+, emission
from naphthalene can excite rhodamine via FRET, giving rise to ratiometric
signals. Furthermore, the probe localizes to mitochondria because
of its TPP group. The probe was functional in cells and could detect
exogenously loaded Fe3+ in mitochondria. Although iron
probes have not been as thoroughly investigated and optimized as probes
for zinc and copper, these recent developments will undoubtedly set
the foundation for future imaging studies of the labile iron pool
in living cells, tissues, and eventually whole organisms.
8
Available Fluorescent Probes for Other Biological
Metals
8.1
Manganese (Mn2+)
Manganese
is one of the most abundant elements in the earth’s crust,
213
and it is an essential micronutrient to all
three kingdoms of life.
214
Manganese is
a necessary cofactor for a variety of critical biological processes,
such as oxygen evolution in chloroplasts, maintenance of redox balance
in mitochondria, formation of deoxyribonucleotides from ribonucleotides,
thus generating the essential building blocks for DNA synthesis, and
many other enzymatic transformations. In addition, there is growing
evidence that manganese plays a role in cellular adaptation to oxidative
stress,
215
215
vesicle trafficking in mammalian cells,
216
and neuron function.
217
217
While manganese can exist in a variety of oxidation states,
the most abundant form in cells is presumed to be Mn2+.
As with most metals, excess Mn2+ is toxic. One of the primary
sites of toxicity in humans is the brain, where it has been known
for over 150 years that Mn2+ is a neurotoxic agent, and
manganese overload gives rise to a neurological disorder that resembles
Parkinson’s disease.
217
The drive
to better understand the cellular distribution of manganese and follow
the flux of manganese in cells and intact organisms has led to progress
in recent years in the development of selective and sensitive fluorescent
probes for detection and quantification of Mn2+ (Figure 16).
Figure 16
Molecular sensors for the biological metals Mn2+, Ni2+, and Co2+.
Historically, techniques for free Mn2+ detection
have
been available using atomic absorption,
218
ion chromatography,
219
or capillary zone
electrophoresis.
220
A few colorimetric
probes have also been used to detect Mn2+ in aqueous samples.
These are based on photochemical oxidation reactions catalyzed by
the presence of Mn2+.
219,221
However,
only recently have fluorescent tools become available for detecting
Mn2+ (Table 8). The development
of selective “turn-on” sensors for Mn2+ has
been limited due to the fact that paramagnetic Mn2+ quenches
fluorescence. In addition, Mn2+ is 3d5 and can
be difficult to distinguish from other metal ions, and can compete
with Mg2+ and Ca2+, which are far more abundant
in cells, posing a direct challenge for the selectivity of all Mn2+ sensors.
Table 8
Fluorescent Sensors for Ni2+, Mg2+, and Co2+
excitation
emission
brightnessb
sensor
λfree (nm)
εfree
a
λbound (nm)
εbound
a
λfree (nm)
φfree
λbound (nm)
φbound
free
bound
DRc
K
D (M)
ref
NS1
495
5.8
495
5.5
507
0.002
507
0.055
0.01
0.30
25
1.90 × 10⁻⁸
(222)
Liang
Mn-1
256
ND
256
ND
286
ND
286
ND
ND
ND
ND
2.40 × 10⁻⁹
(223)
Liang
Mn-2
493
ND
493
ND
519
0.1
519
0.37
ND
ND
ND
9.70 × 10⁻⁸
(223)
Liang
Mn-3
505
ND
505
ND
530
0.13
530
0.49
ND
ND
2.4
1.00 × 10⁻⁸
(223)
Lin
Co-1
340/429
ND
340/429
ND
430/606
ND
430/606
ND
ND
ND
85
7.9 × 10⁻¹²
(224)
a
Molar extinction coefficients given
as ε/103 M–1 cm–1.
b
Brightness is defined
as the product
of the molar extinction coefficient and the quantum yield (ε
× φ).
c
There is
no systematic way to present
dynamic range (DR), so we encourage readers to refer to the original
publications for more details about this value. For intensity-based
probes, this number is generally the maximum fold change in fluorescence
intensity upon metal ion binding. ND, not determined.
One method of fluorescent detection
of free Mn2+ described
by the Canary laboratory in 2009 involves an ion displacement reaction.
This multicomponent sensory system uses Mn2+ to displace
Zn2+ from a chelating agent for a turn-on fluorescence
response.
225
The chelator EGTA is used
as a masking agent that prevents Zn2+ binding to a small-molecule
fluorescent Zn2+ reporter such as PAR. Under favorable
conditions, Mn2+ displaces Zn2+ from the EGTA
chelator, and the liberated Zn2+ then reacts with PAR to
form a fluorescent complex. In an indirect manor, this multicomponent
system effectively detects Mn2+ using fluorescence response.
Although this specific system is not applicable for use in cells due
to lack of selectivity over Ca2+, later an analogous technique
was employed for detecting Mn2+ in HEK and DMT-1 cells treated with exogenous Mn2+.
180
Additionally, the Canary group presented a more direct
sensor design for Mn2+ based on the Ca2+ indicator
calcium green.
223
Calcium green includes
a BAPTA (1,2-bis(o-aminophenoxy)ethane-N,N,N,N-tetraacetic
acid) chelating group that was tuned for Mn2+ selectivity
by substitution of carboxylate groups with pyridines. The resulting
family of Mn2+ sensors (Liang Mn-1–Liang Mn-3) was
shown to be 2.3–4.8 times more selective for Mn2+ over Ca2+ and was used to detect
endogenous levels of
Mn2+ in HeLa cells as well as HeLa cells treated with micromolar
MnCl2.
Another group offered a pH-dependent recognition
technique that
uses quantum dot (QD) fluorescence quenching to discriminate between
Mn2+ and Cu2+ in vitro.
226
Mn2+ diffusion and adsorption onto the surface
of the QDs was found to be highly pH sensitive. Additionally, the
energy transfer from the QDs to Mn2+ is pH-dependent. Because
the mechanism of QD fluorescence sensing for Mn2+ is strongly
pH dependent, where the sensing of Cu2+ is less pH sensitive,
a recognizable detection of the two ions is possible by adjusting
solution pH. For example, selective detection of Cu2+ by
QD fluorescence can be achieved by using pH conditions that are outside
of the Mn2+ responsive window. Measuring the sample at
both Mn2+-sensitive and Mn2+-insensitive pH
and deducting the previously measured influence of Cu2+ then reveals the fluorescence
response of Mn2+. Although
this platform was only utilized in vitro, it is one of the few metal
sensor platforms to make use of quantum dots and may help inform the
design of sensors that are ultimately biocompatible.
Recently,
a unique bipyrene-functionalized graphene sensor for
Mn2+ detection in cells was presented. The pyrene derivative
1,2-bis-(2-pyren-1-ylmethylamino-ethoxy) ethane (NPEY) was synthesized
and associated with the surface of graphene nanosheets (GNs) through
π–π stacking interactions, which provided a turn-on
fluorescent sensor for Mn2+ (NPEY-GNs).
227
In the absence of Mn2+, the interaction between
NPEY and the GNs renders the NPEY dye nonfluorescent. Mn2+ binding disrupts the direct
π–π stacking interactions
and produces a fluorescence response. NPEY-GNs was applied both as
a turn-on fluorescence sensor for Mn2+ in vitro as well
as in living HeLa cells.
8.2
Nickel (Ni2+)
Nickel is
an essential cofactor for a variety of enzymes that play important
roles in microorganisms (bacteria, archea, fungi, algea)
228
and plants, particularly in energy and nitrogen
metabolism.
229
As compared to other biological
metals, nickel is used at low levels; its use is relatively widespread
in microorganisms but more limited in eukaryotes.
230
Yet, there are very few Ni2+ selective indicators
for live-cell imaging (Table 8 and Figure 16). The Chang group presented one of the
first and
only fluorescent sensors for cellular Ni2+, Nickelsensor-1
(NS1).
222
NS1 is composed of a BODIPY-derived
fluorophore conjugated to a mixed N/O/S receptor. This probe displays
a 25-fold increase in fluorescence upon binding Ni2+, although
it binds with relatively low affinity (K
d = 193 μM). NS1 staining of human lung carcinoma A549 cells
incubated in extracellular NiCl2 (1 mM) was able to display
an increase in the intracellular Ni2+, suggesting the sensor
can detect increases over basal Ni2+ levels in mammalian
cells. NS1 remains a platform from which more Ni2+ sensors
can be modeled to achieve Ni2+ detection in live cells
with higher dynamic range and altered affinities, for application
in microorganisms.
Table 9
Small-Molecule Toxic Metal Probes
excitation
emission
brightnessb
sensor
λfree (nm)
εfree
a
λbound (nm)
εbound
a
λfree (nm)
φfree
λbound (nm)
φbound
free
bound
DRc
K
D (M)
ref
Lead (Pb2+)
LF1
490
25.0
490
28.0
514
0.001
514
0.013
0.03
0.36
18
2.3 × 10⁻⁷
(231)
Leamium
490
520
Cadmium (Cd2+)
Liu Cd-1
503
80.0
503
80.0
518
0.006
518
ND
0.48
ND
2
8.1 × 10⁻⁶
(232)
Peng
Cd-1
600
ND
571
ND
656
0.12
597
0.59
ND
ND
ND
5–7 × 10⁻⁵
(233)
Cheng
Cd-1
550
ND
550
ND
578
0.003
578
0.3
ND
ND
195
6.0 × 10⁻⁷
(234)
Mameli Cd-L
332
37.0
332
ND
510
0.0001
510
ND
ND
ND
13
1.0 × 10⁻⁶
(235)
DBITA
362
ND
362
ND
493/534
0.18
493/587
0.42
ND
ND
3
2.5 × 10⁻¹³
(236)
DQCd1
405
ND
405
ND
558
0.15
495
0.11
ND
ND
15
4.1 × 10⁻¹³
(237)
CYP-1
766
158.0
766
156.0
791
0.0012
791
0.035
0.19
5.46
ND
4.4 × 10⁻⁷
(238)
CYP-2
771
152.0
771
147.0
793
0.0059
793
0.015
0.90
2.21
ND
5.0 × 10⁻⁶
(238)
Mercury (Hg2+)
8H-BDP
470
ND
470
ND
509
0.002
509
ND
ND
ND
27
6.3 × 10⁻¹⁹
(239)
MF1
485
20.0
495
49.0
514
0.001
517
0.16
0.02
7.84
170
7.0 × 10⁻¹¹
(240)
Hatai
Hg-1
340
ND
340
ND
590
0.022
540
0.4
ND
ND
19
8.0 × 10⁻⁷
(241)
Zhao
Hg-1
530
ND
530
ND
586
ND
586
ND
ND
ND
1200
4.6 × 10⁻⁷
(242)
RG1
500
ND
500
ND
550
ND
550
0.48
ND
ND
ND
2.0 × 10⁻⁶
(243)
Lin
Hg-1
500
ND
500
ND
561
ND
561
ND
ND
ND
1000
2.5 × 10⁻⁵
(244)
RS1
500
ND
500
ND
564
ND
564
ND
ND
ND
120
1.9 × 10⁻⁶
(245)
reaction-based
Hg2+ probes
λ-unreacted (nm)
ε-unreacted
λ-reacted (nm)
ε-reacted
λ-unreacted (nm)
Φ-unreacted
λ-reacted (nm)
Φ-reacted
unreacted
reacted
DRc
detection
limit (M)
RBPH
530
ND
530
ND
630
ND
580
0.61
ND
ND
ND
1.9 × 10⁻⁷
(246)
RBC1
365
ND
365
ND
468/590
0.31/ND
590
ND/0.13
ND
ND
240
2.1 × 10⁻⁹
(247)
a
Molar extinction coefficients given
as ε/103 M–1 cm–1.
b
Brightness is defined
as the product
of the molar extinction coefficient and the quantum yield (ε
× φ).
c
There is
no systematic way to present
dynamic range (DR), so we encourage
readers to refer to the original publications for more details about
this value. For intensity-based probes, this number is generally the
maximum fold change in fluorescence intensity upon metal ion binding.
ND, not determined.
8.3
Cobalt (Co2+)
Co2+ is an essential
trace element for all organisms; however, it occurs
less frequently in nature than other transition metals.
213,248
Biological forms of Co2+ are dominantly found in corrinoid
metal complexes.
249
Corrinoid rings are
porphyrin-like prosthetic groups essential for the function of biologically
significant metalloenzymes found throughout bacteria and eukarya.
Co2+ associated corrinoid metalloenzymes catalyze events
like electron transfer, transmethylation, and rearrangement reactions.
Most notably among these is cobalamin (vitamin B12). Cobalamin is
an essential coenzyme for a wide range of metabolic processes as well
as DNA synthesis.
250
In animals it is required
for red blood cell formation, growth and development, and maintenance
of the nervous system.
249
However, consistent
with all redox-active metal ions, unregulated Co2+ is toxic
to cells. Co2+ toxicity can arise from the generation of
reactive oxygen species (ROS), but more commonly it is due to competition
with other biologically essential metal ions.
249,251
In humans, this toxicity is associated with various diseases and
conditions including allergic asthma, contact dermatitis, pneumonia,
and even cancer.
249,251
The underlying mechanisms
of how Co2+ is regulated by cells in both healthy and disease
states remain poorly understood. Very few chemical probes for fluorescence
or colorimetric cobalt detection in cells have been reported to date
(Figure 16), in part due to the quenching nature
of this paramagnetic ion. In an effort to circumvent this problem,
Cobalt probe 1 (CP1)
252
was designed using
a reaction-based strategy to exploit the redox activity of Co2+. The CP1 probe features
a fluorescein dye linked to a polypyridine-based
ligand and is only weakly fluorescent in the absence of Co2+. C–O bond cleavage mediated
by Co2+ affords an
18-fold increase in fluorescence by releasing the ligand and reconstituting
the fully conjugated fluorescein fluorophore. CP1 was used to selectively
detect aqueous Co2+ as well as endogenous cellular and
Co2+ treated A549 human carcinoma cells. The parameters
of this probe are listed in Table 8. Another
type of Co2+ sensor is Lin Co-1, a small-molecule FRET
sensor derived from coumarin-conjugated porphyrins.
224
A series of these sensors were developed so that in the
absence of Co2+, the donor excitation energy from coumarin
is efficiently transferred to the porphyrin acceptor. Upon Co2+ coordination to the
porphyrin component, there is a detectable
decrease in FRET efficiency. In addition to this ratiometric fluorescence
response, these sensors can be used for colorometric detection of
Co2+. The free probe displays a red color; however, upon
Co2+ binding, the color dramatically shifts to blue, the
emission color of the coumarin component.
9
Probes
for Toxic Metals
9.1
Lead (Pb2+)
Pb2+ poses a serious health hazard because it is directly
sequestered
by cells from the environment and even at very low concentrations
(15 ppb) interferes with numerous processes that ultimately result
in toxicity.
253
The increasing concern
about the neurological, cardiovascular, reproductive, and developmental
effects of Pb2+ in humans has prompted investigations into
the primary molecular targets and mechanisms responsible for Pb2+ toxicity. It has
been suggested that Pb2+ is
able to enter cells by a variety of mechanisms, including the use
of uptake and transport pathways of essential metal ions.
253
Pb2+ then interacts with a host
of proteins by either mimicking or antagonizing the physiological
effects of divalent metals, predominantly Ca2+ and Zn2+. Some of the factors susceptible
to Pb2+ include
voltage-gated ion channels, ligand-gated ion channels, calmodulin,
protein kinase C, calcineurin, Ca2+/calmodulin-dependent
protein kinase II, and synaptotagmin.
254
However, unraveling more mechanistic detail on the effects of Pb2+ toxicity has been
hindered by the lack of reliable tools
for monitoring intracellular tracking and quantification.
The
probes for selective fluorescence detection of cellular Pb2+ are few (Figure 17).
However, a number of
fluorescent sensors for aqueous Pb2+ have been developed
over recent years. Some of these contain unique platforms consisting
of fluorophore and peptide,
255
protein
and DNA duplex,
256
DNAzyme,
257
and nanoparticles.
258
A review of the sensors used for environmental detection or other
non-cell-based applications has been published previously.
259
Figure 17
Molecular sensors for the toxic metals Pb2+, Cd2+, and Hg2+.
One of the early small-molecule-based sensors applied to
imaging
Pb2+ in live cells, Leadfluor-1 (LF1), combines a Pb2+-selective dicarboxylate pseudocrown
ether and a fluorescein-like
xanthenone reporter that undergo an 18-fold fluorescence enhancement
upon binding.
231,260
LF1 forms a 1:1 complex with
Pb2+ with micromolar affinity. Even though LF1 is not sensitive
enough to track toxicologically relevant concentrations (15 ppb per
EPA standards), studies using confocal microscopy revealed that it
is capable of monitoring changes in cytosolic Pb2+ within
living cells.
231,260
Additionally, the commercially
available probe Leadmium is available in a cell-permeant form that
becomes fluorescent in the presence of nanomolar levels of Pb2+ and micromolar levels
of Cd2+. Photophysical
properites of molecular Pb2+ probes are given in Table 9.
More recently, a genetically encoded FRET-based
Pb2+ sensor, Met-lead 1.59, was developed for cellular
detection (Table 10).
211c
Met-lead 1.59
consists of an ECFP with the last 11 amino acids deleted (ECFPΔC11)
and cp173Venus FRET pair connected by a Pb2+ binding domain
derived from the bacterial metalloregulatory protein PbrR. Live-cell
imaging of HEK293 cells transfected with Met-lead 1.59 and exposed
to high concentrations (10–50 μM) of Pb2+ showed
that this sensor was able to detect cellular increase after a delay
time of a few hours.
211c
The development
of new and more sensitive genetically encoded FRET sensors is a promising
direction for the cellular detection of Pb2+.
Table 10
Genetically Encoded Toxic Metal Sensors
FP
excitation
emission
name
donor
acceptor
λdonor(nm)
εdonor
a
λacceptor (nm)
εacceptor
a
λdonor (nm)
φdonor
λacceptor (nm)
φacceptor
DR (R
max/R
min)
K
D (M)
ref
Met-lead 1.59
ECFP(ΔC11)
cp173Venus
439
32.5
ND
ND
476
0.40
535
ND
1.49
69 × 10–9/22 × 10–6
(211c)
Met-lead
2.58
ECFP(ΔC11)
cp173Venus
439
32.5
ND
ND
476
0.40
535
ND
1.46
18 × 10–9/20 × 10–6
(211c)
Met-lead
3.62
ECFP(ΔC11)
cp173Venus
439
32.5
ND
ND
476
0.40
535
ND
1.18
15 × 10–10/74 × 10–6
(211c)
Cd-FRET-1
Cerulean
Citrine
433
43.0
516
0.77
475
0.62
529
0.76
2
1.5 × 10⁻¹⁰
(261)
Cd-FRET-2
Cerulean
Citrine
433
43.0
516
0.77
475
0.62
529
0.76
1.3
1.0 × 10⁻⁸
(261)
Cd-FRET-3
Cerulean
Citrine
433
43.0
516
0.77
475
0.62
529
0.76
1.2
2.4 × 10⁻⁹
(261)
Met-cad1.57
ECFP(ΔC11)
cp173Venus
439
32.5
ND
ND
476
0.40
ND
ND
ND
2.5 × 10⁻¹⁰
(262)
Met-cad1.77
ECFP(ΔC11)
cp173Venus
439
32.5
ND
ND
476
0.40
ND
ND
ND
2.2 × 10⁻¹⁰
(262)
a
Molar extinction coefficients given
as ε/103 M–1 cm–1. ND, not determined.
9.2
Cadmium (Cd2+)
Like Pb2+, Cd2+ is toxic to cells due to interference with
Ca2+- and Zn2+-dependent processes. Fluorescent
tools for studying Cd2+ toxicity are similarly rare (Figure 17). One of the main challenges
for developing Cd2+ probes comes from the very similar binding properties of
Cd2+ and Zn2+.
263
It remains difficult to develop sensors selective for Cd2+ that do not show interference
from physiological Zn2+ levels.
264
The first intracellular
fluorescent sensor responsive to Cd2+, Liu Cd-1, was a
small-molecule dye composed of fluorescein and a thiosemicarbazide.
This sensor was applied to HK-2 cells in the presence of micromolar
concentrations of Cd2+.
232
Around
the same time, the BODIPY-based Cd2+ sensor Peng Cd-1 was
generated.
233
This sensor was the first
fluorophore used for imaging Cd2+ in living systems with
a selective response to Cd2+ over Zn2+ based
on internal charge transfer and shifted emission. It was used to monitor
Cd2+ uptake into PC12 and DC cells using both intensity
and ratiometric image collection parameters in the presence of micromolar
Cd2+.
233
Shortly thereafter,
an alternative BODIPY-based sensor, Cheng Cd-1, with a higher affinity
for Cd2+ was produced and used in HeLa cells.
234
Another cell permeable compound based on 8-hydroxyquinoline
was applied to imaging Cd2+ in cultured cells, but this
sensor (Mameli Cd-1) showed a low dynamic range.
235
A ratiometric sensor, DBITA, showed high selectivity
and sensitivity
(picomolar) to Cd2+.
236
Another
sensor DQCd1, based on the fluorophore 4-isobutoxy-6-(dimethylamino)-8-ethoxyquinaldine,
showed both a high dynamic ratio (15-fold) and high sensitivity (picomolar)
to Cd2+.
237
Two near-infrared
fluorescent sensors (CYP-1 and CYP-2) for Cd2+ detection
based on a tricabocyanine platform have also been generated. CYP-1
is functionalized with sulfate groups to increase water solubility
and decrease aggregation where CYP-2 is much more cell permeable and
was used for detecting Cd2+ in HeLa cells.
238
Small-molecule Cd2+ sensors are
profiled in Table 9.
The first genetically
encoded Cd2+ sensor, Cd-FRET,
was actually produced by modifying a Zn2+-FRET sensor.
By introducing four cysteine residues on the dimerization interface
of the eCFP–eYFP FRET pair of ZinCh-9, the resulting Cd-FRET
sensor exhibited high selectivity for Cd2+ over Zn2+.
261
More recently, the FRET-based
Cd2+ selective indicator Met-cad1.57 was presented for
use in imaging human kidney HEK cells.
262
The same group that generated the FRET-based Pb2+ sensor
Met-lead 1.59 produced Met-cad 1.57, which uses a similar ECFP (ΔC11)
and cpVenus FRET pair platform bridged by a metal binding domain,
specifically the bacterial Cd2+ binding protein CadR. Met-cad
1.57 and organelle-targeted variants were successfully used to monitor
cytosolic entry and subcellular accumulation of Cd2+ into
the nucleus of HEK cells treated with micromolar concentrations of
Cd2+.
262
Looking forward, these
types of sensors could be applied to investigate the cellular toxicology
of Cd2+. The properties of these genetically encoded Cd2+ sensors are presented in
Table 10.
9.3
Mercury (Hg2+)
Hg2+ detection is of great significance because this metal ion
is highly toxic, widely distributed in the environment, and bioaccumulates
through the food chain. Seminal work in this field by the Czarnik
and Lippard laboratories led to the development of numerous turn-off,
and later turn-on fluorescent sensors for Hg2+. For a comprehensive
review on the development of colorimetric and fluorescent sensors
for detecting free environmental Hg2+ that lead to fluorescent
detection of Hg2+ in cells, we refer readers to Kim et
al.
265
More recent work has led to the
development of fluorescent Hg2+ indicators based on rhodamine
spirolactams (Figure 18). Rhodamine spirolactam
sensors are nonfluorescent and colorless in the absence of Hg2+, where Hg2+ exposure
and subsequent coordination
induces a turn-on response involving spirolactam ring-opening that
results in strong fluorescence emission and a pink color. These rhodamine-based
chemosensors are appropriate for live-cell applications due to large
molar extinction coefficients, high emission quantum yields, and low
energy absorption and emission wavelengths (Table 9); consequently, some of these
sensors have been applied for
imaging Hg2+ in living cells. For example, the rhodamine-based
chemosensor for Hg2+ (Zhao Hg-1)
242
and RG1, a water-soluble sugar-conjugated rhodamine spirolactam
construct, were used to image Hg2+ in HeLa cells.
243
In addition, several sensors based on modified
versions of rhodamine spirolactams have been used for bioimaging.
One type of modification was designed on the basis of the thiophilic
nature of Hg2+ and uses a thioamide–alkyne scaffold
that substitutes the lactam carbonyl with a thiocarbonyl to generate
a thiospirolactam sensor derivative. The rhodamine thiospirolactam
sensor “Lin Hg-1” was used to monitor Hg2+ in HeLa cells,
244
and a similar sensor,
RS1, was applied to rat Schwann cells.
245
Another type of modified rhodamine spirolactam sensor (Chen Hg-1)
incorporates a thiolactone moiety, and this was the first sensor used
to visualize Hg2+ in C. elegans.
35c
Figure 18
Hg2+ sensor built on a spirolactam
ring-opening platform.
More recently, a FRET-based fluorescent Hg2+ sensor
called RBC1 was presented for use in human melanoma A375 cells.
247
RBC1 uses a 7-diethylcoumarin and rhodamine
FRET pair. In the absence of Hg2+, the rhodamine acceptor
fluorophore is in the same closed nonfluorescent spirolactam form
as described above. This closed ring form is supported by the presence
of a thiosemicarbazide-protecting group. Interaction with Hg2+ promotes turn-on fluorescence
of the rhodamine FRET acceptor and
shifts the FRET ratio. This fluorescence response reaction is not
through a Hg2+ coordination as described above but rather
via Hg2+-mediated conversion of the thiosemicarbazide protection
group to oxadiazole, which in turn induces the opening of the rhodamine
spirolactam producing the fluorescent form of rhodamine. Using a similar
reaction-based technique, the sensor RBPH was used as a chemodosimeter
to detect Hg2+ in MCF-7 cells.
246
Other types of fluorescent Hg2+ sensors include
the
BODIPY-derived detector 8H-BDP,
239
Mercuryfluor-1
(MF1),
240
which combines a fluorescein
reporter with a thioether-rich crown receptor, and a histidine-based
detector “Hatai Hg-1” that was used to image HeLa cells
as well as zebra fish.
241
Hatai Hg-1 includes
histidine residues appended to a bipodal thiocarbamate scaffold that
provide sulfur atoms as donors to increase selectivity for Hg2+. In summary, there
are currently sensitive and selective
fluorescent detectors for Hg2+ available, most of which
can also be used for naked eye detection of water samples, and the
field continues to push for improved sensors to combat growing environmental
pollution concerns.
10
Outlook
We have
come a long way since 1993 when Zinquin was used to measure
the first transition metal ion (Zn2+) in living cells.
In the past 20 years, we have witnessed an explosion in the number
of probes available, an expansion in the range of metals that can
be detected, increasing sophistication in the types of measurements
that can be performed, and remarkably creative design platforms to
ensure specificity (reaction-based probes) and overcome traditional
challenges associated with detecting paramagnetic ions. While many
existing tools could benefit from improved brightness, higher dynamic
range, and increased specificity, the current toolbox has nevertheless
provided an unprecedented view of accessible metal pools in live cells
and organisms. These tools have been used to quantify accessible metal
ion pools, map their location, and monitor dynamics and fluxes of
metal ions. Such studies have revealed that metal ion pools are more
widespread and dynamic than previously imagined, that such pools can
be systematically perturbed in disease states, and that metal ions
are intimately connected to canonical signaling pathways, suggesting
a rich connection between transition metals and cell physiology.
It is an exciting time to imagine where the field might go from
here. Looking forward, it is clear that the ability to perform simultaneous
multianalyte imaging to elucidate interactions between different metal
pools will be instrumental for dissecting the mechanism of crosstalk
between different ions. Such measurements would require an expanded
repertoire of probes of different colors, increasing rigor in metal
specificity, a greater number of localized probes, and careful attention
to ensure no perturbation of the cellular pools. An additional frontier
is
to expand the toolkit for imaging metal ions in whole organisms, in
which the three-dimensional tissue architecture and multiple complex
interacting systems is preserved, would enable us to generate a more
comprehensive understanding of metal homeostasis at the organismal
level. Finally, while there is much to do in the development of probes
themselves, dissecting detailed mechanistic questions would benefit
immensely from an expanded toolbox for manipulating metal ion fluxes
in cells, such as a repertoire of specific metal chelators and photoactive
caged metal compounds.
Related collections
Most cited references197

- Record: found
- Abstract: found
- Article: found
Long Term Outcomes Following Hospital Admission for Sepsis Using Relative Survival Analysis: A Prospective Cohort Study of 1,092 Patients with 5 Year Follow Up
Joshua Davis, Vincent He, Nicholas Anstey … (2014)
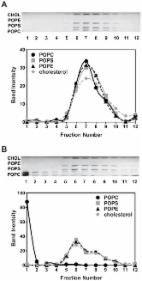
- Record: found
- Abstract: found
- Article: found
Preparation of Artificial Plasma Membrane Mimicking Vesicles with Lipid Asymmetry
Qingqing Lin, Erwin London (2014)

- Record: found
- Abstract: found
- Article: found
Outcomes in Patients with Acute and Stable Coronary Syndromes; Insights from the Prospective NOBORI-2 Study
Farzin Fath-Ordoubadi, Erik Spaepen, Magdi El-Omar … (2014)