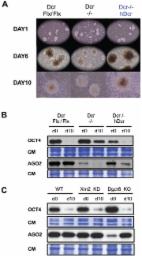
Introduction Long-interspersed elements-1 (LINE-1 or L1) belong to the most abundant class of autonomous transposable elements (TEs) in mammalian genomes. While most L1s are truncated and unable to transcribe or retrotranspose, a fraction of young, full-length L1s are capable of mobilization [1]. Active and inactive L1s influence the evolution of mammalian genomes, yet L1 insertions are also linked to disease [1], raising the issue of how L1 expression and retrotransposition are controlled. In plants, fungi and metazoans, silencing small (s)RNAs suppress TEs at both transcriptional and post-transcriptional levels [2]. In mice, germline-specific, 26–31-nt PIWI-associated RNAs (piRNAs) derived from TE-enriched clusters are loaded into ARGONAUTE-like PIWI proteins directing de-novo cytosine methylation and RNA degradation of active TEs, including L1 [3]. In most healthy somatic tissues, L1s are silenced via 5′-UTR promoter methylation, established from 7.5 days of embryogenesis [4]. In pre-implantation embryos, by contrast, L1 methylation progressively decreases, to reach 13–23% in blastocysts [5], which accumulate full-length L1 transcripts and undergo mosaic retrotransposition, a potential source of heritable and non-heritable mutations [6], [7]. Pre-implantation embryogenesis thus defines a critical window during which L1s should be tightly controlled despite their hypo-methylated status and the lack of piRNAs. In plants, RNA interference (RNAi) at the post-transcriptional level can operate as a surrogate to cytosine methylation and heterochromatinization in TE-silencing [8], [9]. RNAi relies on populations of small interfering (si)RNAs, processed sequentially by the RNase-III Dicer (DCR) from long, perfectly double-stranded (ds)RNA precursors [10]; these are commonly produced by TEs due to their complex insertion patterns or intrinsic bi-directional transcription. Processed siRNAs load into ARGONAUTE (Ago)-family effector proteins and guide sequence-specific degradation of complementary target transcripts. The existence of an endogenous (endo)-siRNA pathway in mammals has been debated, notably because long dsRNA triggers the non-specific interferon (INF) response in most cells [11]. In mouse oocytes, which lack an INF response, heterogeneous sRNA populations map to L1 and LTR elements, among other loci, but their DCR-dependency is unknown; additionally, L1 accumulation is unchanged in oocytes of conditional Dcr −/− animals [12]. Mouse Embryonic Stem Cells (mESCs) also lack an INF response and their ability to produce DCR-dependent endo-siRNAs was clearly established genetically [13]. Being isolated from the blastocyst's inner mass, cultured mESCs are thus potentially suited to study the mechanism(s) that might restrict L1 retrotransposition during pre-implantation, including, possibly, RNAi. Supporting this view, several classes of young, full-length endogenous L1 are hypo-methylated and transcriptionally active in undifferentiated mESCs [14], [15] but become re-methylated and silenced upon differentiation [15], [16]. Moreover, substantially increased L1 transcript levels were reported in undifferentiated Dcr −/− mESCs [17], although this was not confirmed in separate analyses of a distinct KO cell line [18]. Shallow RNA sequencing (15–50-nt size-range) in undifferentiated mESCs revealed that L1 transcription correlates with accumulation of sense and antisense sRNAs of undetermined nature/function, mapping mostly to the L1_5′-UTR [15]. In Human L1s, this region displays overlapping sense-antisense transcription with the potential to form dsRNA and, as such, was proposed to generate anti-L1 endo-siRNAs [19], [20]. In a pioneering study, attempts to substantiate this idea in somatic human cells yielded, however, indecisive conclusions: discrete 21–23-nt L1-derived sRNAs could indeed be detected in some cell lines but not others, and their DCR-dependency was not established; moreover, knocking-down human Dcr-1 caused only marginal increases in endogenous L1 transcription and retrotransposition [20], [21]. Here, we have investigated the possible link between RNAi and endogenous L1 regulation in undifferentiated mESCs. Uniquely, these cells can withstand full genetic ablation of DCR or the AGO proteins, albeit at the cost of proliferation and differentiation defects tentatively ascribed, at least partly, to an inability of Dcr −/− mESCs to produce micro- (mi)RNAs [17], [22]. Unlike siRNA populations, DCR-dependent miRNAs accumulate as discrete, imperfect duplexes excised from stem-loop-containing precursor transcripts produced from numerous independent transcription units. Mature miRNAs are thought to regulate hundreds of cellular transcripts displaying partial miRNA-complementarity, which include mRNAs important for cell fate specification but also pluripotency [23]. Undifferentiated mESCs contain relatively few, albeit highly abundant miRNAs, that can be genetically discriminated from endo-siRNAs and other rare DCR-dependent sRNAs using mutations in the generic miRNA biogenesis factor DGCR8; Dgcr8_KO mESCs contain, nonetheless, few non-canonical miRNAs produced by diverse means [13]. Combining the use of deep-sequencing and cell lines carrying null mutations in Dcr, Agos and Dgcr8, we have investigated the distribution, biochemical origin(s) and ability of L1-derived sRNAs to silence L1 transcript accumulation and retro-transposition in undifferentiated mESCs. Our study reveals an unexpected level of complexity in L1 silencing in these cells, where siRNA-directed RNAi processes are confounded by the overlapping effects of general RNA-surveillance pathways. These findings reveal a novel level of mammalian L1 regulation and shed new light on the proliferation defects and inability of Dcr −/− mESCs to differentiate. Results LINE-1 mRNA and proteins overaccumulate in Dicer knockout mESCs To further explore the L1-derived sRNAs in undifferentiated mESCs, we combined ILLUMINA deep-sequencing and the use of the ncPRO pipeline [24] enabling genomic mapping of repeat-derived sRNAs. A population of abundant, sense and antisense sRNAs was detected, mapping as a majority to the L1-Tf_5′-UTR, consistent with our previous observations (Figure 1A and Figure S1A) [15]. As seen previously with human L1 [19], strand-specific RT-PCR revealed that the 5′-UTR of the L1-Tf subfamily [25] displays overlapping sense-antisense transcription (Figure S1B) with the potential, therefore, to generate dsRNA as a possible source of DCR-dependent siRNAs. Because constitutive DCR depletion is detrimental to cultured mESCs [22], we pursued the above idea by generating inducible Cre-ERT2 Dcr knockouts. Although Dcr deletion was already achieved 24 h post-tamoxifen treatment (Figure 1B), reduced accumulation of miR-295, one of the most abundant mESC miRNAs, was only visible 6 days post-tamoxifen treatment, presumably reflecting the high DCR protein stability [22]. By 12 d post-tamoxifen treatment, miR-295 was below detection levels of quantitative qRT-PCR, indicating full depletion of DCR activity, also confirmed by quantitation of previously validated mESC miRNA target transcripts (Figure 1C and Figure S1C). Strikingly, decreased DCR levels were inversely correlated with accumulation of mRNA and ORF1 protein derived from all L1 classes (Figure 1D and 1E) or from distinct L1-subtypes displaying 5′_UTR polymorphisms [25] (Figure S1D). Analysis of a specific, polymorphic L1 element on chromosome 17 [15] yielded similar results (Figure 1F). Dicer −/− mESCs have been reported to display hypomethylation due to decrease levels in DNA methy-transferases (DNMTs) [26]. However, DNMT1 and DNMT3b proteins were expressed to the same levels in wild type and Dicer −/− cells (Figure S2A). In addition the L1 mRNA was not up-regulated in a cell line carrying a triple-KO for DNMT1, 3a and 3b (Figure S2B) [27]. Investigating the methylation status of the L1_5′-UTR through bisulfite sequencing revealed nonetheless that Dicer −/− mESCs are hypomethylated, which could contribute to the observed up-regulation of the L1 mRNA (Figure S2C). 10.1371/journal.pgen.1003791.g001 Figure 1 L1 elements are up-regulated in Dcr−/− mESCs. A. Sequencing reads, from WT mESCs, within the 19–32-nt range were aligned against the mouse genome (version mm9). The distinct sequences coverage (Reads per Million (RPM) normalized) is depicted for the full length L1Md_Tf L1 [24]. B. PCR-based genotyping of the Dcr deletion 24 h and 48 h post-tamoxifen (Tam) treatment. C. qRT-PCR analysis of miR-295 levels in the tamoxifen treated mESCs, as depicted in (B). D. L1_ORF2 mRNA accumulation detected by qRT-PCR before and after Dcr deletion. E. Western analysis of L1_ORF1 protein levels before and after Dcr deletion; CM: Coomassie staining of total protein. F. Semi-quantitative RT-PCR analysis of RNA levels from a single L1-Tf copy on chromosome 17 before and after Dcr deletion. Retrotransposition of LINE-1 in Dicer knockout mESCs Moreover, this increase in L1 transcript/protein in Dcr −/−, but not Dcr Flx/Flx mESCs, was paralleled by a marked gain in endogenous L1 copy-number, estimated by Q-PCR using PCR primers specific for the L1_Tf subfamily. The promoter activity of mouse L1 elements lies in tandemly repeated, 200 bp monomeric units within the 5′-UTR. These monomers are distinct between different LINE-1 families [28]. We used promoter-specific primers to discriminate, by Q-PCR, the three active families of murine L1 elements designated Tf-, Gf-, and A-type (Table S1). For copy number analysis, we focused exclusively on L1_Tf, which was the subfamily we found mostly associated with small RNAs accumulation (Figure S1A) [15]. Using RepeatMasker (AFA. Smit and R. Hubley. RepeatModeler Open-1.0. http://www.repeatmasker.org, 2008–2010), we identified 22,506 sequences annotated L1Md_T (L1_Tf), 15,286 annotated L1Md_A and 819 annotated L1Md_Gf. Among these “fragment” population of L1 elements, we identified 2,291 L1Md_T, 1,338 L1Md_A and 35 L1Md_Gf, which have a length matching at least 95% of their corresponding L1 reference sequence. For 1 512 L1Md_T, we were able to identify at least one amplicon using the L1_Tf specific PCR primers (See Materials & Methods and Table S1), with an average of 3.9 amplicons per elements. We thus calculated 2,770 full length L1_Tf elements in the mm9 genome, which is in line with the 2000–3000 L1_Tf elements previously estimated by Naas et al. [29], of which 60% are putatively active. To evaluate the gain in copy-number, Dcr Flx/Flx mESCs were analysed at passage 10, upon which the Dcr deletion was induced; the L1_Tf copy number was then re-assessed after 20 additional passages in Dcr Flx/Flx and Dcr −/− background (Figure 2A). About 2,452 active L1_Tf copies were found in Dcr Flx/Flx mESCs at P10 and 2,707 copies at P30. A gain of approximately 860 new copies was detected in the Dcr −/− cell line after 20 passages. Therefore, we estimate that between 1 and 20 new active copies of L1_Tf were generated per day (i.e. 2 cell divisions) in the Dcr− /− background. 10.1371/journal.pgen.1003791.g002 Figure 2 L1 elements retrotranspose in Dcr−/− mESCs. A. qPCR-based copy-number analysis of L1_Tf elements in Dcr Flx/Flx P10 (5 replicates), P30 (2 replicates) and Dcr −/− P30 (5 replicates) mESCs. **: p-value P10). MG132 (Z-Leu-Leu-Leu-al; Sigma, C2211) was dissolved DMSO and added to the cells for 7 h to a final concentration of 0.5 µM. Deep-sequencing Total cellular RNA (5 µg), extracted using Isol-RNA Lysis Reagent (5PRIME) was processed into sequencing libraries using adapted Illumina protocols and sequenced at Fasteris (http://www.fasteris.com, Switzerland) using the HiSeQ 2000 sequencer. All next-generation sequencing data have been deposited to the NCBI Gene Expression Omnibus (GEO) and are accessible with the accession n° GSE43110 (WT and Dcr −/−) and GSE43153 (IP_FHA-hAgo2). sRNA analysis The sRNA-seq analyses were performed using the ncPRO pipeline [24]. Briefly, the reads were aligned on the mm9 genome using the Bowtie software and allowing multiple matches. Profiling of repeats was estimated from the intersection of the mapped reads with the RepeatMasker annotation. As annotated L1Md_Tf L1 repeats are often truncated or have different full length, the median size of full length was considered, and all LdMd_Tf L1 repeats were scaled to this median size when computing positional read coverage. The positional read coverage was computed by summing up the normalized counts (RPM) of reads covering each position, which was further normalized to the number of L1Md_Tf L1 repeats in the genome containing the position. PCR Strand-specific RT-PCR was performed using the Transcriptor Reverse Transcriptase kit (Roche) using 1 µg total RNA and following the manufacturer's instructions. PCR using primer for the specific Tf LINE from chromosome 17 were conducted at 95°C for 10 min, followed by 35 cycles at 95°C for 15 s, 60°C for 30 s, 72°C for 30 s and 10 min at 72°C and revealed on 1% agarose gel. Real-time PCR reagents for miRNAs, 5′_UTR sRNAs and control U6 snRNA were from Qiagen. 5′_UTR sRNAs sense and antisense discrete sequences have been extracted from deep-sequencing data and chose because their higher level of expression. For RT reactions, 1 µg total RNA was reverse-transcribed using the miScript Reverse Transcription Kit (Qiagen) according to the manufacturer's instructions. Following the RT reactions, cDNA products were diluted five times in distilled water, and 2 µL of the diluted cDNAs was used for PCR using QuantiTect SYBR Green PCR Master Mix and miScript Universal Primer (Qiagen). PCR reactions were conducted at 95°C for 10 min, followed by 40 cycles at 95°C for 15 s and 60°C for 30 s on a LightCycler 480 real-time PCR machine (Roche). Real-time PCR for mRNAs was performed as described in [36] using the Rrm2 as a reference gene. L1 copy-number analysis was conducted on 50 ng of DNA and normalized with Rrm2 gene (a single-copy gene). Differences between samples and controls were calculated based on the 2−ΔCT method. Each Real-time PCR reaction was carried out in triplicates using samples from three or five independent differentiation events or cell lines for all mESC experiments, unless otherwise stated. Student's T-Test was used to evaluate the statistical significance of Q-PCR analysis of L1 copy Number. Primers used in this study are all listed in Table S1. L1 copy number analysis Using the ePCR package from NCBI (http://www.ncbi.nlm.nih.gov/sutils/e-pcr/) we identified 10 806 hits on the mouse mm9 reference genome using the L1_Tf specific primers as designed on the L1spa N°. AF016099 [29]. These primers generate 67 bp amplicons, present in the L1_Tf 5′_UTR repeated regions. Real-time quantitative PCR analysis of the L1_Tf copy number in Dicer Flx/Flx mESCs provided a figure of 9,478 at P10 and 10,465 at P30 PCR hits, remarkably close to the ePCR estimation (10,806). The small difference could be explained by the hybrid background of the Dicer mESC line used compared to the genome reference in mm9. The copy number assay shown in Figure 2A, involved a comparison of Dcr Flx/Flx mESCs sampled at passage 10 (9,478 amplicons detected) and at passage 30 (10,465 amplicons detected) with Dcr −/− mESCs sampled at passage 30 (13,821 amplicons detected). Therefore, we estimate that (13,821-10,465) = 3,356 new PCR amplicons were generated, corresponding to 3,356/3.9 = 860 new full length insertion after 20 passages in the Dcr −/− background. Since each passage represents 2 days of culture (40 days in total), 860/40 = 21.51 full length L1_Tf insertions were generated on average every day in Dcr −/− mESCs, although the fraction of active copies among these insertions is unknown. We conclude, therefore, that Dcr −/− mESCs undergo between 1 and 20 L1_Tf retrotransposition events per day. Cell lysates and immunoprecipitations E14_FHA-hAgo2 mESCs were scraped in cell lysis buffer (25 mM Tris, pH 7.9, 250 mM KCl, 0.2 mM EDTA, 20% glycerol and Roche Complete Protease Inhibitor without EDTA). Cells were lysed 10 min on ice, sonicated and centrifuged (10 000 rpm, 10 min at 4°C) before Western analysis or immunoprecipitation. Lysates were incubated at 4°C with 20 µL of FLAG-beads (Invitrogen) for 12 h. Beads were collected by centrifugation (2,000 rpm, 1 min). After at least three washes in 1 mL lysis buffer, beads were incubated with 100 µL 0.1 M glycine pH 2.5 for 10 min RT on a shaker. Ten µL 1 M Tris–HCl pH 8 was added to neutralize the elution buffer. Immunoprecipitated RNAs was then extracted from eluted proteins with Isol-RNA Lysis Reagent (5PRIME). Bisulfite sequencing-based DNA methylation analysis Genomic DNA was extracted using Isol-RNA Lysis Reagent (5PRIME). Bisulfite treatment was performed using the EpiTect Bisulfite Kit (Qiagen). Bisulfite-treated DNA was then amplified using the DreamTaq DNA Polymerase and primers listed in see accompanying primer list. PCR cycling conditions and primers design were made following the recommendations in [61]. PCR fragments were purified and cloned into pGEM-T Easy (Promega) and individual colonies were sequenced using M13 primers. Sequences were then analysed using Kismeth and BISMA softwares [62], [63] to obtain the percentage of methylated sites for each sequence context. Results shown were obtained in two independent experiments. Antibodies The following antibodies were used: anti-L1_ORF1 (gift of Dr Alex Bortvin, Carnegie Institution for Science, USA), anti-AGO1 (D84G10, Cell Signaling Technology, Beverly, MA, USA), anti-mouse AGO2 (clone 6F4, gift of Dr Gunter Meister, University of Regensburg, Germany), anti-XRN2 (A301-101A, Lubio Science, Switzerland), anti-EXOSC10 (Rrp6) (ab50558, Abcam, Cambridge, UK) and anti-OCT4 (ab19857, Abcam, Cambridge, UK). Supporting Information Figure S1 L1 elements are up-regulated in Dcr−/− mESCs. A. Number of sRNA reads and distinct sequences matching full length retrotransposon of LINE1 from L1Md_T, L1Md_A and L1Md_Gf families. B. Detection of overlapping sense and antisense L1 transcription at the L1_5′-UTR region using strand-specific RT-PCR in WT mESCs. The primer sets used are depicted. C. Accumulation of the Hmga2 and Btg2 mRNAs, respectively known targets for mmu-miR-196a and mmu-let-7a/mmu-miR-132, analyzed by qRT-PCR before and after Dcr deletion. D. L1_Tf, Gf and A sub-type mRNAs accumulation detected by qRT-PCR before and after Dcr deletion. Polymorphism in the repeated region indicated in the scheme was used to distinguish subtypes. (EPS) Click here for additional data file. Figure S2 Methylation and retrotransposition in Dcr −/− ESCs. A. Western analysis of DNMT1 & 3b proteins levels in Dcr Flx/Flx, Dcr −/− and Dgcr8_KO mESCs; CM: Coomassie staining of total protein. B. L1_ORF2 mRNA accumulation detected by qRT-PCR in Dcr Flx/Flx, Dcr −/−, Dgcr8_KO and TKO mESCs. C. Bisulfite sequencing-based methylation analysis at the L1 5′_UTR in Dcr Flx/Flx, Dcr −/−, Dgcr8_KO and TKO mESCs. Data were analysed with the Kismeth and BISMA online softwares [62], [63]. D. Expression of eGFP detected by qRT-PCR in WT and Dcr −/− mESCs carrying the human eGFP-tagged L1 transgene after 4 (P4) and 6 (P6) passages post-puromycin treatment for selection of stable transformants. L1 constructs lacking 5′UTR (TgΔ5′UTR) or ORF1 (TgΔORF1) were used as negative controls for retrotransposition. Note that TgWT = RP, TgΔORF1 = JM111 and TgΔ5′UTR = 2980 according to the previous nomenclature established in [30]. (EPS) Click here for additional data file. Figure S3 Deep-sequencing analysis of small RNA libraries. A. Compared size distribution of all deep sequencing reads mapping to the mm9 genome in WT and Dcr −/− sRNAs libraries. B. Pie chart distributions of non-coding RNAs, as annotated by the ncPRO pipeline, in WT and Dcr −/− sRNAs libraries. C. Relative proportions of reads mapping to pre-miRNAs in WT and Dcr −/− sRNAs libraries, as annotated by the ncPRO pipeline. D. 22-nt sequence coverages of L1_Tf elements from WT, Dcr −/− and immunoprecipitated E14-FHA-hAgo2 mESCs, normalized to the total amount of 22-nt reads from corresponding library. E. Size distribution of all reads of RNA isolated from hAgo2 immunoprecipitates mapping to the mm9 genome. F. Same as in (B) for hAgo2-bound sRNAs. G. Same as in (C) for hAgo2-bound sRNAs. (EPS) Click here for additional data file. Figure S4 L1 expression and genomic copy-number in various knock-out and knock-down mESC lines. A. Western analysis of RRP6 and L1_ORF1 accumulation in WT and Rrp6_KD mESCs; CM: Coomassie staining of total protein. B. Accumulation of Tf_5′-UTR (+) and (−) sRNAs detected by qRT-PCR in WT and Xrn2_KD mESCs. C. qPCR analysis of L1_Tf copy-number in WT and Rrp6_KD mESCs. D. L1_ORF2, Tf, Gf and A sub-type mRNAs accumulation detected by qRT-PCR in Xrn2_KD and Rrp6_KD mESCs. E. Accumulation of miR-320 detected by qRT-PCR in WT and Dgcr8_KO mESCs. F. Western analysis of AGO2 accumulation in WT and Ago1,2,3,4_KO_hAgo2 mESCs before and after hAgo2 deletion induced by tamoxifen; CM: Coomassie staining of total protein. G. Accumulation of the Hmga2 and Btg2 mRNAs, respectively targeted by mmu-miR-196a and mmu-let-7a/mmu-miR-132, analyzed by qRT-PCR before and after deletion of hAgo2. H. mRNA accumulation of L1_Tf, _Gf and _A sub-types detected by qRT-PCR before and after hAgo2 deletion. I. mRNA accumulation of a single Tf_L1 subtype located on chromosome 17, analyzed by semi-quantitative RT-PCR before and after hAgo2 deletion. (EPS) Click here for additional data file. Figure S5 Expression of AGO2 in Dcr −/− ESCs and microRNA expression in hDcr-complemented Dcr −/− ESCs. A. Accumulation of the Ago2 mRNA analyzed by qRT-PCR in WT, Dcr −/− and Dgcr8_KO mESCs. B. Endogenous AGO2 protein accumulation in DMSO- and MG132-treated in Dcr −/− mESCs. The data depicted are from two independent treatments. C. MiR-302d and miR-21 accumulation detected by qRT-PCR in Dcr Flx/Flx, Dcr −/− and hDcr-complemented Dcr −/− mESCs. (EPS) Click here for additional data file. Figure S6 mRNA and microRNA expression in hDcr-complemented Dcr −/− ESCs before and after differentiation. A. Accumulation of Fgf5 (ectoderm marker), Hmga2, Sox2 and L1_ORF2 mRNAs detected by qRT-PCR before (d0) and 10 days after differentiation (d10) of Dcr Flx/Flx, Dcr −/− and hDcr-complemented Dcr −/− mESCs. B. Accumulation of miR-295, miR-302d, miR-21 and miR-16 analyzed by qRT-PCR before and 10 days after differentiation of Dcr Flx/Flx, Dcr −/− and hDcr-complemented Dcr −/− mESCs. (EPS) Click here for additional data file. Table S1 Primers table. (DOCX) Click here for additional data file.