26
views
0
recommends
+1 Recommend
0 collections
    0
    shares
      • Record: found
      • Abstract: found
      • Article: found
      Is Open Access

      Visual Acuity and Associated Factors. The Central India Eye and Medical Study

      research-article

      Read this article at

      Bookmark
          There is no author summary for this article yet. Authors can add summaries to their articles on ScienceOpen to make them more accessible to a non-specialist audience.

          Abstract

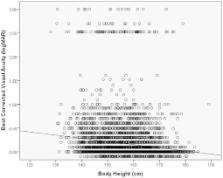
          Visual acuity is a major parameter for quality of vision and quality of life. Information on visual acuity and its associated factors in rural societies almost untouched by any industrialization is mostly non-available. It was, therefore, the purpose of our study to determine the distribution of visual acuity and its associated factors in a rural population not marked influenced by modern lifestyle. The population-based Central India Eye and Medical Study included 4711 subjects (aged 30+ years), who underwent a detailed ophthalmologic examination including visual acuity measurement. Visual acuity measurements were available for 4706 subjects with a mean age of 49.5±13.4 years (range: 30–100 years). BCVA decreased significantly ( P<0.001) from the moderately hyperopic group (0.08±0.15 logMAR) to the emmetropic group (0.16±0.52 logMAR), the moderately myopic group (0.28±0.33 logMAR), the highly hyperopic group (0.66±0.62 logMAR) and finally the highly myopic group (1.32±0.92 logMAR). In multivariate analysis, BCVA was significantly associated with the systemic parameters of lower age ( P<0.001), higher level of education ( P<0.001), higher body stature ( P<0.001) and higher body mass index ( P<0.001), and with the ophthalmic parameters of more hyperopic refractive error (spherical equivalent) ( P<0.001), shorter axial length ( P<0.001), lower degree of nuclear cataract ( P<0.001), and lower intraocular pressure ( P = 0.006). The results suggest that in the rural population of Central India, major determinants of visual acuity were socioeconomic background, body stature and body mass index, age, refractive error, cataract and intraocular pressure.

          Related collections

          Most cited references21

          • Record: found
          • Abstract: found
          • Article: not found

          Causes and prevalence of visual impairment among adults in the United States.

          To estimate the cause-specific prevalence and distribution of blindness and low vision in the United States by age, race/ethnicity, and gender, and to estimate the change in these prevalence figures over the next 20 years. Summary prevalence estimates of blindness (both according to the US definition of < or =6/60 [< or =20/200] best-corrected visual acuity in the better-seeing eye and the World Health Organization standard of < 6/120 [< 20/400]) and low vision (< 6/12 [< 20/40] best-corrected vision in the better-seeing eye) were prepared separately for black, Hispanic, and white persons in 5-year age intervals starting at 40 years. The estimated prevalences were based on recent population-based studies in the United States, Australia, and Europe. These estimates were applied to 2000 US Census data, and to projected US population figures for 2020, to estimate the number of Americans with visual impairment. Cause-specific prevalences of blindness and low vision were also estimated for the different racial/ethnic groups. Based on demographics from the 2000 US Census, an estimated 937 000 (0.78%) Americans older than 40 years were blind (US definition). An additional 2.4 million Americans (1.98%) had low vision. The leading cause of blindness among white persons was age-related macular degeneration (54.4% of the cases), while among black persons, cataract and glaucoma accounted for more than 60% of blindness. Cataract was the leading cause of low vision, responsible for approximately 50% of bilateral vision worse than 6/12 (20/40) among white, black, and Hispanic persons. The number of blind persons in the US is projected to increase by 70% to 1.6 million by 2020, with a similar rise projected for low vision. Blindness or low vision affects approximately 1 in 28 Americans older than 40 years. The specific causes of visual impairment, and especially blindness, vary greatly by race/ethnicity. The prevalence of visual disabilities will increase markedly during the next 20 years, owing largely to the aging of the US population.
            Bookmark
            • Record: found
            • Abstract: found
            • Article: not found

            Prevalence and causes of visual impairment in an elderly Chinese population in Taiwan: the Shihpai Eye Study.

            Few population-based data on the prevalence and causes of visual impairment are available from East Asia. The purpose of this study was to determine the prevalence and causes of visual impairment in an elderly Chinese population in Taiwan. Population-based cross-sectional study. The Shihpai Eye Study was a survey of vision and ocular disease among an elderly Chinese population 65 years of age or older residing in Shihpai, Taiwan. A random sample of 2045 elderly residents was identified and selected from the household registration databank. Among them, 1361 (66.6%) underwent a detailed ophthalmic examination. The ophthalmic examination included best-corrected visual acuity measurements using standardized protocols. Visual acuity was assessed with a Snellen E chart. The major cause of visual loss was identified for all participants who were visually impaired. Low vision and blindness were defined as a best-corrected visual acuity in the eye with better vision worse than 20/60 to a lower limit of 20/400 and worse than 20/400, respectively, according to World Health Organization categories of visual impairment. The mean age of the participants was 72.2 (range, 65-91) years old. A total of 40 participants met the World Health Organization criteria of low vision, and 8 were diagnosed as blind. The rate of blindness and low vision was estimated to be 0.59% (95% confidence interval, 0.25%, 1.16%) and 2.94% (95% confidence interval, 2.11%, 3.99%), respectively. There was a significant increase in the rate of low vision (P<0.001) from 0.83% at 65 to 69 years of age to 8.33% at age 80 years or older. There was no gender difference in the prevalence of blindness or low vision. The leading cause of visual impairment was cataract (41.7%), followed by myopic macular degeneration (12.5%) and age-related macular degeneration (10.4%). The rate of blindness and low vision is close to that reported for other developed countries. The high frequency of myopic macular degeneration as a major cause of visual loss, however, is not observed in European-derived populations. Specific prevention or low-vision rehabilitation programs should be developed for the elderly Chinese population.
              Bookmark
              • Record: found
              • Abstract: found
              • Article: not found

              Visual acuity and the causes of visual loss in Australia. The Blue Mountains Eye Study.

              The Blue Mountains Eye Study is a population-based study of vision and the causes of visual impairment and blindness in a well-defined urban, Australian population 49 years of age and older. The logarithm of the minimum angle of resolution (logMAR) visual acuity was measured before and after refraction in 3647 persons, representing an 88% response rate in two postcode areas in the Blue Mountains area, west of Sydney. Refraction improved visual acuity by one or more lines in 45% of participants and by three or more lines in 13%. Visual impairment (visual acuity 20/40 or worse in the better eye) was found in 170 participants (4.7%). Mild visual impairment (Snellen equivalent 20/40 to 20/60 in the better eye) was found in 3.4% moderate visual impairment (20/80 to 20/160 in the better eye) in 0.6%, and severe visual impairment or blindness (20/200 or worse in the better eye) in 0.7%. Visual impairment increased with age from 0.8% of persons 49 to 54 years of age to 42% of persons 85 years of age or older. Visual impairment was significantly more frequent in females at all ages. Among persons with severe visual impairment, 79% were female. After adjusting for age, females were less likely to achieve 20/20 best-corrected visual acuity than males (odds ratio, 0.57; confidence interval, 0.48-0.66). After adjusting for age and sex, no association was found between visual acuity and socioeconomic status. Age-related macular degeneration was the cause of blindness in 21 of the 24 persons with corrected visual acuity of 20/200 or worse. Increasing age and female sex were independent predictors of visual impairment.
                Bookmark

                Author and article information

                Contributors
                Role: Editor
                Journal
                PLoS One
                plos
                plosone
                PLoS ONE
                Public Library of Science (San Francisco, USA )
                1932-6203
                2011
                4 August 2011
                : 6
                : 7
                : e22756
                Affiliations
                [1 ]Suraj Eye Institute, Nagpur, Maharashtra, India
                [2 ]Department of Ophthalmology, Faculty of Clinical Medicine Mannheim, University of Heidelberg, Mannheim, Germany
                Washington University School of Medicine, United States of America
                Author notes

                Conceived and designed the experiments: VN JBJ. Performed the experiments: VN AS RG SA JBJ. Analyzed the data: JBJ. Contributed reagents/materials/analysis tools: JBJ VN. Wrote the paper: JBJ VN.

                Article
                PONE-D-11-07497
                10.1371/journal.pone.0022756
                3150376
                21829503
                fc7a2bc1-0b81-43d4-b4fe-2f70ac20ee9a
                Nangia et al. This is an open-access article distributed under the terms of the Creative Commons Attribution License, which permits unrestricted use, distribution, and reproduction in any medium, provided the original author and source are credited.
                History
                : 30 April 2011
                : 30 June 2011
                Page count
                Pages: 8
                Categories
                Research Article
                Medicine
                Clinical Research Design
                Cross-Sectional Studies
                Epidemiology
                Ophthalmology
                Public Health
                Health Screening
                Socioeconomic Aspects of Health
                Surgery
                Ophthalmology

                Uncategorized
                Uncategorized

                Comments

                Comment on this article