1. INTRODUCTION
Natural products (NPs) have been important sources of new drug development over the past four decades [1]. NPs are distinguished from synthetic drug-like molecules due to the enormous structural and physicochemical diversity [2]. Compared to synthetic drug-like molecules, NPs have higher structural complexity, especially with respect to stereochemistry and molecular shape, in which NPs have a higher number of chiral centers and a variety of skeletons [3]. Despite the potential for NPs to develop into useful drugs, the drug discovery workflow that progresses from natural crude extracts to well-characterized bioactive NPs as hits, then as lead compounds, is complicated, expensive, and frequently incompatible with the speed of high-throughput screening campaigns [4]. Therefore, many pharmaceutical companies began to slow down and eventually stop the majority of NP-oriented research programs in the early 2000s [5]. Recently, the development of accurate and accessible omics technologies, such as non-targeted metabolomics, genome sequencing, and high-throughput screening, have altered the NPs discovery landscape [6].
Metabolomics is a non-selective, universally applicable, and all-encompassing analytical approach for the identification and quantification of metabolites in biological systems [5]. The purpose of metabolomics is to obtain complete metabolite fingerprints, detect differences between metabolites, and develop hypotheses to explain these differences [7]. Metabolomics is commonly considered to be the large-scale analysis of metabolites in a given organism under different physiologic states, but metabolomics also extends to chemotaxonomic studies and comprehensive metabolite profiling for lead compound discovery from natural sources. Over the last decade, metabolomics tools have become significantly advanced, owing to improved acquisition techniques in both mass spectrometry (MS) and nuclear magnetic resonance (NMR) sensitivity and resolution, as well as computational and bio-chemometric methods [8, 9]. This unbiased data-driven method has benefited many areas of life sciences and has also strongly impacted different aspects of NP research, most notably by providing additional dimensions to de-replication. Therefore, it has gradually been realized that traditional analysis methods only touched the surface of the entire pool of molecules present in complex mixtures, thus leaving a significant amount of “dark matter” that potentially contains much-needed novel bioactive molecules [10]. The metabolites mentioned in this review mainly refer to secondary metabolites.
Molecular networking (MN [also generically known as mass spectral networking]) is a data organization and visualization approach using a tandem mass spectrometry (MS/MS) approach, which was first introduced in 2012 [11]. MN connects related molecules by aligning experimental spectra with each other and comparing spectral similarity, which performs beyond spectral matching against reference spectra [12]. Powered by the computational infrastructure of the University of California San Diego Center for Computational Mass Spectrometry and the Mass Spectrometry Interactive Virtual Environment (MassIVE) data repository, MN has been used to establish the world’s largest data analysis tool for MS/MS data {Global Natural Products Social Molecular Networking (GNPS)} [13, 14]. Such GNPS-like platforms have been increasingly adopted in metabolomics for “dark matter” decipherment, including everything from plant extracts and microbial cultures to a variety of human and environment samples, by propagating spectral library-based annotation and demonstrating chemical relationships between detected molecules across many sample types. Most recently, network-based approaches have been expanded to introduce drug discovery leads, clinical diagnostics, and precision medicine [15]. From a drug discovery perspective, MN as a NP discovery strategy tends to be applied to characterize secondary metabolites (small-molecular-weight molecules, typically <1500 Da) from various organisms, especially for unknown metabolites without available standard MS/MS spectra [16].
In this review we describe metabolite profiling methods based on MN that are currently used in NP discovery research and metabolomics, related fields, or can be implemented. This review summarizes workflow that can be used quickly, provides alternative de-replication strategies for efficient NP discovery, and lists application examples that combine network to other technologies. As a general guideline to understand the organization of this review, the first section demonstrates the general flow of the current network-based metabolomics research and summarizes the main software and platforms used in each stage. The second section summarizes the network-based de-replication strategies for NP discovery. First, the review mainly covers three categories of advanced strategies that go beyond the conventional manual de-replication approach. Improved strategy I uses MS spectra contained in available databases (DBs) for automatic annotation. Improved strategy II uses the known spectral features aimed at finding all related molecules in the query MS spectra. Improved strategy III produces structure hypothesis of unknown compounds by exhaustively searching the NP DBs. These NP DBs mainly contain structures, most of which lack MS spectra. Finally, the approach illustrates the combined application of MN research, mass spectrometry imaging, biosynthetic gene cluster mining, and stable isotope labeling.
2. MN-BASED NON-TARGET DATA ANALYSIS WORKFLOW
The most time-consuming and complicated step in non-targeted experiments is data analysis. Many tools and methodologies are available for this procedure and have been extensively summarized [17–20]. Non-targeted metabolomics network-based workflow is composed of three key steps, all of which are discussed below: data pre-processing; network visualization; and metabolites annotation.
2.1 Data pre-processing
Mass spectrometry “raw data” typically refers to the file format in which the MS data are stored, including information about the analysis procedure and spectral scan information, such as mass and intensity, while the formats are usually vendor-specific. According to Sindelar and Patti [21], among the thousands of non-targeted metabolomics original signals, non-biological signals, including contaminants and artifacts, account for the largest part, followed by redundant adduct ions, isotope ions, oligomer ions, and fragments, and only a small part of real and effective signals of known or unknown chemicals ( Figure 1 ). Therefore, data pre-processing is the first major challenge in non-targeted metabolomics and the effectiveness of this step is critical for downstream data analysis. Data pre-processing converts complex, mixed-information “raw data” into easy-to-process tables with so-called “features;” however, despite the improvement in different parameter optimization tools [22], data pre-processing has many problems, such as false-negative and false-positive reports of ion species, as well as incorrectly reported abundance values, which lead to poor pre-processing performance, and enormous unidentifiable signals remain in the subsequent data analysis process [23].

Composition of an untargeted metabolomic dataset. The specific number of features in any one category may vary with the experimental method, processing software, and sample type.
Although the methods of metabolomics data pre-processing have been continuously improved, the general steps of the different tools have remained the same with very few exceptions [24]. Typically, the necessary steps include peak detection, pick picking/integration, deconvolution, deisotope, and peak matching/alignment ( Figure 2 ). The first step, referred to as “peak detection,” is the process of recognizing distinct peaks in a mass spectrum that represents the presence of various compounds in the sample. Peak detection is accomplished by a set of algorithms that consider the noise level and signal intensity in the mass spectrum. Local maxima in the signal are identified by the algorithms, and peaks are defined as groups of contiguous data points that exceed a specified intensity threshold. The second step, “chromatogram build,” is a procedure for extracting and combining data from several scans or spectra into a single chromatogram. The resulting chromatograms can then be used for the third step, “deconvolution,” which improves the accuracy of mass spectrometry data by resolving overlapping peaks in a mass spectrum into individual peaks. During the MS process, different compounds produce peaks at the same m/z, which makes it difficult to accurately identify compounds. Deconvolution algorithms use various mathematical techniques to separate these overlapping peaks and assign individual m/z values to each compound. The fourth step, “deisotope,” helps to resolve these peaks and accurately identify the molecular species by grouping the peaks that belong to the same isotopic pattern. The fifth step, “peak alignment,” involves matching peaks in different samples or chromatographic runs to facilitate a comparison of mass spectrometry data across different conditions. Peak alignment is used to correct for systematic variations in the acquisition of mass spectrometry data, such as differences in retention time, instrument drift, or mass accuracy.

Tools with a graphical user interface (GUI) are a convenient option for DPP and empirical parameter optimization. In such cases, open-source software, such as MZmine [25], MS-DIAL [26], MetaboScape [27], MetaboAnalyst [28], CAMERA [29], and MetAlign [30], provide support for data pre-processing, normalization, visualization, and statistical analysis; however, those tools are limited by the scale of datasets. For large-scale datasets (>500 files), tools that were designed to operate on a cluster/cloud computer are preferred, such as XC-MS online [31], OpenMS [32], W4M [33], and Metabolomics Workbench [34].
2.2 Network generation and visualization
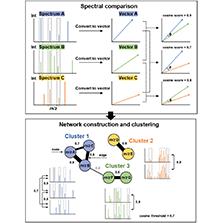
MN is a graph-based workflow that organizes massive MS datasets by mining spectral similarity between different MS/MS fragmentation patterns, but structurally-related precursor ions. The basic principle underlying MN is to compare the MS/MS spectra of different ions in a sample and to organize those spectra based on similarities. The outcome is a network or graph, in which nodes represent precursor ions and edges represent spectral similarity between the MS/MS spectra of those ions ( Figure 3 ) [12]. After necessary data pre-processing steps, because low-intensity fragment ions and the precursor ion are removed from the MS/MS spectra, MS/MS data are simplified and proceed to the next important steps: (i) spectral comparison; and (ii) network construction and clustering. First, spectral comparison is usually performed using vector-based spectral similarity algorithms, such as the cosine similarity (normalized dot product similarity), Tanimoto similarity, Jaccard similarity, and Euclidean distance [35]. Among these algorithms, cosine similarity is the most widely used algorithm for MN analysis due to its interpretability (cosine similarity can be easily interpreted as a similarity measure between 0 and 1), robustness (the presence of irrelevant or redundant molecular descriptors do not affect the similarity score), computational efficiency (suitable for large-scale MN analysis), and versatility (can be applied to a variety of molecular descriptors, such as molecular weight, number of hydrogen bond donors and acceptors, and molecular shape) [36]. Using cosine similarity, MS/MS spectra sets are then simplified and converted to vectors in a multidimensional normalized space where each dimension corresponds to an m/z value and its absolute intensity, and the similarity between two pairs of spectra is calculated as the cosine value of the angle between the vectors, ranging from 0 (no similarity) to 1 (perfect similarity). The results of these vector-based comparisons can then be visualized as graphs of spectral similarity, known as spectral networks [37] or MNs [12], where each node represents a collection of MS/MS spectra and the edges between node reflect the degree of similarity between consensus spectra. The edges can be weighted, with the weight representing the similarity score between the two ions. The clustering step results in the grouping of ions that have similar MS/MS spectra into the same cluster, and these clusters can be visualized as connected groups of nodes in the network, which is typically performed using clustering algorithms, such as hierarchical, K-means, Markov, spectral, and density-based clustering [38]. The choice of clustering algorithm often depends on the specific requirements of the MN analysis. For example, hierarchical clustering may be preferred when it is important to visualize the relationships between the compounds in a MN, while K-means may be preferred when the goal is to identify a specific number of clusters.
Basic workflow of molecular networking; a graph-based tool to explore spectral similarity in LC-MS/MS data.
Initially, MATLAB scripts were utilized in investigations on MN to compute similarity scores, while visualization was accomplished using Cytoscape software [39]. With advances in computational technology and the availability of open platforms, such as GNPS, users can upload and store MS/MS data online, create MNs, and share and build upon their knowledge as an individual or as part of a community, as well as add information about the samples and other metadata to help understand the network [14]. Molecular families are groups of molecules that are represented as subclusters in a MN and are related structurally [40]. Data visualization of molecular families is now possible on GNPS directly online, but Cytoscape or another network visualization tool is better used off-line to visualize an entire MN and its individual molecular families [39]. MN properties can be adjusted to improve data interpretation In Cytoscape. Indeed, many tools are available for MS/MS data analysis and networking visualization of metabolites; the capabilities are summarized in Table 1 .
Selected commonly used tools for MS/MS data analysis and networking visualization of metabolites.
| Tools | Capabilities | Websites |
|---|---|---|
| GNPS | Provide access to large databases of mass spectrometry data and enables users to upload and process their own data and support various workflows for molecular networking, including de novo sequencing, database searching, and spectral library building. | https://gnps.ucsd.edu/ |
| MetGem | A graph-based approach to generate molecular networks that provides access to a large database of metabolite spectra and sample metadata and supports various data processing, normalization, and quality control procedures, as well as advanced visualization and interpretation. | https://metgem.github.io/ |
| MS2LDA | A machine learning algorithm that stands for mass spectrometry-based spectral clustering. It is used to analyze and interpret mass spectrometry (MS) data. The algorithm clusters together similar MS spectra and assigns them to a particular molecular species, allowing for the identification of unknown compounds in complex samples. | https://ms2lda.org/ |
| MetaboAnalyst | One-in-all metabolomics data analysis tool collection, which supports various data processing, quality control, and normalization procedures, as well as advanced visualization and interpretation methods for molecular networks. | https://www.metaboanalyst.ca/ |
| MetaboLights | A database for metabolomics studies that provides access to a large collection of metabolite spectra and sample metadata and offers a molecular networking tool that enables users to perform network analysis and visualization. | https://www.ebi.ac.uk/metabolights/ |
| MetaboHunter | Focuses on the identification of metabolites based on accurate mass, fragmentation patterns, and spectral similarities. It supports batch processing of large datasets and provides advanced visualization and interpretation capabilities. | https://github.com/mfitzp/metabohunter |
| MetFrag | Focuses on the identification of metabolites based on accurate mass, fragmentation patterns, and spectral similarities. It supports batch processing of large datasets and provides various visualization and interpretation methods. | https://ipb-halle.github.io/MetFrag/ |
| MetCirc | Comprises functionalities to interactively organize these data according to compound familial groupings and to accelerate the discovery of shared metabolites and hypothesis formulation for unknowns. | https://github.com/tnaake/MetCirc |
| compMS2Miner | An automatable metabolite identification, visualization, and data-sharing R package for high-resolution LC–MS data sets. | https://github.com/WMBEdmands/compMS2Miner |
| CAMEO | Cluster Analysis for Metabolomics Experiments Online is a web-based tool for molecular networking that supports various clustering and network analysis methods. It enables users to process large datasets and provides advanced visualization and interpretation capabilities. | https://cameo.bio/apidoc_output/cameo.network_analysis.html |
| BioCAn | Combines the results from database searches and in silico fragmentation analyses and places these results into a relevant biological context for the sample as captured by a metabolic model. | Alden et al., 2017 [41] |
| NAP | Network Annotation Propagation uses molecular networking to improve the accuracy of in silico predictions through propagation of structural annotations, even when there is no match to a MS/MS spectrum in spectral libraries. | https://github.com/DorresteinLaboratory/NAP_ProteoSAFe/ |
| MolNetEnhancer | A computational tool for the enhancement of molecular networks generated from metabolomics data. It uses a combination of graph theory algorithms and machine learning techniques to improve the quality and interpretability of molecular networks. | https://github.com/madeleineernst/pyMolNetEnhancer |
| MetDNA/MetDNA2 (KGMN) | A computational tool for the analysis of untargeted metabolomics data. It uses metabolic reaction network-based recursive annotation to identify metabolites and generate molecular networks. | http://metdna.zhulab.cn/ |
| NP Analyst | An open online platform for the analysis of natural product (NP) data. It is designed to provide access to NP-specific resources, including NP databases, spectral libraries, and computational tools. | https://www.npanalyst.org/ |
| METLIN | A database of metabolites and mass spectrometry data that provides access to a large collection of high-quality spectral information for metabolites. It also offers a molecular networking tool that enables users to perform network analysis and visualization. | https://metlin.scripps.edu/landing_page.php?pgcontent=mainPage |
| MetaboNet | A web-based platform for molecular networking that supports various network analysis and visualization methods. It provides access to a large collection of metabolite spectra and sample metadata, as well as advanced interpretation tools. | https://github.com/tcameronwaller/metabonet |
| MS-DIAL | A software platform for mass spectrometry-based metabolomics data analysis that includes a molecular networking module, which supports various data processing, normalization, and quality control procedures, as well as advanced visualization and interpretation methods for molecular networks. | https://web.tuat.ac.jp/tsugawalab/software/msdial/consoleapp.html |
| MetExplore | A web-based platform for molecular networking that supports various network analysis and visualization methods. It provides access to a large collection of metabolite spectra and sample metadata, as well as advanced interpretation tools. | https://metexplore.toulouse.inrae.fr/index.html/ |
| Metscape | Cytoscape plugin, metabolomics correlation networks and KEGG-based metabolic networks integrating gene expression and metabolomics. | http://metscape.ncibi.org/ |
| Metwork | A web server of in silico metabolization of metabolites that represents a full implementation of the metabolome consistency concept. | https://metwork.pharmacie.parisdescartes.fr/ |
| MetNet | Metabolite network prediction from high-resolution mass spectrometry data in R Aiding metabolite annotation. | https://github.com/simeoni-biolab/MetNet |
| xMSannotator | An R package for network-based annotation of high-resolution metabolomics data. | https://rdrr.io/github/yufree/xMSannotator/ |
| MassTRIX | A platform for the analysis of metabolomics data, which uses a combination of machine learning and graph theory algorithms to generate molecular networks and to identify metabolic pathways. The platform provides an interactive interface for the visualization and interpretation of the molecular networks, which allows users to explore their data in a more intuitive and meaningful way. | https://metabolomics.helmholtz-muenchen.de/masstrix3/ |
2.3 Network analysis and metabolite annotation
Metabolite annotation for networks is critical for the interpretation and understanding of the complex relationships between metabolites. Accurate metabolite annotation enables the identification of metabolic pathways and networks, which can lead to the discovery of novel metabolites. Nonetheless, metabolite annotation is a challenging and time-consuming task; however, recent advances in analytical methodologies, computational tools, and databases have substantially improved the accuracy and efficiency of this process ( Table 2 ). Numerous chem- and bio-informatics techniques for metabolomics have made tremendous advances and have become indispensable as powerful supports for metabolite annotation, the capabilities of which can be divided into five levels (types 1-5). In type 1, computational tools allow m/z alignment of precursor ions and searches through the m/z of the precursor ion. In type 2, computational tools allow searches via the MS/MS or MSn spectra against experimental spectra contained in more than one database. In type 3, computational tools allowing searches via the MS/MS or MSn spectra against in silico spectra predicted based on the putative structures obtained for the m/z of the precursor ion. In type 4, computational tools perform metabolite annotation/identification using orthogonal information to provide scores pertaining to putative annotations, including chromatographic, spectral libraries, metabolic pathways, isotope label, and literature data; information can be used from MS and/or MS/MS. In type 5, computational tools perform metabolite annotation/identification by creating molecular networks between the putative annotations obtained for the features, which use approaches to put annotations into a biological context and provide evidence pointing to confirm or refute the approaches. Information can be used from MS, MSn, and/or orthogonal information in addition to the biological context created in the molecular network.
Selected commonly used public database of MS/MS spectra can be used in the network annotation.
| Name | Type of MS/MS spectra | Number of MS/MS spectra | Experimental data | Simulated data | Websites |
|---|---|---|---|---|---|
| GNPS | NPs from various sources (e.g., plants, fungal, microbes, marine, animals), peptides and proteins, xenobiotics, and environmental pollutants | >23,000,000 | Yes | No | https://gnps.ucsd.edu/ProteoSAFe/libraries.jsp |
| MassBank | NPs from various sources (e.g., plants, fungal, microbes, marine, animals), environmental pollutants, drugs and drug metabolites, food and dietary components | >700,000 | Yes | No | http://www.massbank.jp/ |
| MoNA | NPs from various sources (e.g., plants, fungal, microbes, marine, animals), peptides and proteins, xenobiotics, and environmental pollutants | >270,000 | Yes | Yes | https://mona.fiehnlab.ucdavis.edu/ |
| NIST | NPs from various sources (e.g., plants, fungal, microbes, marine, animals), peptides and proteins, xenobiotics, and environmental pollutants | >190,000 | Yes | No | https://chemdata.nist.gov/ |
| MetaboLights | NPs from various sources (e.g., plants, fungal, microbes, marine, animals), human and animal metabolites specialized metabolites, environmental pollutants, food, and dietary components | >80,000 | Yes | No | https://www.ebi.ac.uk/metabolights/ |
| MetLin | NPs from various sources (e.g., plants, fungal, microbes, marine, animals), peptides and proteins, xenobiotics, and environmental pollutants | >30,000 | Yes | No | https://metlin.scripps.edu/ms_ms_spectrum_match_search.php |
| ResPest | Volatile organic compounds, primary metabolites (e.g., amino acids, organic acids, sugars), fatty acids and their derivatives, and environmental pollutants | >20,000 | Yes | No | https://spectra.pcs.riken.jp/ |
| YMDB | Primary metabolites (e.g., amino acids, organic acids, nucleotides, sugars), secondary metabolites (e.g., alkaloids, flavonoids, polyketides, and terpenoids), lipids (e.g., fatty acids, glycerophospholipids, and sphingolipids) | >16,000 | Yes | Yes | http://www.ymdb.ca/ |
The first databases specifically devoted to metabolite annotation were created in the early 2000s, which only provided m/z data and the structure of the compounds, such as METLIN [42], LIPID MAPS [43], HMDB [44], and KomicMarket (type 1) [45]. Nevertheless, the number of experimental data did not cover the expected entire metabolome. Consequently, various tools were developed that utilized different heuristic methods to create possible structures from known metabolites, such as MINE [46] and BioTransformer [47].
The next stage allows search of the spectra, including information related to the fragmentation spectra, such as XCMS [48], HMDB [44], and MassBank [49] (type 2); however, the limitation of original standards makes it impossible to acquire experimental data for most compounds recorded in the presented databases. Therefore, many different tools and approaches were developed for MS/MS spectra prediction under different experimental conditions, such as MetFrag [50], MAGMA [51], MyCompoundID [52], CFM-ID [53], and CSI:FingerID [54] (type 3).
Given that similar structures usually result in similar fragmentation patterns, identifying compounds to unique structures still lack confidence. Therefore, orthogonal information has been gradually included in metabolite annotation, such as MZedDB [55], CAMERA [29], MetFrag [50], LipidBlast [56], iMet [57], and CMM [58] (type 4). For example, the hydrophobicity of a chemical impacts retention time on the chromatographic column. Another example of the application of orthogonal information for annotating metabolites is evaluating the possible ions (adducts, multiple charges, and dimers) that may occur.
Recently, relevant information has been included in some tools, such as the biological relationships between different metabolites in an organism and substructure search in type 5 (MassTRIX [59], GNPS [15], xMSannotator [60], BioCAn [41], NAP [61], ADAPTIVE [62], MetDNA [63], MetDNA2 KGMN [64], MolNetEnhancer [65], MetNet [66], NP Analyst [67], and MS2LDA [68]). In the past few years, this approach has been widely adopted by new metabolite annotation tools that eliminate putative annotations not related to the other features, and including evidence to support the annotations based on a sizable number of links among all the features present in a sample.
Metabolite annotation and identification databases are continually expanding and including more data on chemicals. Among the recently built and updated computational tools, the combination of approaches to study metabolite networks and assess the relationships between the putative annotated structures is the current trend. Users can increase the confidence level by utilizing more comprehensive information during the metabolite annotation process. Moreover, the large number of tools available to perform metabolite annotation and identification has caused a divergence in the metabolomics community, which has led user proficiency in using a diverse set of tools with distinct languages, such as R packages, python libraries, web-based applications, and standalone applications. The emergence of several frameworks or workflows, such as W4M [33], Taverna [69], and KNIME [70], that integrate all stages of metabolomics experiments is a crucial step to maximize the use of all the tools currently built with the minimum amount of learning.
3. DE-REPLICATION STRATEGIES FOR NP DISCOVERY BASED ON MN
3.1 General strategy: targeted manual de-replication
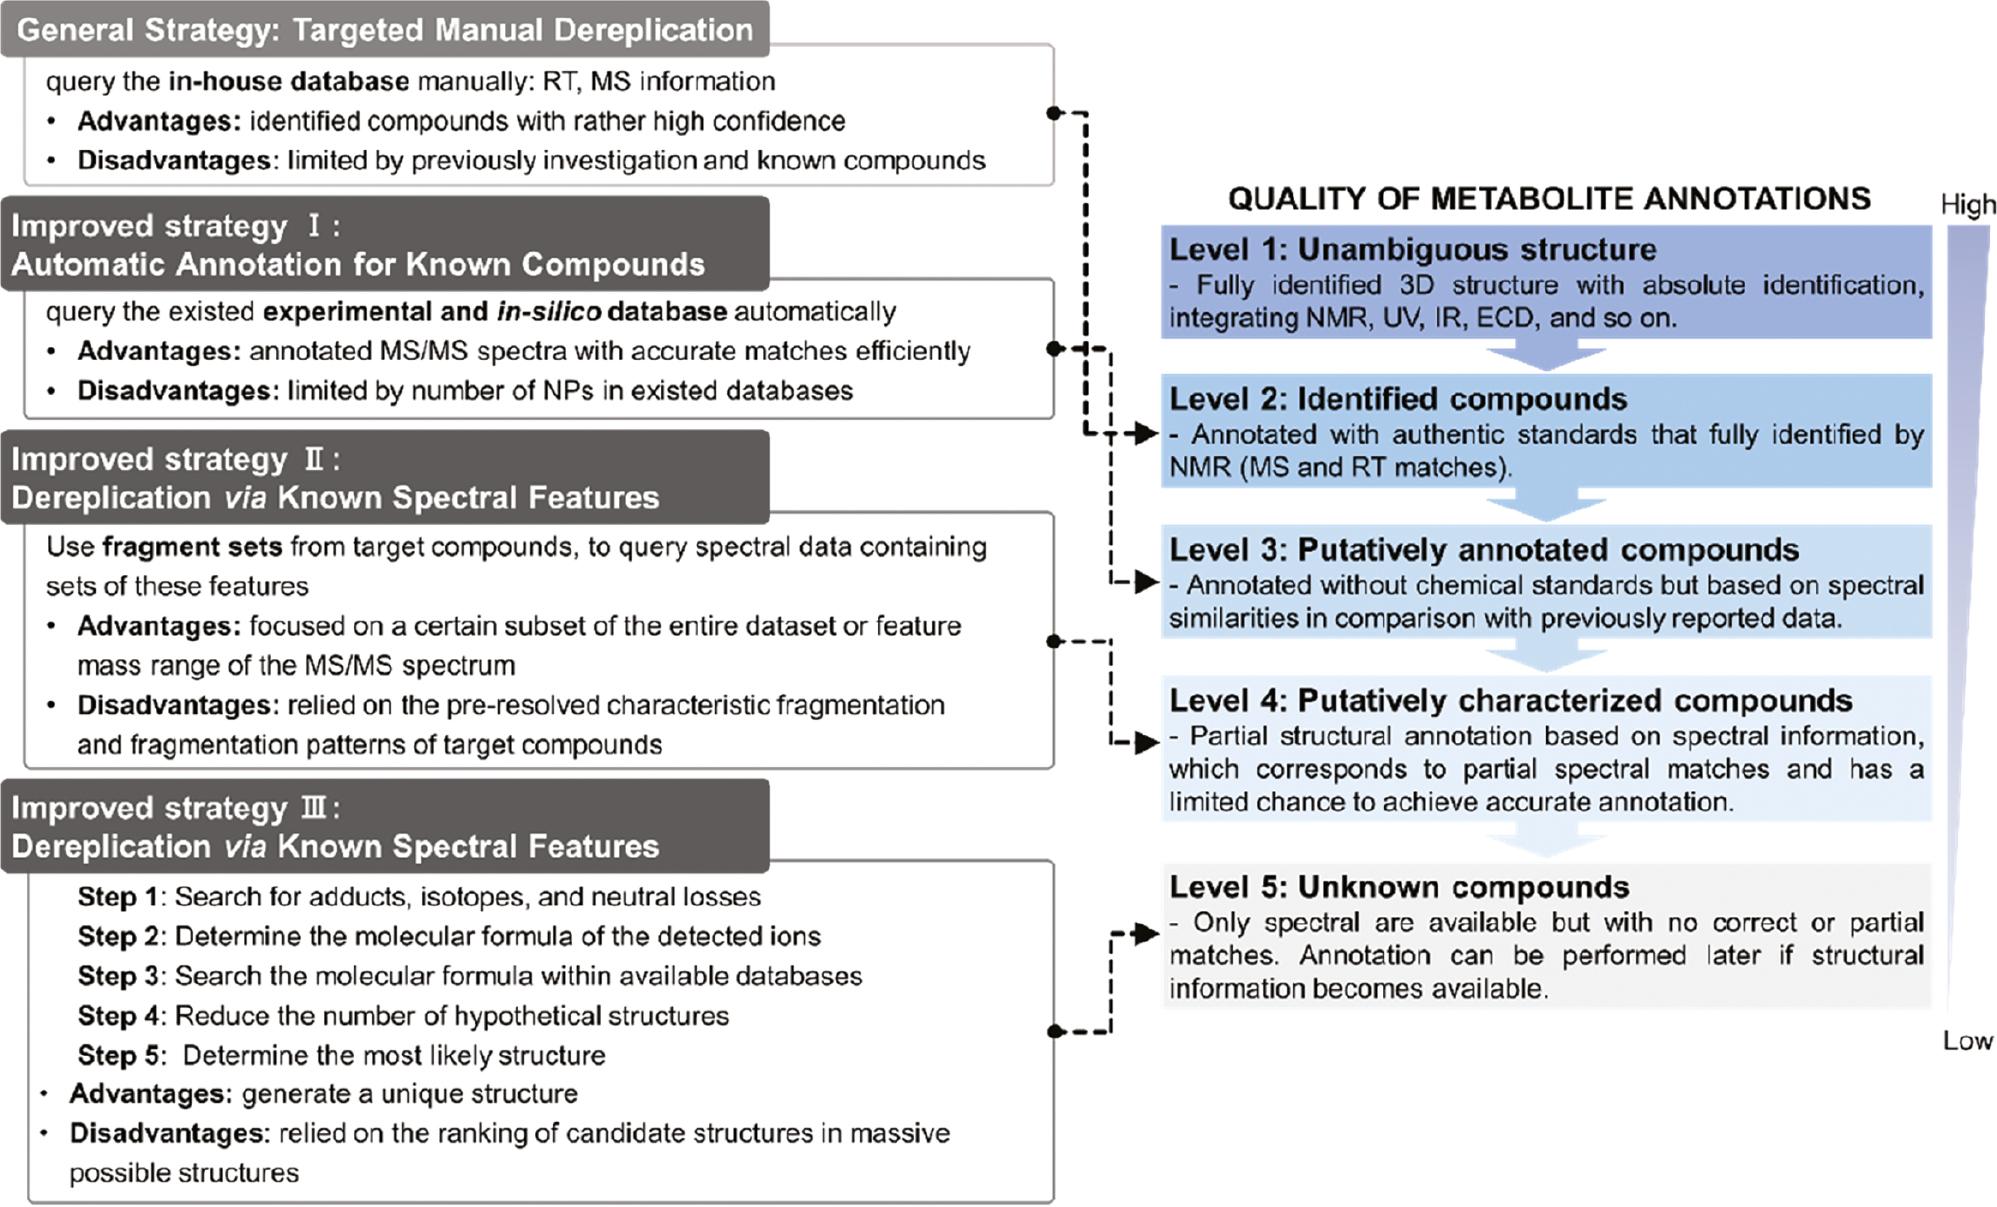
In untargeted metabolomics experiments, the first and fastest de-replication strategy is based on the query of the in-house database, which is the so-called “targeted manual de-replication” strategy. This strategy essentially compares the retention time and MS information of obtained experimental data with previously isolated compounds analysis under the same conditions. This strategy is simple to understand and can identify compounds with rather high confidence (level 2; Figure 4 ) but limited by a previous investigation and known compounds [71]. Currently, a large-scale data comparison can be accomplished using the WEIZMASS NP library [72]; however, in comparison to the general strategy, alternative improvement strategies require researchers to discover more NPs when a metabolite is initially identified.
The advantages and disadvantages of four strategies and corresponding quality of metabolite annotations.
These improved strategies can be divided into three stages. The first stage of the improved strategy is “automatic annotation for known compounds,” which uses the database to automatically retrieve all fragments of the queried spectra, thus focusing on the available information of existing mass spectral database. The second stage of the improved strategy is “using the known spectral features to analyze the queried spectra.” It is necessary to analyze and predict the spectral features of the target NPs first, then find all compounds with similar spectral features in the queried data set to further annotate the structures, which focuses on obtaining all information from known spectra and minimizing the structural possibility of queried spectral annotations. The improved strategy of the third stage is “comprehensively annotate all compounds and generate hypothetical structures,” which refers to using all current NP databases to retrieve structures as much as possible (perhaps most of the structures lack spectral data) and generate hypothetical structures, which is only one of the three strategies to generate a unique structure, but the success of this strategy is dependent on the number of target compound populations in the existing database and ranking of candidate structures in massive possible structures.
3.2 Improved strategy I: automatic annotation for known compounds
The first improved strategy, “automated annotation for known compounds,” is first based on rapid screening of the precursor ion, m/z, to locate the MS/MS spectrum, then compare the queried MS/MS spectrum with the MS/MS spectra database. This strategy requires a database covering MS/MS spectra obtained in different analysis conditions, such as the ReSpect database. Currently, many databases receive. MGF files (stored MS/MS fragmentation data), as exemplified by GNPS, which has a tool (TREMOLO) [73] developed for fast automatic retrieval and MS/MS data matching. Due to the large amount of databases to be queried, this strategy is time-consuming (level 3; Figure 4 ). Although this technique can efficiently annotate MS/MS spectra with accurate matches, the searched spectra are usually not annotated due to the limited number of NPs in most existing databases. To overcome such limitations, the current tendency is to use extended in silico databases rather than being limited to experimental databases. For example, Wang et al. [53] used CFM-ID to perform computer simulations and predict MS/MS spectra, and further built an in silico DB (including >170,000 MS/MS spectra predicted based on existing structures) on the basis of a large database containing only NP structures [74], which remains the most widely used in silico DB to date for improving NP annotation [75]. Such a predicted spectral DB can substantially complement existing experimental DBs, such as YMDB [76] ( Table 2 ). The combination of in silico DBs with the experimental DBs greatly expands the amount of available spectral information, providing an improved alternative for fast de-replication of NPs.
3.3 Improved strategy II: de-replication via known spectral features
The improved strategy of the second stage “de-replication via known spectral features” can be achieved by restricting the search of NP structures to specific species or genera (literature or DB search) and generating a given list of MS/MS fragments and corresponding molecular formulas. Known spectral features are used, such as masses or fragment sets from target compounds, to query spectral data containing sets of these features. Annotation can then focus on a subset of the entire dataset or a feature mass range of the MS/MS spectrum, which saves a lot of time and effort (level 4; Figure 4 ). Tools, such as MS2Analyzer and MS2LDA, exploit this idea to find user-defined specific mass fragments, neutral losses, or hypothesis neutral losses in mass spectral data [68]. Such strategies are effective but have not been widely used for NP discovery because the strategy relies on the pre-resolved characteristic fragmentation and fragmentation patterns of target compounds and specific NP databases with searchable biological sources.
3.4 Improved strategy III: structural hypothesis for unknown compounds
The improved strategy of the third stage is to “comprehensively annotate all compounds and generate hypothetical structures,” which generally includes the following five steps (level 5; Figure 4 ) [7].
The first step is an analysis of MS spectra to search for adducts, isotopes, and neutral losses. Generally, this interpretation is not too complicated and can be performed manually for spectra produced in specific ionization modes; for example, electrospray ionization (ESI) mainly produces molecular ion peaks in the form of single or multiple adducts [77]. This step is critical for determining the molecular weight of the detected compound. The efficiency of NP de-duplication can be considerably increased if molecular ion peak selection can be conducted automatically prior to MS spectrum annotation. At present, the adduct/isotope/complex search algorithms of data processing platforms, such as CAMERA [29], Mz.unity [78], and MZmine [25], can combine and extract adduct ions to generate the most likely molecular ions, then automate this step.
The second step is to determine the molecular formula of the detected ions based on the MS information on its m/z, spectral accuracy, and MS fragmentation pattern. Many types of software are available to determine molecular formula, such as the companion software for specific MS instruments or more general software (Sirius [79] and MZmine [25]), most of which take MS/MS data into consideration. Such tools perform better if the possible atoms present in the ionized molecules are accurately set. The isotopic patterns of some atoms can also greatly improve the detection power, thus making the isotopic patterns detectable and added to the “possible atom list” used for molecular formula calculations [80].
The third step is to search the molecular formula within available databases ( Table 2 ) to obtain a list of hypothetical structures. This is one of the most time-consuming processes in the process due to the vast number of possible databases. To speed up this process, more general databases, such as PubChem [81], should be considered; however, the number of hypothetical structures associated with NPs is mixed among many synthetic compounds, which may complicate the determination of accurate annotations. Interestingly, step 2 (after correction for the considered adduct ion) can sometimes be skipped by searching the exact mass directly in the databases. However, this faster strategy may lead to more hypothetical structures. Only performing this process in DNP [82] limits the results to NPs only.
The fourth step is to reduce the number of hypothetical structures based on chemical taxonomic information [83]. Depending on the biological matrix from which the compound is obtained, the number of structures selected in subsequent steps can be reduced. For example, in the case of the analysis of fungal extracts, metabolites reported by plants that match MS may receive a low score of annotation candidates (or even not be considered); however, such comparisons are still largely manual, even though the information is available in some DBs ( Table 2 ). Efforts are currently underway in many DBs to include chemotaxonomic information to automate this process [84].
The fifth step is to determine the most likely structure among the generated structures after the above four steps. First, manual interpretation of acquired MS/MS spectra was used to help determine the unique structure when searching for available spectral data in the DBs or literature data when no fragment spectra are available. The development of in silico DBs has made it possible to identify appropriate annotations in all hypothesized structures. CFM-ID [53] generates computer fragmentation spectra that can be compared with acquired MS/MS spectra, which uses various algorithms to systematically divided compounds into possible fragments for manual or automated comparison with experimental data. Other tools, including MAGMA [51], MetFrag [50], and MS-Finder [85], search structured DBs for possible candidate molecules, then search within the structured DBs for possible fragments that match experimental data and use different scoring algorithms to rank the candidate structures found. Most of these tools take into account the fragmentation of [M+H]+ or [M−H]− adduct ions, where [M+H]+ is usually more relevant because the DB in the positive ion mode is a larger scale and provides a larger training set for developing the algorithm, therefore fragments with other adduct ions may not be accurately presumed. In addition, tools, such as CSI:fingerID [54], ChemDistiller [86], and other tools to query the structural database without an in silico DB, are also effective alternatives in the process of hypothetical structure deduction.
4. COMBINATION OF MNS WITH OTHER TECHNIQUES
4.1 Mass spectrometry imaging
To date, most NP analyses have been performed with the assistance of MS and NMR using extracts after sample homogenization. While these methods are extremely useful, information about the spatial context of NPs in heterogeneous tissues or cells is lost during analysis. In addition, highly-localized NPs may be diluted beyond the detection limit of the extract [87]. Mass spectrometry imaging (MSI) is a well-established analytical tool that can directly map various chemical classes from different biological samples, thus providing information on analyte identity, relative abundance, and spatial distribution. MSI has gained popularity over the past decade due to its non-targeting and label-free nature. Analytes of interest do not need to be pre-selected prior to MSI analysis, and can be detected in most cases without any chemical modification or labeling. In contrast, most histochemical staining techniques require the use of specific antibodies [88]. Most importantly, the spatial chemical information provided by MSI is more specific than that provided by other types of microscopic imaging techniques, as well as more intuitive than that provided by colorimetric imaging.
MN can be combined with mass spectrometry imaging to explore the specific chemical space of NPs, which means combining information, such as molecular mass and spatial distribution, to provide visualization of molecules on complex surfaces. Within these specific chemical spaces, it is possible to gain insight into how the “molecular dialogue” (the exchange of chemical signals or compounds between different organism) affects the relationships, such as positive (commensalism, mutualism, and symbiosis) or negative (predation, parasitism, and antibiosis), assisting in the identification of potential symbiotic or antagonistic relationships, and facilitate the discovery of new NPs with useful biological activities. Vallet et al. [89] explored the interaction between a fungus (Paraconiothyrium variabile, Montagnulaceae) and a bacterium (Bacillus subtilis, Bacillaceae), both endophytes of Cephalotaxus harringtoni (Taxaceae), to determine the features that exist in interspecific communication ( Figure 5 ). Because these two species were observed to exhibit a strong and unique antagonism that was not observed between other plant microbiotas, the AcOEt extracts of B. subtilis and C. harringtonia, as well as the MS/MS data of the competition zone, have been submitted to the GNPS platform to generate a MN to compare the metabolites produced in the competition zone with those independently produced by each microorganism [90]. De-replication by the GNPS database annotated a cluster containing surfactin-like molecules, including surfactins C-13, C-14, and C-15, and the hydrolyzed derivatives. These compounds were all detected in bacterial and competitive zone extracts alone. Because these molecules are known to inhibit the growth of other fungi, the authors hypothesized that P. variable had developed an antagonistic mechanism that would lead to the hydrolysis of these features. To confirm this finding, the MSI of the microbial competition between these two species was performed using MALDI-TOF and TOF-SIMS. The hydrolyzed surfactins were detected during the interspecific competition of endophytic microorganisms.

4.2 Genome mining for biosynthetic gene clusters
There are currently two approaches with which to discover novel NPs: “upstream” at the genome level; or “downstream” at the metabolite level [91]. Genome sequencing technologies have evolved over the last few decades, making it cheaper and faster to obtain a complete genome. Genome mining, the process of extracting information from genome sequences, has emerged as a key approach in the discovery of microbial NPs, particularly when the producing organism is a bacterium. Biosynthetic gene clusters (BGCs) serve as the core of bacterial biosynthetic pathway organization. BGCs typically encode multidomain enzymes, like polyketide synthases (PKS) and non-ribosomal peptide synthases (NRPS), as well as transporters and decorating enzymes, including halogenases, oxidases, and cyclases [92].
MN has been combined with genome mining to explore deeper into the biosynthetic gene clusters involved for metabolite production. The information can be used to improve the detection, isolation, and structural prediction of novel NPs produced by an organism. Kleigrewe et al. [93] investigated the chemical diversity of marine cyanobacteria using this link between genomes and metabolomics data. Moorea producens 3L, M. producens JHB, and M. bouillonii PNG were chosen in this study and the genomes of these species were sequenced and analyzed for recognized biochemical pathways, with the aim to identify similar or nearly identical biosynthetic genes in the three strains [94]. As a result, a regulatory serine-histidine kinase gene was found in the mixed biosynthetic pathway responsible for the production of the above-mentioned active chemicals in two M. producens strains. Considering that this regulatory kinase was highly homologous with 96.1% similarity between these two strains, the presence of the gene encoding this regulatory enzyme in the M. bouillonii PNG genome sequence could result in the identification of additional novel NP biosynthesis gene clusters. Authors then identified a highly homologous sequence in the M. bouillonii PNG genome and explored the gene neighborhood of this kinase, which revealed a new biosynthetic gene cluster with several unique features. Using MN to analyze the metabolic pathways of each strain, the authors assessed the potential expression of metabolites of this gene cluster. In the generated MN, clusters containing the above molecules were quickly identified. Furthermore, two families of molecules produced by M. bouillonii PNG attracted the attention of the authors because the isotopic pattern of the precursor ions indicated the presence of dichloro- and trichloro-species. Thus, three new NPs (columbamides A, B, and C) were discovered ( Figure 6 ).

4.3 Stable isotope labeling
Isotopes, unlike radionuclides, have stable nuclei, thus making isotopes a safe choice for labeling techniques. In nature, the overall abundance of heavy stable isotopes is low (5%). Using radiation detectors to study biosynthetic pathways of radiolabeled substrates date back to the 1950s [95]. Recent advances in mass spectrometry have enabled stable isotope labeling without the risk of handling radioactive materials. One approach is to use 13C labeling to clarify biosynthetic pathways by adding known precursors of the target compound to the cultivation media of the organism, then comparing the mass spectrum of a given compound with the predicted 13C labeling pattern [96]. This approach has been used in many biosynthetic pathway investigations, such as asticolorin [97], aflatoxin [98], and yanuthone D [99].
Additionally, many studies have shown that linear non-ribosomal peptides can be characterized by culturing bacteria in the presence of labeled amino acids using MS/MS analysis [100]. Klitgaard et al. [101] used stable isotope labeling combined with MN to study the biosynthetic pathway of nidulanin A ( Figure 7 ) and related metabolites produced by Aspergillus nidulans, and detected numerous labeled known and unknown compounds. As a result, samples were obtained from fungi cultivated with and without labeled amino acids and analyzed using LC-MS/MS in the positive mode to create MN. According to the labeling experiments, nodes in MN are highlighted that differ in m/z from the predicted mass change from the introduction of stable isotope-labeled amino acids.

5. CONCLUSION AND PERSPECTIVES
NPs have produced numerous success stories in drug discovery, yet the discovery and design of NPs still face numerous challenges, including trace amounts, complex extracts, unknown biological activity, missing biological targets, difficult chemical synthesis, complex structure-activity/property relationship studies, difficult pharmacokinetic properties (ADME), and toxicity, resulting in a cessation of NP-related drug discovery research. However, laboratory and computer scientists continue to be amazed by NPs for their unique ability to bind biological drug targets precisely for their therapeutic potentials. Drug discovery based on bioactive NP scaffolds will continue to be a major research area for NPs in the future. Bioinformatics advancements in recent years have reversed the laborious and time-consuming process of NP drug discovery, leading to the emergence of numerous powerful tools and platforms.
MN analysis, as a versatile and convenient tool for exploring NPs, has been widely used as a basic strategy for metabolite data analysis in NP research; however, network analysis based on mass spectrometry has limits because many techniques rely largely on factors, such as mass spectrometry type, measurement methodologies, and metabolite structure information. The effective experimental mass spectrometry data contained in the database only account for a small portion of the reported NPs, far from meeting the huge demand for NP structural identification. Although some breakthroughs have been made in structure-based computational prediction of mass spectrometry, there are still significant challenges in predicting when and how NPs will fragment under different modes, such as collision-induced dissociation (CID)-type fragmentation based on ESI. Although computer annotation strategies have shown powerful potential in filtering large datasets, the reliability of the annotation still needs to be ranked manually. With the development of artificial intelligence-assisted decision-making tools, the situation may soon change. The latest advancements in annotation tools make it possible to search for computer-generated structures in NP databases, thus replacing the traditional de-replication process based on molecular formula and accurate mass. The use of machine learning algorithms can lead to more effective structure prediction. MN technology is constantly expanding and enriching its applications, clearly paving the way for exciting NP drug discovery.