
Introduction
Coronary artery disease (CAD) continues to be the leading cause of death worldwide [1]. Percutaneous coronary intervention (PCI) and drug-eluting stent (DES) implantation significantly improve the outcomes of CAD [2]. However, in-stent restenosis (ISR) remains a major obstacle to the long-term success of DES in some patients, and the ability to predict the likelihood of restenosis is poor. Therefore, patients with a high risk of restenosis must be identified, and research has attempted to identify biomarkers of restenosis. Plasma levels of trimethylamine N-oxide (TMAO), a metabolite produced by gut microorganisms from digested red meat, are predictive of an increased risk of cardiovascular disease [3]. Specifically, elevated plasma TMAO levels are associated with an increased risk of incident major adverse cardiovascular events [4] and a high atherosclerotic burden in patients with CAD [5]. Because ISR shares pathologic similarities with atherosclerosis, plasma TMAO levels might be associated with ISR in patients with CAD. Unfortunately, no studies have described plasma TMAO levels in patients receiving PCI, or the relationship of TMAO with ISR. Whether TMAO levels are altered in patients with restenosis after DES implantation must be elucidated. In this article, we sought to explore whether fasting plasma TMAO levels might be associated with ISR, and the relationship between TMAO and clinical characteristics.
Materials and Methods
Study Participants
This was a single center retrospective case-control study. We recruited patients with acute coronary syndrome (ACS) diagnosed according to American and European guidelines [6–8] who were admitted to the Beijing Tsinghua Changgung Hospital between the 1st of April 2015 and the 31st of August 2018. Patients with valvular heart disease, cardiomyopathy, severe congenital heart disease, congestive heart failure, chronic or current infections, autoimmune disease, chronic kidney disease, chronic hepatic disease, and an age <18 or >75 years were excluded. In total, 771 patients were implanted with at least one sirolimus or everolimus eluting stent in at least one of the main coronary arteries according to published guidelines [9]. The implanted stents were 18–38 mm in length and 2.25–3.5 mm in diameter. During the procedure, patients received a bolus injection of heparin. All patients received aspirin (100 mg/d) and clopidogrel (300–600 mg loading dose followed by 75 mg/d for at least 12 months). No patients had major procedure-related complications. All patients received statins and medical therapies according to published guidelines [6–8]. Patients with hyperglycemia were confirmed to have diabetes mellitus (DM) and were treated according to published guidelines [10], to maintain ideal serum glucose levels. Postprandial blood glucose was monitored but not analyzed in our study. Coronary angiography (CAG) was repeated 9–12 months after PCI in 64 symptomatic patients. Among the 64 patients (Figure 1), 15 patients were found to have ISR and were included in this study (ISR group); another 49 patients without ISR were also included in this study (non-ISR group). Each participant was assigned a randomized research number, and the authors had no access to personal information that could identify individual participants during or after data collection. The protocol was approved by the ethics committee of Beijing Tsinghua Changgung Hospital (19032-0-01). All participants were aware of the investigative nature of the study and provided written consent to participate. In-stent restenosis was defined as a stenosis diameter of ≥50% occurring in the segment inside the stent or within 5 mm of the stent edge [9].

Patient Flow-Chart.
In total, 771 patients with acute coronary syndromes (ACS) were implanted with at least one drug-eluting stent (DES) in at least one of the main coronary arteries. Coronary angiography (CAG) was repeated 9–12 months after Percutaneous coronary intervention (PCI) in 64 symptomatic patients. Among the 64 patients, 15 were found to have in-stent restenosis (ISR); 49 patients did not have ISR. Plasma trimethylamine N-oxide (TMAO) and clinical characteristics were compared between groups.
Laboratory Analysis and Measurement of TMAO
Blood samples were collected after at least a 12-hour fast in the morning into vacuum tubes containing ethylenediamine tetraacetate acid for the measurement of lipid profiles, fasting blood glucose (FBG), liver and renal function and high sensitivity C-reactive protein with colorimetric enzymatic assays and an Auto-Analyzer (HITACHI-7170, HITACHI, Chiyoda, Tokyo, Japan). Fasting glucose and hemoglobin A1c levels were determined at the central chemistry lab of Beijing Tsinghua Changgung Hospital. Plasma was immediately processed and frozen at −80 °C until analysis of TMAO. Plasma TMAO levels were determined with stable isotope dilution high-performance liquid chromatography with tandem mass spectrometry on an API 4000 triple quadrupole mass spectrometer (AB SCIEX, Framingham, Massachusetts, USA), as previously described [11].
Syntax Score and Angiographic Analysis
CAG was performed according to the standard Judkins technique. CAGs were analyzed by two cardiologists who were blinded to the clinical data. Minimal luminal diameter, reference diameter and percentage diameter stenosis were assessed on the basis of quantitative coronary angiography. From the baseline diagnostic angiogram, each coronary lesion producing ≥50% diameter stenosis in vessels ≥1.5 mm was scored separately, then summed to provide the overall Syntax score, according to the Syntax score algorithm [12].
Statistical Analysis
Descriptive data are presented as mean ± standard deviation for continuous variables, as medians (minimum and maximum) for discontinuous variables and as frequencies for categorical variables. The clinical and laboratory data were analyzed with an independent t test or one-way analysis of variance for continuous variables; a nonparametric test (Mann–Whitney test or Kruskal–Wallis test) for discontinuous variables, or a chi-square test for categorical data. Correlations between plasma TMAO and other variables, such as the Syntax score, were evaluated with Pearson or Spearman analysis. The odds ratios and the corresponding 95% confidence intervals were calculated. Significance was assumed at a two-sided P value <0.05. Statistical analysis was performed in SPSS 19.0 (SPSS Inc., Chicago, IL).
Results
Patient Characteristics
As shown in Figure 1, this was a single center retrospective case-control study performed in 771 patients with ACS who underwent PCI and DES implantation. Among them, 64 symptomatic patients had repeated CAG 9–12 months after PCI, and 15 patients had ISR (ISR group). Another 49 patients without ISR were included in this study (non-ISR group). The clinical characteristics of the study participants are summarized in Table 1 according to the presence or absence of ISR. Compared with the non-ISR patients, patients with ISR were more likely to have a history of diabetes mellitus (80.0% vs 37.5%, P=0.02), higher FBG level (8.40 ± 3.42 mmol/L vs 5.75 ± 1.01 mmol/L, P=0.01), higher neutrophil to lymphocyte ratio (NLR) (3.19 ± 0.95 vs 2.44 ± 1.04, P=0.04) and lower platelet number (186.93 ± 45.04×10⁹/L vs 232.94 ± 56.73×10⁹/L, P=0.02). We found no significant difference in plasma TMAO (247.40 ± 181.30 ng/mL vs 204.86 ± 172.39 ng/mL, P=0.67) levels or other clinical characteristics between the ISR and non-ISR groups (Figure 2).
Clinical Characteristics and TMAO Level in ISR and Non-ISR Patientsa.
| Parameters | ISR | Non-ISR | P value |
|---|---|---|---|
| n = 15 | n = 49 | ||
| Age (yrs) | 66.1 ± 8.8 | 63.5 ± 9.4 | 0.44 |
| Gender (Male%) | 80 | 75 | 0.74 |
| BMI (kg/m2) | 27.6 ± 4.7 | 27.0 ± 3.7 | 0.39 |
| Smoking (%) | 10 (66.7%) | 8 (50.0%) | 0.36 |
| Hypertension (%) | 14 (93.3%) | 12 (75.0%) | 0.17 |
| Diabetes (%) | 12 (80.0%) | 6 (37.5%) | 0.02* |
| Hyperlipidemia (%) | 14 (93.3%) | 12 (75.0%) | 0.17 |
| Myocardial Infarction history (%) | 9 (60.0%) | 9 (56.3%) | 0.84 |
| LDL-C (mmol/L) | 1.93 ± 0.60 | 2.04 ± 0.76 | 0.65 |
| HDL-C (mmol/L) | 0.90 ± 0.23 | 0.94 ± 0.29 | 0.67 |
| TCHO (mmol/L) | 3.84 ± 0.92 | 3.62 ± 1.12 | 0.57 |
| TG (mmol/L) | 1.53 ± 0.97 | 1.27 ± 0.44 | 0.96 |
| Apoa1 (mmol/L) | 1.25 ± 0.24 | 1.21 ± 0.29 | 0.71 |
| Lp(a) (mg/L) | 330.04 ± 425.43 | 386.44 ± 368.83 | 0.70 |
| FBG (mmol/L) | 8.40 ± 3.42 | 5.75 ± 1.01 | 0.01** |
| HbA1c (%) | 7.03 ± 1.43 | 6.28 ± 1.10 | 0.11 |
| Cr (µmol/L) | 86.85 ± 24.89 | 75.68 ± 0.24 | 0.19 |
| UA (µmol/L) | 403.20 ± 112.05 | 365.27 ± 96.89 | 0.33 |
| ALT (U/L) | 22.87 ± 11.38 | 24.29 ± 20.17 | 0.81 |
| AST (U/L) | 26.65 ± 12.11 | 22.79 ± 7.61 | 0.29 |
| TBIL (µmol/L) | 15.35 ± 7.58 | 11.16 ± 2.90 | 0.06 |
| DBIL (µmol/L) | 5.78 ± 2.62 | 4.37 ± 1.21 | 0.07 |
| Fib (g/L) | 2.79 ± 0.81 | 2.82 ± 0.61 | 0.92 |
| D-Dimer (mg/L) | 0.28 ± 0.17 | 0.33 ± 0.21 | 0.64 |
| ALB (g/L) | 41.92 ± 4.96 | 41.37 ± 2.58 | 0.70 |
| NT-proBNP (pg/mL) | 595.05 ± 394.12 | 196.85 ± 60.74 | 0.30 |
| WBC (109/L) | 6.81 ± 1.25 | 5.98 ± 1.33 | 0.08 |
| Neu (109/L) | 4.34 ± 1.24 | 3.59 ± 0.92 | 0.06 |
| Lym (109/L) | 1.47 ± 0.51 | 1.63 ± 0.57 | 0.42 |
| NLR | 3.19 ± 0.95 | 2.44 ± 1.04 | 0.04* |
| Mono (109/L) | 7.84 ± 2.09 | 8.62 ± 1.80 | 0.27 |
| RDW (%) | 12.67 ± 0.67 | 13.13 ± 1.65 | 0.32 |
| HGB (g/L) | 133.20 ± 21.47 | 131.94 ± 15.70 | 0.85 |
| PLT (109/L) | 186.93 ± 45.04 | 232.94 ± 56.73 | 0.02* |
| MPV (fL) | 10.83 ± 1.04 | 10.26 ± 0.83 | 0.10 |
| Syntax score | 13.03 ± 6.00 | 9.06 ± 4.89 | 0.06 |
| LVEF (%) | 58.13 ± 7.96 | 61.75 ± 4.42 | 0.13 |
| TMAO (µmol/L) | 247.40 ± 181.30 | 204.86 ± 172.39 | 0.67 |
aFigures highlighted in bold on this table signify P<0.05; *Significant; **Very significant.
Abbreviations: BMI, Body mass index; LDL-C, Low Density Lipoprotein Cholesterol; HDL-C, High Density Lipoprotein Cholesterol; TCHO, Total Cholesterol; TG, Triglyceride; Apoa1, apolipoprotein A-I; Lp (A), Lipoprotein (A); FBG, Fasting blood glucose; Cr, creatinine; UA, uric acid; ALT, alanine aminotransferase; AST, aspartate aminotransferase; TBIL, Total bilirubin; DBIL, Direct bilirubin; Fib, Fibrinogen; ALB, albumin; NT-proBNP, N-terminal (NT)-pro hormone BNP; WBC, white blood cell; Neu, Neutrophils; Lym, lymphocyte; NLR, Neutrophil-Lymphocyte Ratio; RDW, Red Cell Distribution Width; HGB, hemoglobin; PLT, platelet; MPV, Mean Platelet Volume; LVEF, Left Ventricular Ejection Fraction; TMAO, Trimethylamine N-Oxide.

Plasma Trimethylamine N-Oxide (TMAO) Levels in the In-Stent Restenosis (ISR) and Non-ISR Groups.
The mean TMAO level in the ISR group was 247.40 ± 181.30 μmol/L, and that in the non-ISR group was 214.80 ± 173.58 μmol/L. The P-value between groups was 0.619, indicating no significant difference.
Association Between Plasma TMAO Levels and Clinical Characteristics
To clarify the association between plasma TMAO levels and clinical characteristics, we performed a correlation analysis between TMAO and clinical characteristics. As shown in Table 2 and Figure 3, the plasma TMAO level was significantly positively correlated with diabetes mellitus (r=0.45, P=0.01), the serum HbA1c level (r=0.39, P=0.03) and the serum creatinine level (r=0.47, P=0.007), and was significantly negatively correlated with female sex (r=–0.39, P=0.03). However, no significant correlation between ISR and plasma TMAO level was observed.
Correlation Between Clinical Characteristics and Plasma TMAO Levela.
| Parameters | Pearson/Spearman correlation | P value |
|---|---|---|
| Age (yrs) | 0.22 | 0.23 |
| Gender (Male%) | −0.39 | 0.03* |
| BMI (kg/m2) | 0.13 | 0.50 |
| Smoking (%) | −0.10 | 0.61 |
| Hypertension (%) | −0.21 | 0.27 |
| Diabetes (%) | 0.45 | 0.01* |
| Hyperlipidemia (%) | 0.19 | 0.32 |
| Myocardial Infarction history (%) | 0.18 | 0.33 |
| LDL-C (mmol/L) | −0.12 | 0.52 |
| HDL-C (mmol/L) | −0.29 | 0.12 |
| TCHO (mmol/L) | 0.001 | 0.99 |
| TG (mmol/L) | 0.16 | 0.39 |
| Apoa1 (mmol/L) | −0.30 | 0.11 |
| Lp(a) (mg/L) | −0.11 | 0.58 |
| FBG (mmol/L) | 0.33 | 0.08 |
| HbA1c (%) | 0.39 | 0.03* |
| Cr (µmol/L) | 0.47 | 0.007** |
| UA (µmol/L) | 0.19 | 0.31 |
| ALT (U/L) | 0.06 | 0.76 |
| AST (U/L) | 0.03 | 0.88 |
| TBIL (µmol/L) | −0.01 | 0.98 |
| DBIL (µmol/L) | 0.01 | 0.96 |
| Fib (g/L) | −0.04 | 0.84 |
| D-Dimer (mg/L) | 0.05 | 0.80 |
| ALB (g/L) | 0.02 | 0.91 |
| NT-proBNP (pg/mL) | 0.12 | 0.54 |
| WBC (109/L) | 0.35 | 0.05 |
| Neu (109/L) | 0.18 | 0.35 |
| Lym (109/L) | −0.08 | 0.69 |
| NLR | 0.20 | 0.29 |
| Mono (109/L) | 0.20 | 0.28 |
| RDW (%) | 0.12 | 0.52 |
| HGB (g/L) | −0.04 | 0.84 |
| PLT (109/L) | 0.04 | 0.82 |
| MPV (fL) | 0.10 | 0.59 |
| Syntax score | 0.03 | 0.87 |
| LVEF (%) | −0.16 | 0.39 |
| ISR | 0.20 | 0.29 |
aFigures highlighted in bold on this table signify P<0.05.
*Significant; ** Very significant.
Abbreviations: BMI, Body mass index; LDL-C, Low Density Lipoprotein Cholesterol; HDL-C, High Density Lipoprotein Cholesterol; TCHO, Total Cholesterol; TG, Triglyceride; Apoa1, apolipoprotein A-I; Lp (A), Lipoprotein (A); FBG, Fasting blood glucose; Cr, creatinine; UA, uric acid; ALT, alanine aminotransferase; AST, aspartate aminotransferase; TBIL, Total bilirubin; DBIL, Direct bilirubin; Fib, Fibrinogen; ALB, albumin; NT-proBNP, N-terminal (NT)-pro hormone BNP; WBC, white blood cell; Neu, Neutrophils; Lym, lymphocyte; NLR, Neutrophil-Lymphocyte Ratio; RDW, Red Cell Distribution Width; HGB, hemoglobin; PLT, platelet; MPV, Mean Platelet Volume; LVEF, Left Ventricular Ejection Fraction; ISR, In-Stent Restenosis.

Association Between ISR and Clinical Characteristics
We performed correlation analysis to clarify the association between ISR and clinical characteristics. As shown in Table 3 and Figure 4, ISR was significantly positively correlated with diabetes mellitus (r=0.43, P=0.02), FBG level (r=0.45, P=0.01), NLR (r=0.39, P=0.03) and the syntax score (r=0.37, P=0.04), but was significantly negatively correlated with platelets (r=0.39, P=0.03).
Correlation Between Clinical Characteristics and ISRa.
| Parameters | Pearson/Spearman correlation | P value |
|---|---|---|
| Age (yrs) | 0.09 | 0.64 |
| Gender (Male%) | −0.06 | 0.75 |
| BMI (kg/m2) | −0.02 | 0.92 |
| Smoking (%) | 0.17 | 0.36 |
| Hypertension (%) | 0.25 | 0.18 |
| Diabetes (%) | 0.43 | 0.02* |
| Hyperlipidemia (%) | 0.25 | 0.18 |
| Myocardial Infarction history (%) | 0.04 | 0.84 |
| LDL-C (mmol/L) | −0.01 | 0.97 |
| HDL-C (mmol/L) | −0.04 | 0.82 |
| TCHO (mmol/L) | 0.20 | 0.27 |
| TG (mmol/L) | −0.01 | 0.99 |
| Apoa1 (mmol/L) | 0.04 | 0.86 |
| Lp(a) (mg/L) | −0.18 | 0.35 |
| FBG (mmol/L) | 0.45 | 0.01* |
| HbA1c (%) | 0.32 | 0.08 |
| Cr (µmol/L) | 0.27 | 0.14 |
| UA (µmol/L) | 0.19 | 0.32 |
| ALT (U/L) | 0.05 | 0.78 |
| AST (U/L) | 0.12 | 0.51 |
| TBIL (µmol/L) | 0.28 | 0.13 |
| DBIL (µmol/L) | 0.29 | 0.11 |
| Fib (g/L) | −0.09 | 0.64 |
| D-Dimer (mg/L) | 0.09 | 0.63 |
| ALB (g/L) | 0.06 | 0.74 |
| NT-proBNP (pg/mL) | 0.12 | 0.54 |
| WBC (109/L) | 0.36 | 0.05 |
| Neu (109/L) | 0.34 | 0.06 |
| Lym (109/L) | −0.05 | 0.77 |
| NLR | 0.39 | 0.03* |
| Mono (109/L) | −0.23 | 0.22 |
| RDW (%) | −0.13 | 0.50 |
| HGB (g/L) | 0.04 | 0.83 |
| PLT (109/L) | −0.39 | 0.03* |
| MPV (fL) | 0.27 | 0.14 |
| Syntax score | 0.37 | 0.04* |
| LVEF (%) | −0.27 | 0.14 |
aFigures highlighted in bold on this table signify P<0.05.
*Significant.
Abbreviations: BMI, Body mass index; LDL-C, Low Density Lipoprotein Cholesterol; HDL-C, High Density Lipoprotein Cholesterol; TCHO, Total Cholesterol; TG, Triglyceride; Apoa1, apolipoprotein A-I; Lp (A), Lipoprotein (A); FBG, Fasting blood glucose; Cr, creatinine; UA, uric acid; ALT, alanine aminotransferase; AST, aspartate aminotransferase; TBIL, Total bilirubin; DBIL, Direct bilirubin; Fib, Fibrinogen; ALB, albumin; NT-proBNP, N-terminal (NT)-pro hormone BNP; WBC, white blood cell; Neu, Neutrophils; Lym, lymphocyte; NLR, Neutrophil-Lymphocyte Ratio; RDW, Red Cell Distribution Width; HGB, hemoglobin; PLT, platelet; MPV, Mean Platelet Volume; LVEF, Left Ventricular Ejection Fraction.
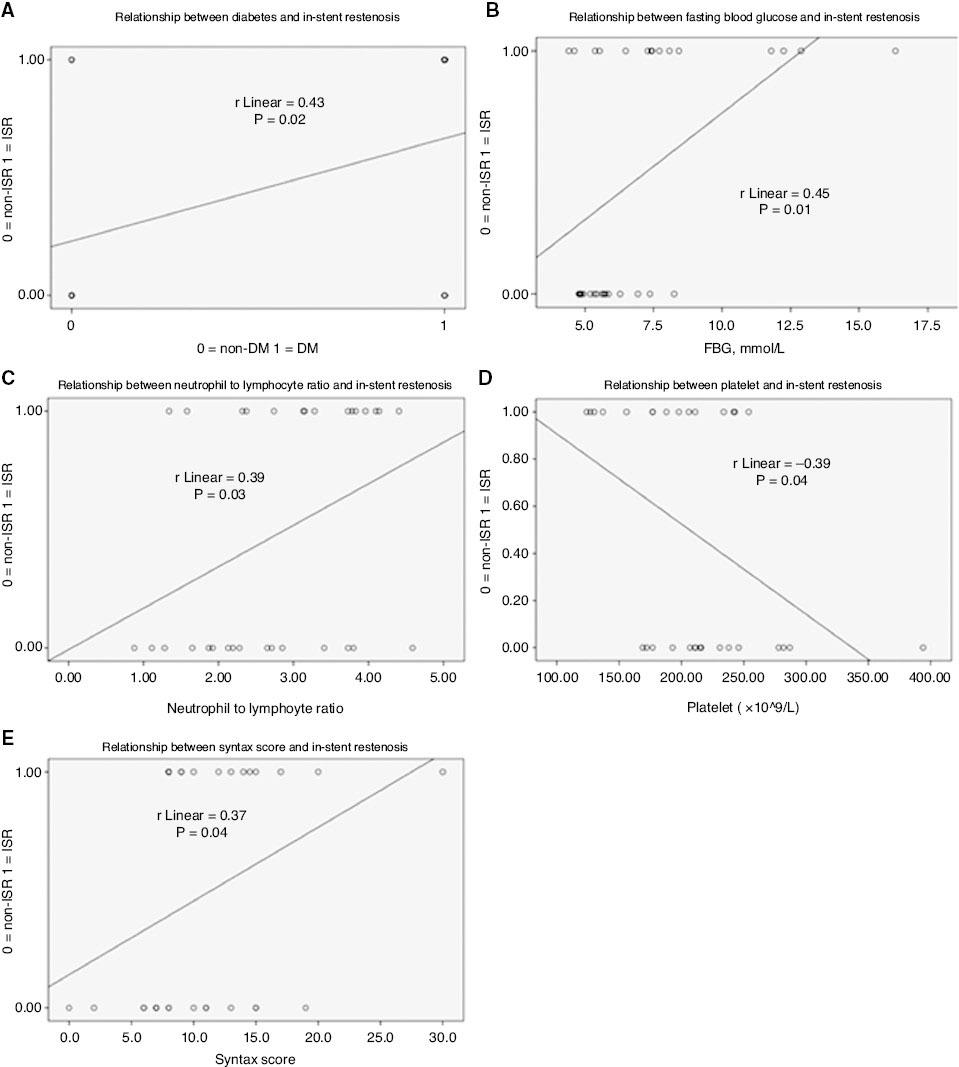
Correlation Between In-Stent Restenosis and Clinical Characteristics.
In-stent restenosis was correlated with diabetes (A), fasting blood glucose (B), the neutrophil to lymphocyte ratio (C), platelets (D) and the Syntax score (E). The coefficient of determination (R2) and P value are listed in each panel. DM, diabetes mellitus.
We performed a multiple logistic regression analysis to construct a logistic model and identify independent predictors of in-stent restenosis. The choice of the strongest combination of independent variables was based on the highest predictive potential and the highest percentage of findings precisely predicted by the model. The logistic model included one independent predictor: FBG. Other variables were excluded from the model because they were insignificant.
The logistic regression equation for prognosis of restenosis in DES in patients with ACS was formulated as follows:

Coefficient values of the logistic model and their ORs, 95% confidence intervals and the statistical significance of each coefficient are shown in Table 4.
Independent Predictors of In-Stent Restenosis in the Logistic Equation.
| Variable | B | SE | Wald | Degree of freedom | P value | OR | 95% CI for OR | |
|---|---|---|---|---|---|---|---|---|
| Lower | Upper | |||||||
| FBG | 0.669 | 0.309 | 4.685 | 1 | 0.030 | 1.952 | 1.065 | 3.579 |
| Constant | −4.485 | 1.983 | 5.116 | 1 | 0.024 | 0.011 | – | – |
B, regression coefficient; CI, confidence interval; FBG, fasting blood glucose; OR, odds ratio; SE, standard error.
The probability of in-stent restenosis was calculated as follows:

The model had a predictive ability with 74.2% diagnostic precision and an OR of 9.635 (P=0.002).
Discussion
Previous studies have investigated the potential role of TMAO in CAD. Plasma TMAO levels have been demonstrated to predict a high atherosclerosis burden in both stable CAD and ACS [5, 13], and are associated with increased major adverse cardiovascular events in CAD [4]. Further research has indicated that chronic dietary L-carnitine supplementation in mice enhances the synthesis of TMAO and increases atherosclerosis [14]. Thus, the relationship between TMAO and in-stent restenosis is worthy of exploration. However, to our knowledge, no reports have examined the relationship between TMAO and in-stent restenosis (both coronary and non-coronary). Our study indicated no significant difference in plasma TMAO levels between the non-ISR and ISR groups (P=0.619). Correlation analysis revealed no significant correlation between the plasma TMAO level and ISR (P=0.29).
Furthermore, we identified that diabetes, FBG, NLR and the Syntax score were significantly positively correlated with ISR, whereas the platelet count was significantly negatively correlated with ISR. Moreover, FBG appeared to predict the development of ISR in patients with ACS after DES implantation. Our findings were consistent with previous reports indicating that diabetes remains a significant independent predictor of ISR and adverse events after PCI [15]. Both coronary and carotid artery stent restenosis have been associated with baseline FBG in retrospective trials [16, 17]. Our results provide substantial evidence that FBG may predict the development of ISR after DES implantation, according to a single center retrospective case-control study involving 771 patients with ACS. Other pioneering reports have shown positive correlations among NLR, CD 45+ platelets, mean platelet volume and ISR [18, 19]. Here, we demonstrated a positive correlation between NLR and ISR, but a negative correlation between platelet count and ISR. The relationship between specific subsets of platelets and ISR requires further elucidation.
Studies have reported that elevated plasma TMAO is an independent predictor of higher atherosclerotic burden (CAD) [5], whereas the Syntax score is a useful tool to evaluate plaque burden. Our investigation indicated no linear relationship between TMAO and the Syntax score. We identified that diabetes, HbA1c and creatinine were significantly positively correlated with TMAO, whereas female sex was significantly negatively correlated with TMAO. Previous reports on general patients with CAD have found that diabetes, HbA1c and creatinine are positively correlated with TMAO [20–22]. Female sex has been significantly negatively correlated with plasma TMAO [23] but positively correlated with urinary TMAO [24], thus highlighting the difference in the diet–gut microbiota–host interplay between sexes. Because the sample size of our study was limited, further multi-center large scale studies are needed to validate the findings herein.
Conclusion
In summary, this study indicates that plasma TMAO may not be associated with in-stent restenosis and plaque burden in patients with ACS after DES implantation, whereas FBG may predict the development of ISR in these patients.
Significance Statement
The plasma TMAO level was found to be an independent predictor of coronary atherosclerotic burden. We assessed whether the occurrence of ISR might be associated with plasma TMAO levels and found that plasma TMAO may not be associated with ISR and plaque burden in patients with ACS after DES implantation. However, FBG may predict the development of ISR in these patients.