
Introduction
The transfer of agriculturally sourced nutrients from the land surface to waterbodies along the source–transfer–receptor continuum has been demonstrated to have several driving factors, namely nutrient type and form, soil characteristics, distance to receptor, land management and meteorological factors (Wall et al., 2011). Regarding the latter, considerable attention has been devoted in the literature to the role of precipitation timing and intensity on the hydrological behaviour of Irish catchments and hence, their nutrient dynamics (Shore et al., 2016; Mellander et al., 2018). In accordance with the Nitrates Directive (ND) (European Commission [EC], 1991), a “closed period” is designated between 15 October and 12/15/31 January (depending on the location). During this period, the application of chemical and organic fertilisers (e.g. animal manures and spent mushroom compost with the exception of soiled water) is prohibited. This period coincides with the low soil moisture deficit (SMD) (Schulte et al., 2005) and high precipitation and recharge encountered over winter. It also corresponds to the period of low crop growth and limited nutrient utilisation. This strategy lowers the risk of overland nutrient losses. Shore et al. (2016) reported 33–54% and 36–56% of annual total phosphorus (TP) and total oxygenated nitrogen (TON) loads across five meso-scale (350 – 1,210 ha) agricultural catchments (three grassland and two arable, ranging from poor to well-drained) occurring during the 3-mo closed period. These disproportionate losses were not correlated with increased sources but corresponded to soil saturation and storm runoff. Propensity for overland losses during high rainfall is observed throughout the literature (Doody et al., 2010; McConnell et al., 2016; Schwab et al., 2017) and directly addressed in legislation (e.g. the Nitrates Action Plan [NAP]) (SI, 605, 2017) and in the design of best management practices. In Ireland, the NAP also prohibits application of organic or inorganic fertilisers when the land is frozen or snow covered. Although these conditions are relatively infrequent, it is not clear whether temperature–snowfall–hydrochemical relationships determined in more typically cold environments (e.g. Nordic countries, mountainous regions in Europe and North America) are transferable to more temperate regions (Dunn et al., 2001).
Despite a temperate climate (annual mean temperature of 9–10°C, annual average rainfall of 1,230 mm) (Walsh, 2012), Ireland was subject to unusually cold weather between 27 February and 5 March 2018. This resulted from interactions between tropical storm Emma, a low-pressure system which approached from the south-west, and a polar front nicknamed “the Beast from the East”, which brought high winds and low temperatures across Europe. This was the most significant snowstorm experienced in Ireland since 1985 (Met Éireann, 2019). Murphy (2012) reported that snow depths exceeding 10 cm occur only every 5–18 yr in inland regions (Figure 1B) and had not been observed at all in the preceding 50 yr in coastal areas. Historical events of a similar scale to the 2018 events were only recorded every 16–22 yr, and only at three meteorological stations – Casement Aerodrome, Clones and Dublin Airport. Met Éireann reported bands of snowfall occurring across the south-east of the country, gradually moving towards the midlands. Counties Wexford, Wicklow and Kildare recorded the greatest snow accumulation with depths reaching 45 cm, 69 cm and 45 cm, respectively (Met Éireann, 2019). These exceeded the previous maxima for these counties (Murphy, 2012). A return period of 50 yr for snow depths exceeding 25 cm is reported for the south-east (Murphy, 2012). While snowfall did occur throughout the island during the 2018 event, recorded depths did not exceed 30 cm except on the east coast (with the exception of drifts) (Met Éireann, 2019). Both the geographic location and the extent of the 2018 snowfall were therefore extremely unusual.

(A) Locations of well-drained and poorly drained study catchments and Met Éireann weather stations: (1) Bunclody, (2) Coolgreany, (3) Foulkesmills and (4) Johnstown. (B) Record of severe cold spells (Met Éireann, 2019).
The objective of this short communication is to document the hydrologic response and stream nutrient loading subject to an unusual cold weather event in two hydrologically contrasting Irish agricultural catchments. These responses are discussed within the context of the broader national event and with reference to typical agricultural practices and timings.
Materials and methods
Study sites
Two catchments (<12 km2) are presented herein (Figure 1A). These catchments have contrasting flow controls and have been subject to continuous stream monitoring since 2010 as part of the Irish Agricultural Catchments Programme (Mellander et al., 2015). Both sites are located in County Wexford, in the south-east of Ireland, which experienced the greatest snowfall nationally. The distance between the two catchments is ∼20 km. The catchments are characterised in detail in Fealy et al. (2010), Jordan et al. (2012), Wall et al. (2011) and McDonald et al. (2019) and summarised here.
The well-drained arable catchment (1,120 ha) consists of generally well-drained brown earth soils (Cambisols) (88%), with lesser areas including gleyic brown earths, brown podzolics and groundwater gleys. The catchment is underlain by an undulating, highly fractured Ordovician slate bedrock inter-bedded with siltstone and mudstone. Land use is 61% arable, largely winter barley production, 27% grassland and the remaining area not used for active production. Annual average rainfall (2010–2017) is 944 mm and the average March air temperature is 6.4°C. This catchment is dominated by subsurface flow pathways and exhibits a hydrologically sensitive area of only 0.1–6.2% (Thomas et al., 2016). The poorly drained grassland catchment (1,190 ha) consists largely of gleysols (71%) with some typical brown earths (Cambisols) (16%) in more upland areas. Geology is rhyolitic volcanics and slate. Land use is 77% low-intensity grassland production (beef and sheep) (c. 1.28 livestock units [LU]/ha), with limited areas of winter barley production on the remaining area. Annual average rainfall is 1,013 mm and the average March air temperature is 6.0°C. This catchment typically exhibits overland flow pathways (Mellander et al., 2012; Shore et al., 2014; Sherriff et al., 2016) and has been artificially drained by open ditches and subsurface piped drains (Shore et al., 2014). The hydrologically sensitive area of this catchment ranges between 0.4 and 19.1% (Thomas et al., 2016).
Instrumentation and data
Water quality parameters at the outlet of each catchment have been measured on a 10-min interval since 2009/2010 using a suite of bankside analysers (Sigmatax, Phophax, and Nitratax: Hach-Lange, Düsseldof, Germany). These devices report temperature, total phosphorous (TP), TRP and TON, respectively. In accordance with Melland et al. (2012) and Dupas et al. (2017), it is assumed that TON and (NO3-N) are comparable. Similarly, the discrepancy between TP and TRP is considered to represent particulate P (PP). Loads per ha were calculated by correcting total daily loads by the area of the respective catchments. Water level at the outlets was recorded on a 10-min interval using the OTT Orpheus Mini (OTT HydroMet, Kempten, Germany) in stilling wells adjacent to Corbett flat-V non-standard weirs. Discharge was calculated using ratings curves developed using the OTT Acoustic Doppler Current Metres (OTT HydroMet, Kempten, Germany) and Wiski-SKED software. Each catchment was also equipped with a meteorological station (Campbell Scientific BWS200; Campbell Scientific, Logan, Utah, USA), recording rainfall, air temperature, relative humidity, global radiation and windspeed at a 10-min interval (Mellander et al., 2012). Snow data were provided by Met Éireann for sites in Co. Wexford at daily resolution where available (Met Éireann, 2019). The meteorological data were used to model the SMD (Schulte et al., 2005), where the initial SMD was set to 0 (field capacity). The catchments were assigned to well- and poorly drained classes within the SMD model, reflecting their general soil types/hydrology. It should be noted that the SMD model is only calibrated for grassland soils and is used herein as an indicator of likely soil moisture status, rather than a direct measurement.
Met Éireann delineated the event (from a national perspective) between 27 February and 4 March 2018 (Met Éireann, 2019). Based on data from the study catchments, this manuscript subdivides the event into two phases. First, the “snowfall” phase between 27 February and 1 March during which precipitation as snowfall occurred. The period during 2–5 March is then considered to be the “thaw” phase, during which no snowfall occurred, air temperatures gradually increased and accumulated snow began to melt. Data of hourly total river discharge and average TRP concentration were used to graphically interpret the hysteresis for the melt event (Mellander et al., 2015; Sherriff et al., 2016).
Results
Antecedent conditions
Prior to the start of the cold weather event (on 27 February 2018), conditions within the study catchments were typical for the time of the year and location. Average air temperatures for January and February 2018 were 5.2°C and 3.4°C in the well-drained arable catchment compared to 2010–2017 averages of 5.2°C and 5.3°C, respectively. Average air temperatures were 6.0°C and 4.0°C in the poorly drained grassland catchment compared to 2010–2017 averages of 5.0°C and 5.2°C, respectively.
Soil moisture in the well-drained arable catchment ranged between field capacity (0 mm) and 2 mm SMD for January, with drying conditions beginning on 19 February (SMD increasing to 6 mm). These prolonged wet conditions beyond the end of the closed period meant that it was likely that many farms were close to capacity for slurry and soiled water storage. Considering the poorly drained grassland catchment, SMD was ≥0 mm (field capacity) for January and February, increasing to saturation (−10 mm SMD) for 23 d. These conditions prime the catchment for overland flow and precluded grazing or trafficking in much of the area.
Temperatures
Air temperatures fell below 0°C during the cold weather event and exhibited a similar pattern in both catchments (Figure 2). However, despite their close geographical proximity and similar air temperatures throughout the cold period, the poorly drained grassland exhibited lower water temperatures than the well-drained arable catchment and did not respond as rapidly to increasing air temperature from 2 March.
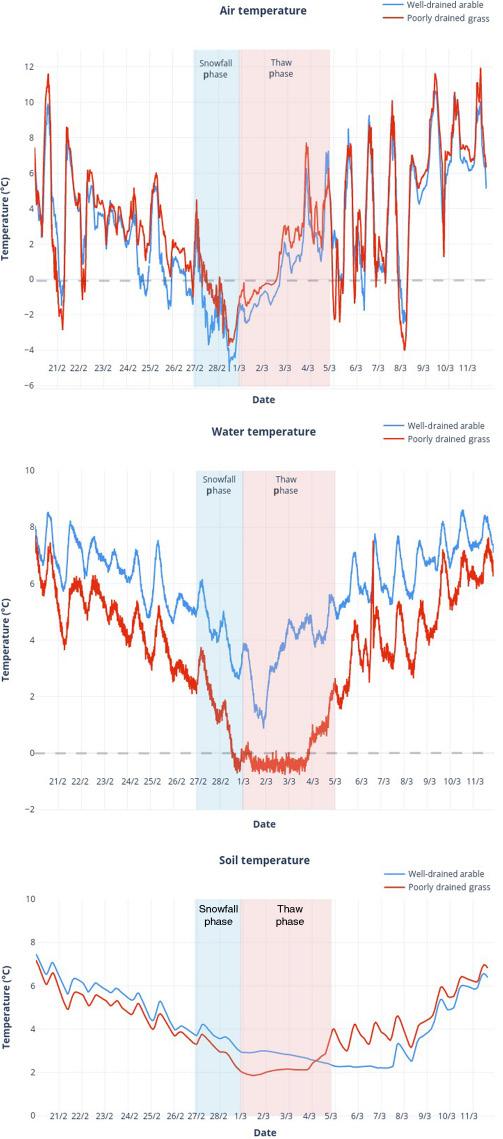
Average daily air, water and soil temperatures in the well-drained arable and poorly drained grassland catchments from 20 February to 12 March 2018. The dashed line indicates 0°C.
Water temperature fell to below 0°C for 4 d (1–4 March) in the poorly drained grassland catchment, while the well-drained arable catchment remained above 0°C throughout (Figure 2). Soil temperatures (10 cm depth) (Figure 2) declined more gradually in the well-drained catchment than in the poorly drained, and they did not begin to warm until 8 March, as opposed to 5 March in the poorly drained catchment. Soil temperatures did not fall below 0°C in either catchment. While air and water temperatures do not strongly correlate, the well-drained catchment exhibited closer relationships between air and water temperatures (R2 = 0.68) than between soil and water temperatures (R2 = 0.41), while the reverse was true of the poorly drained catchment (R2 = 0.45 and R2 = 0.90, respectively).
Snow cover/depth
Measurements of snow depth in the study catchments were not possible due to impassable road conditions; however, similar depths were shown across four localities across Co. Wexford (Figure 3, Met Éireann). While these are point measurements, drifting of up to 2 m was also reported particularly in mountainous regions, although both of the study catchments are located at relatively low elevation (≤210 m above sea level [asl]). Snow depths in the southeast of Ireland were greater than much of the rest of the country and drifts of up to 7 m were reported (Met Éireann, 2019).

Flow regime
Total daily discharge (m3/d) is presented in Figure 4. Flow during the snowfall period declined in both catchments to minima of 6,147 m3/d in the poorly drained grassland and 4,834 m3/d in the well-drained arable and began to increase on 2 March. The poorly drained grassland exhibited a large and rapid elevation in discharge, peaking by 5 March at 164,605 m3/d, before declining and exhibiting a secondary spike on 14 March at 130,438 m3/d. Discharge in the well-drained arable was slower to increase, gradually climbing to 110,324 m3/d on 14 March as groundwater pathways contributed.

Stream discharge (m3/d) for each study catchment. Cold weather and subsequent runoff events indicated.
Declines in flow during the snowfall/snow-cover period are not surprising, as precipitation was not generating runoff at that time and rather formed snow-cover and drifts in places. Despite the lack of rainfall, neither stream was considered to be exhibiting “low flow” (≥70th percentile), as groundwater contribution (post-winter recharge) was sufficient to sustain discharge above this threshold. The poorly drained grassland catchment typically exhibits greater “flashiness” than the arable catchment, the former having a Q10:Q90 ratio of 60% and the latter having a ratio of 24% (Mellander et al., 2015). The sharp response in discharge reflects this propensity for rapid runoff generation due to the low permeability of soils in the poorly drained grassland catchment. Thomas et al. (2017) estimated 79% of field soils in the poorly drained grassland catchment as generating overland flow, compared to 50% of the well-drained arable catchment. A further factor in the more muted melt-discharge response in the arable catchment is the antecedent SMD. Modelled SMD (Schulte et al., 2005) indicated a deficit of c. 5 mm below field capacity in the week prior to snowfall in the well-drained arable catchment, whereas the poorly drained grassland catchment exhibited a surplus of up to 5 mm – the soils were largely saturated. Hence, although runoff was generated in the well-drained arable catchment during the melt period, the available storage capacity in the soil (albeit relatively limited) encouraged some partitioning into infiltration rather than water movement exclusively over the soil surface. Lack of freezing conditions (≥1.8°C at a 10 cm depth in both catchments throughout the event) in the soil likely precludes alteration of soil structure via a freeze–thaw action, particularly considering the typically low density of Irish soils (Kiely et al., 2009). While this action is often reported in cold climates and weather events, it seems unlikely to have occurred in this instance.
Nutrient export
Both catchments exhibited high NO3-N concentrations prior to the snowfall event which were elevated above the 2010–2017 averages for the corresponding period (Figure 5).This suggests that NO3-N concentrations were already elevated due to groundwater contribution and overwinter flushing/leaching subject to time lag (McAleer et al., 2017). This reflects high rainfall during the 2017–2018 winter period (264 and 263 mm in the well- and poorly drained catchments, respectively), which marginally exceeded the 2010–2017 medians for the corresponding period. Corresponding to the peak discharge occurring on 5 March due to snowmelt, NO3-N concentrations dropped to 5.37 and 1.8 mg/L for the arable and grassland catchments, respectively, indicating dilution. For the poorly drained grassland catchment, daily NO3-N loads peaked on 5 March at 248.74 g/ha, before receding to a range of 100–200 g/ha between 6 and 16 March. The pre-snow baseline of ≤50 g/ha was not reached until 24 March. This reflects the overall increased flushing of the catchment resulting from the release of stored water as snow. In the well-drained arable catchment, daily NO3-N loads/ha exhibited a more gradual increase, from a pre-event baseline of c. 109 g to a peak of 590 g on 15 March. Return to the pre-snow baseline did not occur until 30 March. This slower response reflects the dominance of subsurface pathways on transport in this catchment. In simple terms, NO3-N concentrations or loads observed in either catchment remained relatively stable during the snowfall period itself, but the subsequent melt runoff caused both dilution of concentrations and elevated loads arriving via subsurface pathways due to groundwater flushing.

Daily concentrations (TRP, PP and NO3-N) for the poorly drained grassland and well-drained arable catchments, relative to the 2010–2017 median for the corresponding period. The dashed line indicates the environmental quality standard (0.035 mg/L) for TRP under the Water Framework Directive.
Both TRP and PP concentrations were marginally below average for that period in the days prior to snowfall and exhibited little change during the precipitation itself (Figure 5). Concentrations of PP began to climb in both catchments on 4 March. This is later than TRP concentrations which began to increase from 2 March. This discontinuity may reflect physical immobilisation of sediment particles by snow cover. The thaw phase presents as the start of the discharge “event” – distinct from the cold weather event itself, which includes the preceding snowfall period. The hourly discharge and discharge–concentration hysteresis loops are shown in Figures 6A–D. The phases of the discharge event are indicated numerically.

(A) Hourly discharge during the thaw phase (poorly drained grassland); (B) hourly discharge during the thaw phase (well-drained arable); (C) discharge/TRP concentration hysteresis loop (poorly drained grassland); (D) discharge/TRP concentration hysteresis loop (well-drained arable).
Considering the poorly drained grassland (Figure 6A and C), the discharge event can be characterised as follows. First, the discharge began to increase as the runoff of meltwater from saturated soils was initiated (phase I). Stream TRP concentrations remained similar to shallow groundwater as P sources in the soil were not mobilised, likely due to the layer of snow cover. Discharge stabilised during phase II, and TRP concentrations remained level. Still there was no mobilisation from soil surface as air temperatures remained below zero and P sources remained physically immobilised beneath the snow. During phase III, the discharge increased accompanied by a sharp increase in TRP concentrations (from 0.053 to 0.141 mg/L). Air temperatures first exceeded 0°C 10 h previous to this pulse, during which time the melt was initiated, carrying a pulse of P to the stream. A rapid increase in discharge occurred as air temperatures became sufficiently high (>2.5°C) to accelerate snowmelt (phase IV). Air temperatures climbed throughout this phase, and water temperatures exceeded 0°C for the first time. The greatest rate of P loss occurred during this phase of discharge. Finally, discharge and P export receded due to the depletion of snow cover (phase V).
The discharge behaviour of the well-drained arable catchment is shown in Figures 6B and D. Initially, the discharge marginally increased (from 532 to 611 m3/s). Total reactive phosphorus concentrations remained at the baseflow level (phase I). During phase II,a rapid increase in TRP concentration and an increase inelectrical conductivity (EC – not shown) occurred. Air temperatures during this phase peaked at 7°C causing rapid snowmelt and runoff, which transmitted a pulse of TRP to the stream. Discharge stabilised during phase III at c. 730–780 m3/s. However, TRP concentrations dropped sharply from 0.15 to 0.09 mg/L. This may be due to exhaustion of in-stream sources. A second pulse of TRP reached the river during phase IV, representing P mobilised and transported via longer and more distant flow pathways. This pulse was of lower magnitude than that observed in phase II, indicating a gradual depletion of sources. Unlike the pulse in phase II, stream concentration remained below the Environmental Quality Standard (EQS). Although air temperature increased in this phase (from 1.2 to 4.7°C), water temperature decreased by c. 1°C. Although this is a relatively small change, it corresponds to the inflow of cold meltwater to the river. Finally, the discharge generally stabilised at c. 1,700–1,800 m3/s during phase V.
Discussion
In the poorly drained grassland catchment, the anti-clockwise (distal) concentration–Q relationship indicated source limitation (Figure 6C) (Mellander et al., 2012; Sherriff et al., 2016). In other words, P was either unavailable for mobilisation or distant from the receptor. Plant-available soil P concentrations in this catchment are typically very low (average Morgan extractable P of 3.1 mg/L in fields sampled during 2017). Peak flow subsequent to rainfall events in this catchment observed over the 10-yr monitoring period typically occurred far more rapidly (within <1 d post initiation) than for the snow event (5 d post initiation). The time lag in 2018 was created by the immobilisation of water as snow, which simultaneously confined P within the soil. The effects of precipitation as snowfall on in-stream nutrient dynamics are only observed after a temperature-mediated delay in poorly drained agricultural catchments.
In the well-drained arable catchment during the 2018 storm, a clockwise (proximal) concentration–discharge relationship suggested that P sources were readily available and mobilised during the thaw event (Figure 6D). Due to freely drained soils, the well-drained arable catchment was not saturated beyond the end of the closed period; however, the areas adjacent to the stream at low elevation were unlikely to have entirely drained water stored over winter. Furthermore, these areas would have received water draining from the more elevated areas of the catchment. Limited critical source areas (Thomas et al., 2016) and longer flow paths (Mellander et al., 2015) in the catchment relative to the neighbouring grassland catchment supports the hypothesis that the early elevation of TRP in-stream likely came from sources which were near to the receptor (such as bare soil awaiting spring tillage) or potentially from re-suspension of sediment-bound P (Shore et al., 2014; Sherriff et al., 2016). This is further supported in the study by Shore et al. (2014) which characterised 44% of stream channels within the arable catchment as being “Class I” as regards sediment retention/transfer class. This indicates a low capacity to attenuate P and a high potential to accelerate PP losses derived from stream banks during storm events. In the absence of farm records, the application and timing of fertiliser application cannot be quantified; however, drier soils (greater SMD) allowed several opportunities for fertiliser application in some areas in the well-drained arable catchment in the week prior to the snow event compared to the poorly drained grassland. This may have contributed to the early spike in TP concentrations in the well-drained arable catchment, which declined after those readily available sources were depleted.
Although relatively infrequent, severe snowstorms are not unprecedented in Ireland and have implications for agricultural land management. Forecasts of heavy snowfall events should be treated in the same way as high rainfall, namely, avoidance of fertiliser application, particularly near to receptors or potential overland flow pathways. Identification of critical source areas and management based on decision-support tools would allow losses to be minimised. The relative infrequency of snowstorms may cause underestimation of their potential severity. While studies in the Irish context are not available, a survey of US residents indicated that 31–56% of respondents believed snowfall would not occur when predicted by the meteorological service. Conversely, only 4–15% of respondents indicated similar doubts regarding rainfall forecasts (Joslyn & Savelli, 2010). Perceived uncertainty regarding snow forecasts may contribute to under-preparedness, although investigation of farmers’ perspectives on weather forecasts is needed. Incorporation of snowfall into agricultural decision-support tools which are already accepted, such as SMD (Kerebel et al., 2013), could be an efficient development of existing resources. From a practical perspective, optimised land management in late winter and early spring is critical for limiting nutrient losses from storms of any type. Long-term strategies to optimise soil nutrient balances, increase vegetation cover and stabilise stream banks will therefore moderate the chemical response of streams to snow-related hydrological events.
Conclusions
Better understanding of Irish cold weather events is necessary to support the design of farm best management practices and to facilitate the effective implementation of existing structures, particularly regarding the meteorological alert system. This study presents the first high-temporal resolution record of stream nutrient dynamics in Irish agricultural catchments during an extreme cold weather event. Such baseline information can only be ascertained via long-term monitoring and should form the foundation for structured experimental research from which rigorous conclusions can be ascertained. For both the well-drained arable and poorly drained grassland catchments, the risk of nutrient loss was similar to that associated with rainfall, albeit subject to a temporal lag due to physical immobilisation of precipitation as snow. These risks were influenced by three main and interrelated factors: the antecedent soil moisture content, flow controls and land management.