
Introduction
Chronic fatigue syndrome (CFS) is characterized primarily by debilitating fatigue lasting at least 6 months and of new or definite onset and with no alternative medical explanation (1). Secondary symptoms include cognitive impairment (2,3) and symptoms consistent with autonomic nervous system (ANS) (4), immunological (5)–(7) and cardiovascular (8,9) dysfunction.
Although the aetiology of CFS has not been established, primary involvement of the central nervous system (CNS) has been suggested (10). On the basis of consistent post-mortem findings of midbrain reticular formation lesions in acute poliomyelitis, which has symptoms of severe fatigue, midbrain dysfunction has been postulated as a common mechanism for all post-viral fatigue (11,12). Another CNS mechanism proposed in CFS is dysfunction of the hypothalamo–pituitary–adrenal (HPA) axis that mediates stress response. Although results from challenge tests are mixed (13) and HPA dysfunction is probably secondary to other factors (14), it may be relevant in CFS symptom propagation.
Cerebral imaging studies comparing CFS subjects with normal controls (NC) have been inconclusive. An elevated occurrence of frontal lobe MR white matter (WM) hyperintensities has been reported in some studies (15,16) but not others (17). In studies using single photon emission computed tomography (SPECT) and positron emission tomography (PET), some groups have reported brainstem and prefrontal changes (18)–(20). A PET study comparing multiple sclerosis subjects with and without fatigue also detected differences in extended prefrontal grey (GM) and WM (21). Voxel-based image analysis of MR in CFS with statistical parametric mapping (SPM) is limited. One voxel-based morphometry (VBM) study detected decreased grey matter volume in dorsolateral prefrontal grey matter (22), but another did not (23).
The failure to detect consistent patterns of brain involvement in CFS may be due in part to the considerable variability in the symptoms and symptom severity among CFS subjects (24,25). If, in a CFS population, MR image values at a brain location vary appreciably with a clinical score, then a correlation against that score may be statistically more powerful than a CFS versus NC group comparison that would be degraded by the large variance within the CFS group. We have therefore adopted an additional approach, namely to perform voxel-based regressions of MR image values against CFS clinical scores.
In the present study, voxel-based regressions are utilized in two ways: first, regressions of the images from the CFS group against CFS scores to locate regions where MR changes correlate with increases in symptom severity or disease duration were performed. Second, so-called group versus clinical score interaction regressions, that involve both CFS and NC groups to detect locations where the regression is different in the two groups, were applied. The second approach provides a powerful method to investigate locally disrupted CNS homeostasis, such as might be expected if the global control functions of the midbrain are affected in CFS. If, in the NC group, MR values correlate locally with a clinical score, then in a collective sense, this relationship is an expression of CNS homeostasis. If interaction regressions locate voxels where regressions are significantly different for the CFS and NC groups, particularly if they have opposite slopes, this will provide strong evidence of abnormality in CFS.
In the present study, MR analysis was extended beyond VBM to also assess signal levels at the voxel level in T1- and T2-weighted spin-echo (T1w and T2w) scans. This was facilitated by a recently developed method to normalize cross-subject T1w and T2w global signal levels (26). T1 and T2 relaxation times are fundamental properties of tissue. In the brain, both T1 and T2 are prolonged in tissue-free water such as in cerebrospinal fluid (CSF) and oedema (27), but only T1 is prolonged in gliosis (28). In addition, macromolecules (in particular myelin) and membranes shorten T1 (29) and locally increased regional cerebral blood volume shortens T2 (30). T1w is inversely proportional to T1 (so T1w decreases in oedema and increases with increasing myelination), whereas T2w is directly proportional to T2 (T2w increases in oedema and with decreased local blood volume).
Scoring CFS status is contentious. In addition to fatigue duration, we recorded the self-reported Bell CFS disability scale (31), and the sum of scores of the 10 most common CFS symptoms (24,32). To investigate reports of autonomic dysfunction in CFS (33), 24-h ambulatory blood pressure monitoring and bedside haemodynamic stress tests were also performed. Twenty-four-hour haemodynamic parameters were averaged separately in asleep and awake (and seated) sub-periods, the latter avoiding contamination by the autonomic effects of variable physical activity. To our knowledge, voxel-based MR regressions against haemodynamic scores have not yet been performed in NC alone, so our analysis here is unique.
Our working hypothesis then was that quantitative techniques developed for automatic voxel-based analysis of high-resolution MR images will confirm involvement of the brain in CFS, and in particular of the midbrain, prefrontal white matter and/or supraspinal autonomic control regions which include the brainstem and hypothalamus (34,35).
Subjects
Twenty-seven CFS subjects aged between 19 to 46 years were recruited from community-based specialist and general practice. They met both the Fukuda (1) and Canadian (36) criteria for CFS. They were subjected to a routine medical history and examination by one physician (R.B.), and a biochemical and haematological analysis and a resting 12-lead electrocardiograph (ECG) were performed. All medications including ‘natural therapies’ were discontinued 2 weeks before their study week, except for paracetamol and oral contraceptives. Subjects with a history of chemical sensitivities or body mass index >30, or who were pregnant, postmenopausal, unable to undertake brain MR or cerebral SPECT scans, or unable to discontinue medication were excluded. The study period was delayed for any viral or bacterial infection until recovery.
Twenty-seven normal controls (NC), unrelated to the CFS subjects, were recruited by public advertisement, and were matched for gender, age to within 2 years and weight to within 5 kg. They were not taking any medications and had no previous serious illnesses. All participants were compensated for transport costs alone. All examinations were completed within 1 week. The study protocol was approved by the Research Ethics Committee of the Royal Adelaide Hospital and all subjects gave informed written consent.
To determine levels of depression and anxiety all subjects completed the hospital anxiety and depression scale (HADS) questionnaire (37). Two CFS subjects and their age- and sex-matched NC were removed from the analysis based on their MR scan. One male, aged 30 years, had an absent right cerebellum without cerebellar symptoms, and one female, aged 20 years, had a large frontal angiomatous tumour, again asymptomatic referable to the tumour. Thus, 25 CFS subjects and 25 NC were assessed with 6 males and 19 females in each group. Mean ages were 32 years (range 19 to 46) for CFS subjects and 32.8 years (20)–(46) for NC.
CFS scores
Fatigue duration and two questionnaires were used to score CFS status.
First, the 10-level Bell CFS disability scale (31) (Bell score), for which the subject selects the description that best fits their level of functioning.
Second, the 10 most common CFS symptoms present in more than 80% of CFS surveys were scored (24,32), namely: severity of fatigue, change in sleeping pattern, dizziness on standing, pain in muscles, stomach symptoms, overall level of function, change in concentration, change in short-term memory, headaches and experience of emotional swings.
In an interview conducted at the time of medical assessment by the same experienced clinician (R.B.) each symptom was scored on a 10-point scale for all CFS and NC subjects. A score of 10 corresponded to no symptoms, and a score of 0 extremely severe. ‘Total symptom score’ was the sum of all 10 scores.
Haemodynamic scores
Twenty-four-hour ambulatory blood pressure monitoring was performed with an ‘Oscar 2’ sphygmomanometer (SunTech Medical, Morrisville, NC, USA) which was fitted in the home and retrieved the next day after 24-h of recording. The cuff was inflated and systolic and diastolic blood pressures (BP) and heart rate were recorded every 30 min from 07.00 to 22.00 hours and hourly from 22.00 to 07.00 hours. Pulse pressure (PP = systolic – diastolic) was calculated at each time point. All parameters were averaged over actual ‘asleep’ and ‘seated’ sub-periods from the written record of activity kept by the participants.
We also monitored haemodynamic autonomic function via blood pressure and heart rate responses to the stressors of postural change, Valsalva manoeuvre and hand grip. These results will be reported elsewhere.
Correlations between clinical scores
We performed an analysis of the correlations between all pairs of CFS and hemodynamic scores in the CFS and NC groups separately. We also tested for differences between the correlations observed in the two groups using group versus covariate designs.
MR acquisition
MR images were acquired on a Philips 1.5 T Intera MR scanner (Philips, Eindhoven, the Netherlands) with a body transmit coil and birdcage receive coil. Three sequences were used: T1w spin echo (TR/TE/flip angle = 600 ms/15 ms/90º), T2w spin-echo (4000/80/90º) and 3D gradient echo (5.76/1.9/9º). T1w and T2w images were transaxial with pixel sizes 0.82 × 0.82 mm and 0.859 × 0.859 mm, respectively, and 3-mm contiguous slice thickness. The 3D gradient echo voxel size was 0.938 × 0.938 × 1.0 mm.
MR visual scoring
A blinded experienced neuroradiologist (S.C.) assessed the MR images using the scheme of Lange et al. (16) which scored five features (lateral ventricular enlargement, subcortical white matter hyperintensities, grey matter or brainstem hyperintensities, cerebral atrophy and hemispheric asymmetry).
MR preprocessing
SPM5 (http://www.fil.ion.ucl.ac.uk/spm) was used to perform all voxel-based pre-processing and statistical analysis. First, the 3D gradient echo brain images were segmented into GM, WM and CSF. Non-linear spatial normalization of the grey and white partitions was then refined using SPM5's DARTEL toolbox (38) that achieves greater accuracy than the standard SPM5 algorithm (39). An additional affine transformation of the final DARTEL GM template to the standard Montreal Neurological Institute (MNI) GM template was computed and applied to the normalized partitions for each subject. The GM and WM partitions were processed independently using VBM (40) to generate normalized images that encode regional volume changes relative to the template.
The T1w and T2w images of each subject were co-registered to the raw 3D gradient echo scan, and the deformations computed above applied to render them in SPM's standard anatomical space (MNI space). Finally, the GM, WM, T1w and T2w images were smoothed using an 8-mm full width at half maximum (FWHM) Gaussian kernel.
Voxel-based statistical analysis
The volume-encoded GM and WM partitions were subjected to voxel-based statistical analysis using SPM5. This was the final step of VBM. All analyses were adjusted for age and (grey or white) partition volume. The latter effectively scales the local volumes for each subject so that their total is the same as that of the template.
Voxel-based statistical analyses of T1w and T2w signals in the CFS and NC groups were also performed, with adjustment for age and global signal level. The global signal levels were computed for each subject as the mean voxel value in a mask (brain volume) generated using the voxel-based iterative sensitivity (VBIS) technique (26). To reduce edge effects, the threshold for masking was set to 0.1 for the VBM analyses and half the mean voxel value for the T1w and T2w analyses.
In addition to group comparisons, SPM regressions were performed against the CFS clinical scores listed in Table 1 for the GM volume, WM volume, T1w and T2w images. We utilized two statistical designs:
Simple (one sample) regressions for the CFS group alone that tested at each voxel for a linear relationship between the image values and a CFS score.
Two sample designs that tested for interactions between group and haemodynamic score. At each voxel, these designs perform independent regressions for the CFS and NC groups against the clinical measure. Contrasts of [−1 +1] and [+1 –1] tested for different linear responses in the two groups. Two sample designs were also applied for total symptom score (SS).
The mean value ± SD for the clinical variables recorded here for the chronic fatigue syndrome (CFS) and normal control (NC) groups and the p-value for a null difference between them
| Clinical score | CFS | NC | p | Clinical score | CFS | NC | p | ||
|---|---|---|---|---|---|---|---|---|---|
| Age | 31.7 ± 8.8 | 33.7 ± 10.3 | NS | 2 | HR (seated) | 76.6 ± 7.1 | 71.2 ± 10.2 | 0.037 | |
| Weight, kg | 67.6 ± 10.9 | 68.9 ± 14.0 | NS | 2 | HR (asleep) | 67.0 ± 9.2 | 61.5 ± 9.5 | 0.046 | |
| 2 | PP (seated) | 46.9 ± 6.8 | 51.2 ± 7.2 | 0.040 | |||||
| 1 | Fatigue duration | 7.4 ± 3.5 | 2 | PP (asleep) | 47.5 ± 7.3 | 49.0 ± 7.9 | NS | ||
| 1 | Bell score | 41.6 ± 11.4 | 99.6 ± 2.1 | < 0.0001 | 2 | Systolic BP (seated) | 120.4 ± 8.9 | 123.9 ± 9.7 | NS |
| 1,2 | Total SS | 45.9 ± 11.6 | 93.6 ± 5.6 | < 0.0001 | 2 | Systolic BP (asleep) | 105.3 ± 12.3 | 108.5 ± 11.4 | NS |
| HADS depression | 8.4 ± 4.7 | 4.0 ± 3.3 | < 0.0002 | 2 | Diastolic BP (seated) | 73.5 ± 6.6 | 72.7 ± 7.9 | NS | |
| HADS anxiety | 6.6 ± 3.0 | 1.7 ± 2.3 | < 0.0001 | 2 | Diastolic BP (asleep) | 57.8 ± 7.9 | 59.5 ± 7.8 | NS |
NS is p > 0.05. SS, symptom score; HR, heart rate; PP, pulse pressure; BP, blood pressure in mm Hg; HADS, hospital anxiety and depression scale. The leading number for each item indicates it was used in one-sample regressions (1), two-sample regressions (2) or both (1,2) with MR images.
Two NC subjects did not have blood pressure data and were omitted from the heart rate (HR), PP and BP regression analyses. A third NC subject did not record any seated period and was excluded from the seated regressions.
SPM generates statistics both for single voxels and clusters of voxels with uncorrected voxel p (uvP) below a threshold. The SPM maps here were generated using an uvP threshold of 0.001 to seek individual voxels or clusters of voxels with p < 0.05 after correction for multiple voxel or multiple cluster comparisons, respectively. For all four image types (T1w, T2w, grey and white volume), all corrections of cluster statistics for multiple cluster comparisons were performed using a non-stationary permutation method (41) that caters for variable image smoothness.
Adjustment for multiple regressions
Because of the large number of regressions performed, we applied a further correction for multiple comparisons. For each image type, in addition to the group versus group analysis, one-sample regressions were performed against the three CFS scores listed in Table 1 (for NC, fatigue duration was not applicable and the Bell score showed negligible variation). Two-sample regressions were performed for total SS and for the eight hemodynamic scores. The total number of statistical designs was therefore 1 + 3 + 1 + 8 = 13 and the total number of statistical tests performed was

The factor of four accounts for the four MR image types (GM volume, WM volume, T1w and T2w) and the factor of two accounts for both positive and negative regressions. Bonferroni's corrected p-values were obtained by multiplying the corrected cluster p-values (ccP) by N. Because not all clinical measures are independent, Bonferroni's correction is overly conservative. Therefore, we also used the false discovery rate (FDR), the expected proportion of false positives among all N regressions (42). An upper bound q = 0.05 was chosen for the expected FDR. The k strongest results with p-values, p1,…,pk that satisfied p1,…,pk < q(k/N) were then deemed significant.
Regressions that survived the FDR threshold were repeated with adjustment for the HADS depression and anxiety scores.
Region of interest volume analysis
For each subject, the unsmoothed volume-encoded voxels in the GM and WM partitions were summed for the whole brain and major brain regions of interest (ROIs) (brainstem, cerebellum, frontal, temporal, parietal and occipital lobes) to yield their grey and white matter volumes and regressed against the haemodynamic parameters in Table 1, with adjustment for age, HADS depression and anxiety scores. This was motivated by significant results for the voxel-based VBM regressions against haemodynamic scores described above. While the VBM regressions considered relative volumes, this ROI analysis considered absolute volumes. We used the regions from the Taillarach Daemon (TD) database incorporated in the SPM5 toolbox ‘WFU PickAtlas’ v2.4 (http://www.ansir.wfubmc.edu) (41). The brainstem region incorporated the midbrain. To reduce edge effects, the VBM threshold for inclusion of a voxel was set to 0.1.
Identification of cluster locations
Cluster locations were refined using the TD and aal databases incorporated in the WFU PickAtlas toolbox of SPM5, and hardcopy atlases of the brainstem (43) and whole brain (44). All images are displayed using the ‘neurological’ convention (the subject's left is left on the image). To better visualize the clusters, a threshold of uvP = 0.005 was used.
Results
Clinical
The mean fatigue duration was 7.4 years (range 2–15). There were no abnormal biochemical results in the tests performed and no abnormalities in the resting 12-lead ECG in either CFS or NC subjects.
Table 1 shows significant differences between the CFS and NC means for all three self-reported CFS scores (left side of the table). The HADS scores for CFS fall in the range for mild depression and anxiety. For the hemodynamic parameters on the right-hand side of the table, seated and asleep heart rate were significantly higher for CFS, whereas seated pulse pressure was significantly lower. The mean number of readings while seated was 14 (CFS) and 12 (NC), and while asleep 8 (CFS) and 11 (NC).
Visual MR scoring
Two CFS and three NC subjects were given non-zero scores (0 is normal and 3 is most severe). Both CFS subjects and one NC subject had level 1 subcortical WM hyperintensities. The other two NC subjects had a level 1 lateral ventricular enlargement and a level 1 cerebral atrophy.
Global MR volume changes
The total GM, WM and CSF volumes from VBM analysis showed no significant difference between the CFS and NC subjects. Volumes were: for grey matter 0.670 ± 0.017 L for CFS and 0.674 ± 0.016 L for NC, for white matter 0.517 ± 0.067 L and 0.519 ± 0.062 L and for CSF 0.263 ± 0.009 L and 0.262 ± 0.012 L, respectively. Within the CFS subjects neither GM nor WM global volumes correlated with fatigue duration. In CFS and NC subjects, GM and WM volumes and their sum all decreased with age, but only the GM volume decrease in CFS was significant (p = 0.01) at a rate of 4.3 mL per year. This is in line with previous reports for GM decline of 2.2 mL/year (CFS and NC females) (23) and 3.9 mL/year (NC males) and 2.6 mL/year (NC females) (40). For CFS subjects, GM and WM and combined global volumes correlated with seated PP (p < 0.01) (Table 2).
For chronic fatigue syndrome (CFS) subjects, r- and p-values for regressions (all positive) of seated pulse pressure (PP) against absolute volumes of grey matter (GMV), white matter (WMV) and GMV + WMV for regions of interest (ROIs) of the whole brain and major divisions
| GMV | WMV | GMV + WMV | ||||
|---|---|---|---|---|---|---|
| r | p | r | p | r | p | |
| Whole brain | 0.44 | 0.04 | 0.49 | 0.02 | 0.49 | 0.02 |
| Brainstem | 0.64 | 0.001 | 0.39 | NS | 0.53 | 0.01 |
| Cerebellum | 0.33 | NS | 0.49 | 0.02 | 0.41 | NS |
| Frontal lobe | 0.37 | NS | 0.44 | 0.04 | 0.43 | 0.05 |
| Temporal lobe | 0.40 | NS | 0.42 | NS | 0.43 | 0.05 |
| Parietal lobe | 0.52 | 0.01 | 0.58 | 0.005 | 0.57 | 0.006 |
| Occipital lobe | 0.54 | 0.01 | 0.52 | 0.01 | 0.54 | 0.009 |
All regressions were adjusted for age and hospital anxiety and depression scale (HADS) anxiety and depression. There were no significant regressions for normal controls (NC). Only the brainstem GMV regression was significantly different in CFS and NC.
NS, not significant.
ROI MR volume regressions
Table 2 lists for the CFS subjects the r- and p-values for regressions of seated PP against absolute GM and WM volumes in seven ROIs. All were adjusted for age and HADS anxiety and depression. Significant correlations were detected across most of the brain, but most strongly in the brainstem GM (see Fig. 1) with r = 0.64, p = 0.001. There were no such correlations in NC. Only the seated PP versus brainstem GM volume regression was shown to differ significantly (p = 0.02) between the two groups. Of the other haemodynamic parameters in Table 1, only seated systolic BP showed significant adjusted correlations with absolute volumes in CFS, and then only versus total brainstem volume (p = 0.03) and versus cerebellum WM volume (p = 0.02).

Correlations between clinical scores
Only three correlations between pairs of CFS and/or hemodynamic scores were found to differ in the CFS and NC groups. They were seated HR versus asleep HR, seated HR versus age and seated PP versus HADS anxiety. Full details are tabulated in the Supplementary Material.
Voxel-based MR comparison of CFS and NC
No inter-group comparisons detected significant regional differences with the voxel threshold set at uvP < 0.001.
Voxel-based MR regressions
A total of 104 linear regressions were performed. Seven significant clusters were detected with FDR controlled at 0.05, and are listed in Table 3, together with their locations and design details. Items 4, 6 and 7 were no longer significant after adjustment for HADS anxiety and depression scores. Items 1 to 3 survived Bonferroni's correction for 104 regressions (ccP < 4.8e-4). Item 2 consisted of two separate bilaterally symmetrical clusters. Although item 8 was only significant before correction for multiple comparisons, it was included because there was an a priori hypothesis for that location (hypothalamus).
Eight significant clusters found in four statistical parametric mapping (SPM) regressions against clinical scores for the four MR image types, GM volume, WM volume, T1w and T2w
| Item | MR | Clinical score | Design | Figure | Cluster | Location | Peak x,y,z | ||
|---|---|---|---|---|---|---|---|---|---|
| image | Voxels | ccP1 | ccP2 | (mm) | |||||
| 1 | T1w | seated PP | -2 s | 3 | 2939 | 4.7e-6 | 2.5e-6 | brainstem, cerebellum | 12, -28, -22 |
| 2 | rWMv | asleep HR (2) | -2 s | 5A | 3215 | 8.0e-6 | 5.7e-6 | *L & R deep prefrontal WM | ±21, 4, 39 |
| 3 | rWMv | fatigue duration | -1 s | 2a | 2228 | 2.9e-5 | 6.1e-5 | *midbrain | -12, -16, -18 |
| 4 | T2w | fatigue duration | -1 s | 133 | *0.0027 | 0.015 | R anterior middle frontal gyrus | 36, 60, 2 | |
| 5 | rWMv | seated diastolic BP | +2 s | 5B | 975 | 0.0028 | 0.0016 | R caudal basal pons | 8, -25, -44 |
| 6 | T2w | fatigue duration | -1 s | 356 | †0.0032 | 0.031 | R middle temporal | 52, -6, -16 | |
| 7 | rWMv | asleep HR | +2 s | 5A | 702 | †0.0066 | 0.011 | cerebellar vermis WM | 0, -51, -23 |
| 8 | rWMv | asleep HR | +2 s | 5A | 97 | ‡0.014 | ‡0.017 | hypothalamus | -5, -4, -12 |
ccP1 is adjusted for age and global value. ccP2 is also adjusted for hospital anxiety and depression scale (HADS) anxiety and depression. Clusters are ordered by ascending ccP1. Under ‘design’, 1 s indicates a one sample (CFS group versus CFS score) and 2 s a group (both CFS and NC) × haemodynamic score interaction design with the sign of the regression tested in the CFS group. Clusters of items 1 to 3 remained significant after Bonferroni's correction for multiple regressions. Clusters of items 1 to 7 were significant with false discovery rate (FDR) controlled at 0.05, although after adjustment for HADS anxiety and depression, items 4, 6 and 7 lost significance. Voxel volumes were 4.87 mm3 for grey and white, and 8 mm3 for T1w and T2w.
Not FDR significant after adjustment for HADS anxiety and depression.
Cluster p not corrected for multiple comparisons (an a priori hypothesis existed for the hypothalamus).
peak voxel has corrected voxel p < 0.05 (see Results).
L, left; R, right; rWMv, relative white matter volume, WM, white matter; HR, heart rate; PP, pulse pressure; BP, blood pressure.
Figures 2 to 5 show the results of the voxel-based MR image regressions. In each legend, significant locations are cross-referenced to Table 3 to inform, via the ‘design’ column, whether the regression involved only the CFS subjects (1 s) or involved a group (CFS and NC) × haemodynamic score interaction (2 s). In the text below, square brackets hold the Figure number from the reference brainstem atlas (43) used for localization.

Voxel-based morphometry (VBM) white matter (WM) volume versus fatigue duration (Table 3, item 3). The cluster was formed with uncorrected voxel p < 0.005. Sections are through the three peak voxels with corrected voxel p < 0.05 and are located in the corticospinal tract (left column), red nucleus/hypothalamus periventricular area (centre) and medial geniculate body (right). Magnified inserts improve localization of the peaks via a voxel threshold of uvP < 0.00001 and, for anatomic guidance, include edges from an atlas of the substantia nigra (blue) and red nucleus (green). The plot shows relative WM volume versus fatigue duration at the peak voxel and indicates shrinkage of 1% per year. The background image is the mean WM image from the present study.

T1w results from a group × seated pulse pressure (PP) interaction (Table 3, item 1) involving the midbrain and hindbrain, shown on the mean gradient echo sections from the present study. The cluster was formed with a threshold of uvP = 0.005. Magnified inserts with a more stringent threshold (uvP < 0.0001) locate the peak significance to the midbrain reticular substance and periaqueductal grey matter.
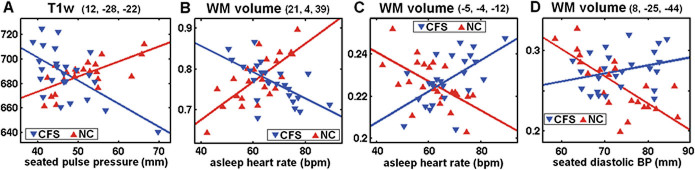
Plots, for group × haemodynamic score interactions, of values for each chronic fatigue syndrome (CFS) and normal control (NC) subject at the most significant voxel in the four clusters described in Table 3, items 1, 2, 8, 5. Individual MR values have been adjusted for age and global value. The lines are the general linear model fits. The mean MR values in the CFS and NC groups are not significantly different. The voxels were located: (A) in the low midbrain reticular substance (Fig. 3); (B) in prefrontal white matter (WM) (Fig. 5A); (C) in the hypothalamus (Fig. 5A); and (D) in the caudal basal pons (Fig. 5A). Although only one of these individual voxel interactions (B) was significant after correction for multiple comparisons, all four interactions extended across clusters that were significant.

White matter (WM) volume interaction results for (A). Group × asleep heart rate (Table 3, items 2, 7, 8 and Fig. 4B,C), and (B). Group × seated diastolic blood pressure (BP) (Table 3, item 5) interaction regressions. In (A) significant clusters formed with a uvP = 0.005 threshold were observed bilaterally in deep prefrontal WM and in the cerebellar vermis and hypothalamus. In (B) a significant cluster formed with a uvP = 0.005 threshold is seen in the caudal basal pons. The two colour bars distinguish between different polarity interactions (e.g. Fig. 4B, C). Thus, in (A) red–yellow–white indicates where as asleep heart rate (HR) increases, WM volume decreases in chronic fatigue syndrome (CFS) but increases in normal controls (NC), whereas blue–green–red indicates the reverse. Magnified inserts locate the clusters in the hypothalamus (A) and pons (B) with a more stringent threshold of p = 0.0005. The background image is the mean white matter image from the present study.
Voxel-based MR regressions against CFS scores
Figure 2 shows midbrain locations where WM volume decreased in the CFS subjects with increasing fatigue duration (Table 3 item 3). The three columns show sections through the three peaks in this cluster that were significant at the voxel level after FWE correction for multiple comparisons.
The atlas indicates they are centred: left column (p = 0.01 at −12, –16, –18) in the corticospinal tract [2.18]; centre column (p = 0.04 at 3, –18, –4) near the red nucleus and periventricular hypothalamus [2.21, 2.22]; and right column (p = 0.04 at 13, –27, –9) near the medial geniculate body [2.20]. The plot shows relative volume versus fatigue duration at the peak voxel in the corticospinal tract and indicates a volume loss of 1% per year.
Voxel-based MR group × haemodynamic score regressions
Figure 3 shows locations of significant T1w group × seated PP interactions in the most significant cluster (Table 3, item 1) detected in the present study. It is centred on the tegmental brainstem and extends into the cerebellum and the posterior internal capsule. In CFS, T1w decreases as PP increases. The inserts highlight focally increased significance in the midbrain periaqueductal GM and reticular formation [2.18, 2.19]. Figure 4(A) plots the T1w signal values for both groups at the peak voxel.
Figure 4 illustrates four individual voxel results from three different group × haemodynamic score interactions. Their distinctive crossed regression appearance demonstrates abnormal relationships in the CFS group. The group means are not significantly different.
Figure 5 shows WM volume group × asleep heart rate (A) and group × seated diastolic BP (B) interactions. Significant voxel clusters were detected (A) bilaterally in deep prefrontal WM and in the cerebellar vermis and hypothalamus (Table 3 items 2, 7, 8), and (B) in the caudal basal pons (Table 3 item 5) [2.13]. In (A) the different colour schemes for the two clusters indicate reverse interactions, that is, the CFS regression slopes in the two clusters had opposite signs and similarly, but reversed, for the NC as seen in Fig. 4(B, C). The same applies in (B). Three peaks in the pair of prefrontal WM clusters in Fig. 4(A) were significant at the voxel level after FWE correction for multiple comparisons. All were on the right-hand side. Corrected voxel p = 0.007 at (21,4,39); p = 0.02 at (25,8,27) and p = 0.03 at (23, 38, 0).
Discussion
Using advanced volumetric and novel T1w and T2w signal level quantitative techniques to analyse brain MR, we have performed a cross-sectional case-controlled study in patients with well-defined CFS compared with healthy controls.
Three statistical designs were applied in voxel-based analysis of the four types of MR image (GM volume, WM volume, T1w and T2w). They were:
The conventional (categorical) comparison between the CFS and NC groups. No significant differences between groups were detected.
Regressions in the CFS group against CFS scores. This analysis demonstrated an association between MR signal and CFS score in a brain structure and thereby identified involvement of that structure in CFS. A highly significant cluster was observed in the midbrain (Fig. 2 and Table 3 item 3) where WM volume decreased with increasing CFS fatigue duration.
Regressions in both the CFS and NC groups against haemodynamic scores. Group versus haemodynamic score interaction analysis here identified brain locations where the regressions were opposite in the two groups, that is, where the relationship in the CFS group was abnormal. At a collective level such locations exhibit altered homeostasis in CFS (relative to NC). Strong group × haemodynamic score interactions were detected in the brainstem for both T1w versus seated PP (Fig. 3 and Table 3 item 1) and WM volume versus seated diastolic BP (Fig. 5B and Table 3 item 5), and in prefrontal WM, the cerebellar vermis and the hypothalamus for WM volume versus asleep HR (Fig. 5A and Table 3 items 2, 7, 8). The existence of strong group × hemodynamic score interactions (Fig. 4), in spite of the wide variation in fatigue duration (2–15 years) in the CFS group, suggests that these abnormal relationships are stable and therefore commence soon after fatigue onset.
Regressions of the absolute volumes of GM and WM in major lobe ROIs were also performed against haemodynamic scores. Widespread associations with seated pulse pressure were found in CFS (Table 2) but not NC. The strongest was in brainstem GM (Fig. 1) and this was found to be significantly different to the corresponding regression in NC.
These findings therefore support our original hypothesis of involvement of the midbrain, prefrontal WM and/or supraspinal autonomic control regions in CFS, and indicate that CFS is associated with biological changes affecting fundamental and evolutionarily primitive structures of the CNS.
Clinical observations of haemodynamic scores
We detected a significant increase in seated and asleep heart rate and a significant decrease in seated PP in our CFS group relative to the NC group (Table 1), but no other 24-h hemodynamic differences. Three previous 24-h ambulatory BP monitoring studies in CFS have reported conflicting findings (8,45,46), and our results are concordant with several. No previous study has documented a reduction in awake PP in CFS, and in our study seated PP correlates with disease severity as expressed by the Bell score (see Supplementary Material).
However, it is unclear whether hemodynamic changes in CFS are a result of CFS-specific autonomic dysfunction, CFS-specific blood volume reduction, or non-specific physical inactivity and consequent haemodynamic deconditioning (9).
Recently, a previously documented increase in day-time HR on continuous ECG monitoring has been confirmed to persist during sleep and to be correlated with CFS severity (47). Reduced HR variability during sleep was interpreted as indicating that a sympathovagal imbalance from sympathetic overactivity and/or parasympathetic underactivity occurs in CFS. This may also explain the elevation in sleep HR detected in the present study.
Voxel-based MR regressions against CFS scores
The highly significant reduction in midbrain WM volume with increasing fatigue duration, in a collective sense, is consistent with midbrain volume loss occurring at a rate of 1% per year (Fig. 2). While we cannot exclude that this is a result of the physical and mental inactivity associated with CFS, the absence of any voxel-based volume correlation with CFS severity as measured by either the Bell score or total symptom score in the midbrain argues against this.
White matter comprises vascular, interstitial fluid, glial and neuronal compartments. Because neither T1w nor T2w signals regressed with fatigue duration, neither myelin reduction (T1w) nor vascular or interstitial volume reductions (T2w) are likely to account for the observed variation in midbrain WM volume. Shrinkage and/or loss of glial cells are therefore likely to account for the WM volume reduction here.
In addition to being a conduit for all spino/cerebello–thalamic/cortical WM tracts, the midbrain contains components of the reticular activation system, the periaquaductal GM, and monoaminergic and cholinergic neurotransmitter centres (35,43). Thus brainstem GM dysfunction can have far reaching consequences for cortical activity and function.
Voxel-based MR × haemodynamic score interactions
Brainstem and midbrain reticular formation
The T1w group × seated PP interaction yielded the most significant cluster observed here (Figs 4A and Table 3 item 1). Peak significance occurred in the midbrain reticular activation system which mediates excitation of the cerebral cortex via the thalamus and responds via positive feedback to signals returned from the cerebral cortex (34), thereby maintaining or enhancing the level of excitation of the cerebral cortex. Overlap of 2 of our 3 statistically strongest results in the midbrain supports involvement here as having a primary role in CFS pathogenesis. The brainstem reticular formation is also a node through which communication between central and peripheral autonomic neurons is relayed (34). Its dysfunction therefore may cause the abnormal relationships observed here between MR levels in the central autonomic network and peripheral haemodynamic measures, that appear to be a ‘resetting’ of the ANS in CFS.
Interpretation of brainstem interactions
For the T1w and absolute GM volume associations with seated PP in the brainstem we propose a mechanism involving cerebrovascular autoregulation (CA), which normally controls CNS capillary hydrostatic pressure to prevent PP affecting intravascular and extracellular volumes. CNS tissue volumes should therefore not regress with PP and our NC ROI volume regressions concur with this. However, impaired CA would result in a positive correlation between PP and tissue volumes, as seen in our CFS regressions (Table 2).
CA principally occurs at the level of the arteriole and is both centrally and locally mediated, the latter currently regarded as a myogenic reflex (48). The blood–brain barrier (BBB), which comprises the combined vascular beds of arterioles, capillaries and venules, is impermeable to fluid and larger molecules, although preliminary evidence exists for relative leakiness of the BBB in arterioles (49). Perivascular astrocytes are known to control the integrity of the BBB, but also to participate in at least centre-mediated autoregulation (48). The origins of the centre-mediated component include the neurotransmitter releasing neurons of the Raphe nucleus (serotonin) and locus coeruleus (noradrenaline) in the brainstem (50) that project to the cortex.
Therefore for intact CA, periarteriolar-free fluid could vary negatively, and T1w signal positively, with PP; whereas brainstem CA impaired by astrocyte dysfunction could result in an opposite relationship, consistent with our T1w group × seated PP findings.
The anatomical proximity of the midbrain GM regions to the cluster of apparent midbrain WM shrinkage suggests that astrocyte dysfunction may be associated with both the WM shrinkage and the CA inferred here in the CFS brainstem. Similarly, brainstem and/or widespread astrocytic dysfunction could explain our brain-wide seated PP versus ROI volume correlations (Table 2).
We suggest that concomitant T2w changes are not detectable as any changes caused by subtle perivascular-free fluid variations could be cancelled by opposing T2w changes from co-varying arteriolar and capillary intravascular volumes.
WM volume group × asleep heart rate interactions
The relative volumes in an extended region of bilateral prefrontal WM regressed strongly with asleep HR, negatively in CFS subjects and positively in NC (Table 3 item 2, Figs 4B and 5A). Of the supraspinal centres thought to contribute to the control of the ANS (51), these prefrontal WM regions connect with at least the anterior cingulate, dorsolateral and orbitofrontal cortices. There is growing evidence of asymmetry in sympathetic (in the right hemisphere) and parasympathetic (in the left hemisphere) control in the forebrain (51) that may be associated with the asymmetry observed here (the three most significant peaks were all on the right). Given the recognized association between asleep HR and ANS dysfunction in CFS (47), the opposite asleep HR versus WM volume relationship in prominent prefrontal WM volumes appears to be a structural correlate of an altered ANS in CFS. A 1-sample regression in the NC alone also yielded a significant cluster in the same location (ccP = 7.3e-5).
WM volume group × asleep HR interactions were also detected in the hypothalamus and the cerebellar vermis, although oppositely directed to those found in the prefrontal WM (Table 3 and Fig. 4C and 5A). The hypothalamus acts as the central node for all CNS structures involved in autonomic control and communicates with peripheral autonomic neurons via the brainstem reticular formation (34) and, both modulates (through the HPA axis) (34), and is affected by (52) the immune system. The cerebellum and hypothalamus have been shown to be part of a network in humans controlling cardiovagal tone (53) and the fastigial nucleus in the vermis is activated during blood pressure challenges (54). As with the midbrain WM volume correlation with fatigue duration, glia are most likely to be the affected WM compartment.
WM volume group × seated diastolic BP interaction
An isolated group interaction regression between WM volume and seated diastolic BP in the caudal right basal pons was also detected (Table 3, Figs 4D and 5B). This region contains the corticospinal tract and pontine nuclei, which relay descending input from motor, premotor and association cortices of the forebrain to the intermediate and lateral cerebellum and is adjacent to autonomic centres in the rostral medulla (43). Glial cell volume changes presumably also account for this finding, which appears to reflect an independent local homeostatic change.
Pulse pressure and pulsatile motion artefacts
Pulsatile motion in the brain will be strongly influenced by pulse pressure. Could this lead to artefacts that contribute to the PP associations observed here? Pulsatile motion artefacts appear as ‘ghosting’, i.e. repeated superimposition of partial copies of the pulsatile structure, in the phase encoding direction, here the X or lateral-medial direction. In our T1w and T2w images ghosting was strongest lateral to: the basilar artery (anterior to the pons), the circle of Willis above it and the third ventricle.
Different heart rates and morphologies will affect the spacing and amplitude of these artefacts. Across a population this introduces a nuisance variance that will degrade the sensitivity for detection of true MR regressions in the affected regions. It is not clear, however, how such artefacts could have contributed to the MR-PP associations reported here. Factors that argue against this are: they were located outside of the regions where artefacts were observed; significant MR regressions were detected against seated PP but not asleep PP; and there was little difference in PP between the CFS and NC groups (different for seated PP only: NC > CFS, p = 0.04). Acquisition with non-sequential phase encoding will reduce these artefacts (55).
Image processing advances
Our results were strengthened via refinement of the SPM spatial normalization process with DARTEL (38) (an SPM5 toolbox). Correction of the SPM cluster significance for multiple comparisons using an algorithm that accounts for variable smoothness in the images (41) refined the cluster statistics.
Midbrain involvement: a unifying observation?
If the midbrain volume reduction observed here in CFS is interpreted as evidence of midbrain dysfunction, then because of the midbrain's pivotal role in multi-system feedback control (34), this could provide an explanation for many of the symptoms of CFS. This could also explain our observations of altered homeostasis in the hypothalamus, brainstem and cerebellar vermis, which are all elements of the central autonomic network. Future work is needed to confirm these findings and to investigate whether the midbrain volume reduction derives from a single insult at onset or reflects ongoing disease there.
In conclusion, we have observed MR changes in CFS consistent with accelerated volume loss in the midbrain and disrupted homeostasis in the brainstem, cerebellum, prefrontal WM and hypothalamus. In addition, we found indirect evidence for impaired regulation of the cerebral microvasculature. We suggest that at least some of these changes could be a result of astrocyte dysfunction. Our neuroimaging findings support refinement of our original hypothesis to state: CFS involves an insult to the midbrain, which suppresses levels of motor and cognitive activity, and affects multiple regulatory feedback loops to disrupt local CNS homeostasis in parts of the central autonomic network and elsewhere. The suppressed cerebral activity could contribute to the chronic fatigue and impaired cognitive function that characterize the syndrome.