25
views
0
recommends
+1 Recommend
0 collections
    0
    shares
      • Record: found
      • Abstract: found
      • Article: found
      Is Open Access

      Three-dimensional dominant frequency mapping using autoregressive spectral analysis of atrial electrograms of patients in persistent atrial fibrillation

      research-article

      Read this article at

      Bookmark
          There is no author summary for this article yet. Authors can add summaries to their articles on ScienceOpen to make them more accessible to a non-specialist audience.

          Abstract

          Background

          Areas with high frequency activity within the atrium are thought to be ‘drivers’ of the rhythm in patients with atrial fibrillation (AF) and ablation of these areas seems to be an effective therapy in eliminating DF gradient and restoring sinus rhythm. Clinical groups have applied the traditional FFT-based approach to generate the three-dimensional dominant frequency (3D DF) maps during electrophysiology (EP) procedures but literature is restricted on using alternative spectral estimation techniques that can have a better frequency resolution that FFT-based spectral estimation.

          Methods

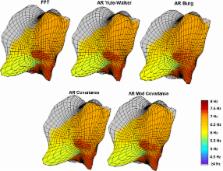
          Autoregressive (AR) model-based spectral estimation techniques, with emphasis on selection of appropriate sampling rate and AR model order, were implemented to generate high-density 3D DF maps of atrial electrograms (AEGs) in persistent atrial fibrillation (persAF). For each patient, 2048 simultaneous AEGs were recorded for 20.478 s-long segments in the left atrium (LA) and exported for analysis, together with their anatomical locations. After the DFs were identified using AR-based spectral estimation, they were colour coded to produce sequential 3D DF maps. These maps were systematically compared with maps found using the Fourier-based approach.

          Results

          3D DF maps can be obtained using AR-based spectral estimation after AEGs downsampling (DS) and the resulting maps are very similar to those obtained using FFT-based spectral estimation (mean 90.23 %). There were no significant differences between AR techniques (p = 0.62). The processing time for AR-based approach was considerably shorter (from 5.44 to 5.05 s) when lower sampling frequencies and model order values were used. Higher levels of DS presented higher rates of DF agreement (sampling frequency of 37.5 Hz).

          Conclusion

          We have demonstrated the feasibility of using AR spectral estimation methods for producing 3D DF maps and characterised their differences to the maps produced using the FFT technique, offering an alternative approach for 3D DF computation in human persAF studies.

          Related collections

          Most cited references22

          • Record: found
          • Abstract: not found
          • Article: not found

          Spectrum analysis—A modern perspective

            Bookmark
            • Record: found
            • Abstract: found
            • Article: not found

            Spatiotemporal periodicity during atrial fibrillation in the isolated sheep heart.

            The activation patterns that underlie the irregular electrical activity during atrial fibrillation (AF) have traditionally been described as disorganized or random. Recent studies, based predominantly on statistical methods, have provided evidence that AF is spatially organized. The objective of this study was to demonstrate the presence of spatial and temporal periodicity during AF. We used a combination of high-resolution video imaging, ECG recordings, and spectral analysis to identify sequential wave fronts with temporal periodicity and similar spatial patterns of propagation during 20 episodes of AF in 6 Langendorff-perfused sheep hearts. Spectral analysis of AF demonstrated multiple narrow-band peaks with a single dominant peak in all cases (mean, 9.4+/-2.6 Hz; cycle length, 112+/-26 ms). Evidence of spatiotemporal periodicity was found in 12 of 20 optical recordings of the right atrium (RA) and in all (n=19) recordings of the left atrium (LA). The cycle length of spatiotemporal periodic waves correlated with the dominant frequency of their respective optical pseudo-ECGs (LA: R2=0.99, slope=0.94 [95% CI, 0.88 to 0.99]; RA: R2=0.97, slope=0.92 [95% CI, 0.80 to 1.03]). The dominant frequency of the LA pseudo-ECG alone correlated with the global bipolar atrial EG (R2=0.76, slope=0.75 [95% CI, 0.52 to 0.99]). In specific examples, sources of periodic activity were seen as rotors in the epicardial sheet or as periodic breakthroughs that most likely represented transmural pectinate muscle reentry. However, in the majority of cases, periodic waves were seen to enter the mapping area from the edge of the field of view. Reentry in anatomically or functionally determined circuits forms the basis of spatiotemporal periodic activity during AF. The cycle length of sources in the LA determines the dominant peak in the frequency spectra in this experimental model of AF.
              Bookmark
              • Record: found
              • Abstract: found
              • Article: not found

              Quantitative assessment of the spatial organization of atrial fibrillation in the intact human heart.

              Atrial activation during atrial fibrillation (AF) is frequently described as random or chaotic. We propose that activation during AF is constrained by the principles of reentrant excitation; that these constraints impart a measurable spatial organization to activation during AF; and that the distance over which activation sequences remain well correlated can be readily measured and related both to the propensity of AF to sustain itself as well as to atrial tissue wavelength. We describe a novel signal-processing technique that quantifies the correlation in activation sequences recorded from five equally spaced sites in the right atrium in patients undergoing electrophysiology studies. In 20 patients in AF (12 with paroxysmal AF, 5 with chronic AF, and 3 with no clinical history of AF), the average correlation was 0.54 +/- 0.12 at 11 mm and 0.32 +/- 0.11 at 44 mm, compared with 0.95 +/- .023 and 0.91 +/- .023 in sinus rhythm. In AF, the correlation versus distance relation was monotonically decreasing, well fit by a decaying exponential function. The space constant of this exponential function, termed the activation space constant, provides a single objective metric of the spatial organization of activation during AF. The mean activation space constant for the group was 2.6 +/- 1.15 cm. Chronic AF had the lowest mean activation space constant (1.84 +/- 0.36 cm) and AF in patients with no prior history of AF had the highest (3.06 +/- 0.40 cm) (P < .05), with paroxysmal AF characterized by intermediate values (2.80 +/- 1.4 cm). Using a novel method to measure the spatial organization of atrial activation during AF, we have demonstrated that AF in the intact human heart is organized over a length scale consistent with reentrant excitation. Preliminary results suggest a relationship between measured spatial organization and the clinical course of the arrhythmia. Further work is needed to determine whether measurement of spatial organization may be useful in prospective patient-specific selection of therapeutic options.
                Bookmark

                Author and article information

                Contributors
                +55 (11) 2320-6342 , joao.salinet@ufabc.edu.br
                nm180@le.ac.uk
                peter.stafford@uhl-tr.nhs.uk
                gan1@le.ac.uk
                fss1@le.ac.uk
                Journal
                Biomed Eng Online
                Biomed Eng Online
                BioMedical Engineering OnLine
                BioMed Central (London )
                1475-925X
                8 March 2016
                8 March 2016
                2016
                : 15
                : 28
                Affiliations
                [ ]Biomedical Engineering, Modelling and Applied Social Sciences Centre, Federal ABC University, Bloco Delta, Sala 335 - Rua Arcturus, 03 - Jardim Antares, São Bernardo do Campo, SP CEP 09606-070 Brazil
                [ ]Department of Engineering, University of Leicester, Leicester, UK
                [ ]Department of Cardiovascular Sciences, University of Leicester, Glenfield Hospital, Leicester, UK
                [ ]Leicester NIHR Biomedical Research Unit in Cardiovascular Disease, Glenfield Hospital, Leicester, UK
                Article
                143
                10.1186/s12938-016-0143-8
                4782578
                26953240
                0f9a6ff5-d81a-49e6-a130-e6ad41490add
                © Salinet et al. 2016

                Open AccessThis article is distributed under the terms of the Creative Commons Attribution 4.0 International License ( http://creativecommons.org/licenses/by/4.0/), which permits unrestricted use, distribution, and reproduction in any medium, provided you give appropriate credit to the original author(s) and the source, provide a link to the Creative Commons license, and indicate if changes were made. The Creative Commons Public Domain Dedication waiver ( http://creativecommons.org/publicdomain/zero/1.0/) applies to the data made available in this article, unless otherwise stated.

                History
                : 3 October 2015
                : 22 February 2016
                Funding
                Funded by: FundRef http://dx.doi.org/10.13039/501100003593, Conselho Nacional de Desenvolvimento Científico e Tecnológico;
                Award ID: 200598/2009-0
                Award Recipient :
                Categories
                Research
                Custom metadata
                © The Author(s) 2016

                Biomedical engineering
                autoregressive model,atrial fibrillation,unipolar electrograms,noncontact mapping,dominant frequency mapping

                Comments

                Comment on this article