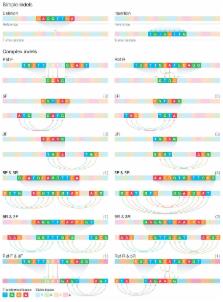
To the Editor Rapid improvements in sequencing and array-based platforms are resulting in a flood of diverse genome-wide data, including data from exome and whole genome sequencing, epigenetic surveys, expression profiling of coding and non-coding RNAs, SNP and copy number profiling, and functional assays. Analysis of these large, diverse datasets holds the promise of a more comprehensive understanding of the genome and its relation to human disease. Experienced and knowledgeable human review is an essential component of this process, complementing computational approaches. This calls for efficient and intuitive visualization tools able to scale to very large datasets and to flexibly integrate multiple data types, including clinical data. However, the sheer volume and scope of data poses a significant challenge to the development of such tools. To address this challenge we developed the Integrative Genomics Viewer (IGV), a lightweight visualization tool that enables intuitive real-time exploration of diverse, large-scale genomic datasets on standard desktop computers. It supports flexible integration of a wide range of genomic data types including aligned sequence reads, mutations, copy number, RNAi screens, gene expression, methylation, and genomic annotations (Figure S1). The IGV makes use of efficient, multi-resolution file formats to enable real-time exploration of arbitrarily large datasets over all resolution scales, while consuming minimal resources on the client computer (see Supplementary Text). Navigation through a dataset is similar to Google Maps, allowing the user to zoom and pan seamlessly across the genome at any level of detail from whole-genome to base pair (Figure S2). Datasets can be loaded from local or remote sources, including cloud-based resources, enabling investigators to view their own genomic datasets alongside publicly available data from, for example, The Cancer Genome Atlas (TCGA) 1 , 1000 Genomes (www.1000genomes.org/), and ENCODE 2 (www.genome.gov/10005107) projects. In addition, IGV allows collaborators to load and share data locally or remotely over the Web. IGV supports concurrent visualization of diverse data types across hundreds, and up to thousands of samples, and correlation of these integrated datasets with clinical and phenotypic variables. A researcher can define arbitrary sample annotations and associate them with data tracks using a simple tab-delimited file format (see Supplementary Text). These might include, for example, sample identifier (used to link different types of data for the same patient or tissue sample), phenotype, outcome, cluster membership, or any other clinical or experimental label. Annotations are displayed as a heatmap but more importantly are used for grouping, sorting, filtering, and overlaying diverse data types to yield a comprehensive picture of the integrated dataset. This is illustrated in Figure 1, a view of copy number, expression, mutation, and clinical data from 202 glioblastoma samples from the TCGA project in a 3 kb region around the EGFR locus 1, 3 . The investigator first grouped samples by tumor subtype, then by data type (copy number and expression), and finally sorted them by median copy number over the EGFR locus. A shared sample identifier links the copy number and expression tracks, maintaining their relative sort order within the subtypes. Mutation data is overlaid on corresponding copy number and expression tracks, based on shared participant identifier annotations. Several trends in the data stand out, such as a strong correlation between copy number and expression and an overrepresentation of EGFR amplified samples in the Classical subtype. IGV’s scalable architecture makes it well suited for genome-wide exploration of next-generation sequencing (NGS) datasets, including both basic aligned read data as well as derived results, such as read coverage. NGS datasets can approach terabytes in size, so careful management of data is necessary to conserve compute resources and to prevent information overload. IGV varies the displayed level of detail according to resolution scale. At very wide views, such as the whole genome, IGV represents NGS data by a simple coverage plot. Coverage data is often useful for assessing overall quality and diagnosing technical issues in sequencing runs (Figure S3), as well as analysis of ChIP-Seq 4 and RNA-Seq 5 experiments (Figures S4 and S5). As the user zooms below the ~50 kb range, individual aligned reads become visible (Figure 2) and putative SNPs are highlighted as allele counts in the coverage plot. Alignment details for each read are available in popup windows (Figures S6 and S7). Zooming further, individual base mismatches become visible, highlighted by color and intensity according to base call and quality. At this level, the investigator may sort reads by base, quality, strand, sample and other attributes to assess the evidence of a variant. This type of visual inspection can be an efficient and powerful tool for variant call validation, eliminating many false positives and aiding in confirmation of true findings (Figures S6 and S7). Many sequencing protocols produce reads from both ends (“paired ends”) of genomic fragments of known size distribution. IGV uses this information to color-code paired ends if their insert sizes are larger than expected, fall on different chromosomes, or have unexpected pair orientations. Such pairs, when consistent across multiple reads, can be indicative of a genomic rearrangement. When coloring aberrant paired ends, each chromosome is assigned a unique color, so that intra- (same color) and inter- (different color) chromosomal events are readily distinguished (Figures 2 and S8). We note that misalignments, particularly in repeat regions, can also yield unexpected insert sizes, and can be diagnosed with the IGV (Figure S9). There are a number of stand-alone, desktop genome browsers available today 6 including Artemis 7 , EagleView 8 , MapView 9 , Tablet 10 , Savant 11 , Apollo 12 , and the Integrated Genome Browser 13 . Many of them have features that overlap with IGV, particularly for NGS sequence alignment and genome annotation viewing. The Integrated Genome Browser also supports viewing array-based data. See Supplementary Table 1 and Supplementary Text for more detail. IGV focuses on the emerging integrative nature of genomic studies, placing equal emphasis on array-based platforms, such as expression and copy-number arrays, next-generation sequencing, as well as clinical and other sample metadata. Indeed, an important and unique feature of IGV is the ability to view all these different data types together and to use the sample metadata to dynamically group, sort, and filter datasets (Figure 1 above). Another important characteristic of IGV is fast data loading and real-time pan and zoom – at all scales of genome resolution and all dataset sizes, including datasets comprising hundreds of samples. Finally, we have placed great emphasis on the ease of installation and use of IGV, with the goal of making both the viewing and sharing of their data accessible to non-informatics end users. IGV is open source software and freely available at http://www.broadinstitute.org/igv/, including full documentation on use of the software. Supplementary Material 1