94
views
0
recommends
+1 Recommend
1 collections
    0
    shares
      • Record: found
      • Abstract: found
      • Article: found
      Is Open Access

      Delay or Avoidance of Medical Care Because of COVID-19–Related Concerns — United States, June 2020

      research-article

      Read this article at

      Bookmark
          There is no author summary for this article yet. Authors can add summaries to their articles on ScienceOpen to make them more accessible to a non-specialist audience.

          Abstract

          Temporary disruptions in routine and nonemergency medical care access and delivery have been observed during periods of considerable community transmission of SARS-CoV-2, the virus that causes coronavirus disease 2019 (COVID-19) ( 1 ). However, medical care delay or avoidance might increase morbidity and mortality risk associated with treatable and preventable health conditions and might contribute to reported excess deaths directly or indirectly related to COVID-19 ( 2 ). To assess delay or avoidance of urgent or emergency and routine medical care because of concerns about COVID-19, a web-based survey was administered by Qualtrics, LLC, during June 24–30, 2020, to a nationwide representative sample of U.S. adults aged ≥18 years. Overall, an estimated 40.9% of U.S. adults have avoided medical care during the pandemic because of concerns about COVID-19, including 12.0% who avoided urgent or emergency care and 31.5% who avoided routine care. The estimated prevalence of urgent or emergency care avoidance was significantly higher among the following groups: unpaid caregivers for adults* versus noncaregivers (adjusted prevalence ratio [aPR] = 2.9); persons with two or more selected underlying medical conditions † versus those without those conditions (aPR = 1.9); persons with health insurance versus those without health insurance (aPR = 1.8); non-Hispanic Black (Black) adults (aPR = 1.6) and Hispanic or Latino (Hispanic) adults (aPR = 1.5) versus non-Hispanic White (White) adults; young adults aged 18–24 years versus adults aged 25–44 years (aPR = 1.5); and persons with disabilities § versus those without disabilities (aPR = 1.3). Given this widespread reporting of medical care avoidance because of COVID-19 concerns, especially among persons at increased risk for severe COVID-19, urgent efforts are warranted to ensure delivery of services that, if deferred, could result in patient harm. Even during the COVID-19 pandemic, persons experiencing a medical emergency should seek and be provided care without delay ( 3 ). During June 24–30, 2020, a total of 5,412 (54.7%) of 9,896 eligible adults ¶ completed web-based COVID-19 Outbreak Public Evaluation Initiative surveys administered by Qualtrics, LLC.** The Human Research Ethics Committee of Monash University (Melbourne, Australia) reviewed and approved the study protocol on human subjects research. This activity was also reviewed by CDC and was conducted consistent with applicable federal law and CDC policy. †† Respondents were informed of the study purposes and provided electronic consent before commencement, and investigators received anonymized responses. The 5,412 participants included 3,683 (68.1%) first-time respondents and 1,729 (31.9%) persons who had completed a related survey §§ during April 2–8, 2020. Among the 5,412 participants, 4,975 (91.9%) provided complete data for all variables in this analysis. Quota sampling and survey weighting ¶¶ were employed to improve cohort representativeness of the U.S. population by gender, age, and race/ethnicity. Respondents were asked “Have you delayed or avoided medical care due to concerns related to COVID-19?” Delay or avoidance was evaluated for emergency (e.g., care for immediate life-threatening conditions), urgent (e.g., care for immediate non–life-threatening conditions), and routine (e.g., annual check-ups) medical care. Given the potential for variation in interpretation of whether conditions were life-threatening, responses for urgent and emergency care delay or avoidance were combined for analysis. Covariates included gender; age; race/ethnicity; disability status; presence of one or more selected underlying medical conditions known to increase risk for severe COVID-19; education; essential worker status***; unpaid adult caregiver status; U.S. census region; urban/rural classification ††† ; health insurance status; whether respondents knew someone who had received a positive SARS-CoV-2 test result or had died from COVID-19; and whether the respondents believed they were at high risk for severe COVID-19. Comparisons within all these subgroups were evaluated using multivariable Poisson regression models §§§ with robust standard errors to estimate prevalence ratios adjusted for all covariates, 95% confidence intervals, and p-values to evaluate statistical significance (α = 0.05) using the R survey package (version 3.29) and R software (version 4.0.2; The R Foundation). As of June 30, 2020, among 4,975 U.S. adult respondents, 40.9% reported having delayed or avoided any medical care, including urgent or emergency care (12.0%) and routine care (31.5%), because of concerns about COVID-19 (Table 1). Groups of persons among whom urgent or emergency care avoidance exceeded 20% and among whom any care avoidance exceeded 50% included adults aged 18–24 years (30.9% for urgent or emergency care; 57.2% for any care), unpaid caregivers for adults (29.8%; 64.3%), Hispanic adults (24.6%; 55.5%), persons with disabilities (22.8%; 60.3%), persons with two or more selected underlying medical conditions (22.7%; 54.7%), and students (22.7%; 50.3%). One in four unpaid caregivers reported caring for adults who were at increased risk for severe COVID-19. TABLE 1 Estimated prevalence of delay or avoidance of medical care because of concerns related to COVID-19, by type of care and respondent characteristics — United States, June 30, 2020 Characteristic No. (%)† Type of medical care delayed or avoided* Urgent or emergency Routine Any %† P-value§ %† P-value§ %† P-value§ All respondents 4,975 (100) 12.0 — 31.5 — 40.9 — Gender Female 2,528 (50.8) 11.7 0.598 35.8 <0.001 44.9 <0.001 Male 2,447 (49.2) 12.3 27.0 36.7 Age group, yrs 18–24 650 (13.1) 30.9 <0.001 29.6 0.072 57.2 <0.001 25–44 1,740 (35.0) 14.9 34.2 44.8 45–64 1,727 (34.7) 5.7 30.0 34.5 ≥65 858 (17.3) 4.4 30.3 33.5 Race/Ethnicity White, non-Hispanic 3,168 (63.7) 6.7 <0.001 30.9 0.020 36.2 <0.001 Black, non-Hispanic 607 (12.2) 23.3 29.7 48.1 Asian, non-Hispanic 238 (4.8) 8.6 31.3 37.7 Other race or multiple races, non-Hispanic¶ 150 (3.0) 15.5 23.9 37.3 Hispanic, any race or races 813 (16.3) 24.6 36.4 55.5 Disability** Yes 1,108 (22.3) 22.8 <0.001 42.9 <0.001 60.3 <0.001 No 3,867 (77.7) 8.9 28.2 35.3 Underlying medical condition†† No 2,537 (51.0) 8.2 <0.001 27.9 <0.001 34.7 <0.001 One 1,328 (26.7) 10.4 33.0 41.2 Two or more 1,110 (22.3) 22.7 37.7 54.7 2019 household income, USD <25,000 665 (13.4) 13.9 0.416 31.2 0.554 42.8 0.454 25,000–49,999 1,038 (20.9) 11.1 30.9 38.6 50,000–99,999 1,720 (34.6) 12.5 30.5 41.1 ≥100,000 1,552 (31.2) 11.2 33.0 41.4 Education Less than high school diploma 65 (1.3) 15.6 0.442 24.7 0.019 37.9 0.170 High school diploma 833 (16.7) 12.3 28.1 38.1 Some college 1,302 (26.2) 13.6 29.7 40.3 Bachelor's degree 1,755 (35.3) 11.2 34.8 43.6 Professional degree 1,020 (20.5) 10.9 31.2 39.5 Employment status Employed 3,049 (61.3) 14.6 <0.001 31.5 0.407 43.3 <0.001 Unemployed 630 (12.7) 8.7 34.4 39.5 Retired 1,129 (22.7) 5.3 29.9 33.8 Student 166 (3.3) 22.7 30.5 50.3 Essential worker status§§ Essential worker 1,707 (34.3) 19.5 <0.001 32.4 0.293 48.0 <0.001 Nonessential worker 1,342 (27.0) 8.4 30.3 37.3 Unpaid caregiver status¶¶ Unpaid caregiver for adults 1,344 (27.0) 29.8 <0.001 41.0 <0.001 64.3 <0.001 Not unpaid caregiver for adults 3,631 (73.0) 5.4 27.9 32.2 U.S. Census region*** Northeast 1,122 (22.6) 11.0 0.008 33.9 0.203 42.5 0.460 Midwest 936 (18.8) 8.5 32.0 38.7 South 1,736 (34.9) 13.9 29.6 40.7 West 1,181 (23.7) 13.0 31.5 41.5 Rural/Urban classification††† Urban 4,411 (88.7) 12.3 0.103 31.5 0.763 41.2 0.216 Rural 564 (11.3) 9.4 30.9 38.2 Health insurance status Yes 4,577 (92.0) 12.4 0.036 32.6 <0.001 42.3 <0.001 No 398 (8.0) 7.8 18.4 24.8 Know someone with positive test results for SARS-CoV-2§§§ Yes 989 (19.9) 8.8 0.004 40.7 <0.001 46.6 <0.001 No 3,986 (80.1) 12.8 29.2 39.5 Knew someone who died from COVID-19 Yes 364 (7.3) 10.1 0.348 41.4 <0.001 46.3 0.048 No 4,611 (92.7) 12.2 30.7 40.5 Believed to be in group at high risk for severe COVID-19 Yes 981 (19.7) 10.0 0.050 42.5 <0.001 49.4 <0.001 No 3,994 (80.3) 12.5 28.8 38.8 Abbreviations: CI = confidence interval; COVID-19 = coronavirus disease 2019; USD = U.S. dollars. * The types of medical care avoidance are not mutually exclusive; respondents had the option to indicate that they had delayed or avoided more than one type of medical care (i.e., routine medical care and urgent/emergency medical care). † Statistical raking and weight trimming were employed to improve the cross-sectional June cohort representativeness of the U.S. population by gender, age, and race/ethnicity according to the 2010 U.S. Census. § The Rao-Scott adjusted Pearson chi-squared test was used to test for differences in observed and expected frequencies among groups by characteristic for avoidance of each type of medical care (e.g., whether avoidance of routine medical care differs significantly by gender). Statistical significance was evaluated at a threshold of α = 0.05. ¶ “Other” race includes American Indian or Alaska Native, Native Hawaiian or Pacific Islander, or Other. ** Persons who had a disability were defined as such based on a qualifying response to either one of two questions: “Are you limited in any way in any activities because of physical, mental, or emotional condition?” and “Do you have any health conditions that require you to use special equipment, such as a cane, wheelchair, special bed, or special telephone?” https://www.cdc.gov/brfss/questionnaires/pdf-ques/2015-brfss-questionnaire-12-29-14.pdf. †† Selected underlying medical conditions known to increase the risk for severe COVID-19 included in this analysis were obesity, diabetes, high blood pressure, cardiovascular disease, and any type of cancer. Obesity is defined as body mass index ≥30 kg/m2 and was calculated from self-reported height and weight (https://www.cdc.gov/healthyweight/assessing/bmi/adult_bmi/index.html). The remaining conditions were assessed using the question “Have you ever been diagnosed with any of the following conditions?” with response options of 1) “Never”; 2) “Yes, I have in the past, but don’t have it now”; 3) “Yes I have, but I do not regularly take medications or receive treatment”; and 4) “Yes I have, and I am regularly taking medications or receiving treatment.” Respondents who answered that they have been diagnosed and chose either response 3 or 4 were considered as having the specified medical condition. §§ Essential worker status was self-reported. ¶¶ Unpaid caregiver status was self-reported. Unpaid caregivers for adults were defined as having provided unpaid care to a relative or friend aged ≥18 years at any time in the last 3 months. Examples provided to survey respondents included helping with personal needs, household chores, health care tasks, managing a person’s finances, taking them to a doctor’s appointment, arranging for outside services, and visiting regularly to see how they are doing. *** Region classification was determined by using the U.S. Census Bureau’s Census Regions and Divisions. https://www2.census.gov/geo/pdfs/maps-data/maps/reference/us_regdiv.pdf. ††† Rural-urban classification was determined by using self-reported ZIP codes according to the Federal Office of Rural Health Policy definition of rurality. https://www.hrsa.gov/rural-health/about-us/definition/datafiles.html. §§§ For this question, respondents were asked to select the following statement, if applicable: “I know someone who has tested positive for COVID-19.” 
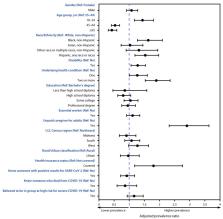
In the multivariable Poisson regression models, differences within groups were observed for urgent or emergency care avoidance (Figure) and any care avoidance (Table 2). Adjusted prevalence of urgent or emergency care avoidance was significantly higher among unpaid caregivers for adults versus noncaregivers (2.9; 2.3–3.6); persons with two or more selected underlying medical conditions versus those without those conditions (1.9; 1.5–2.4); persons with health insurance versus those without health insurance (1.8; 1.2–2.8); Black adults (1.6; 1.3–2.1) and Hispanic adults (1.5; 1.2–2.0) versus White adults; young adults aged 18–24 years versus adults aged 25–44 years (1.5; 1.2–1.8); and persons with disabilities versus those without disabilities (1.3; 1.1–1.5). Avoidance of urgent or emergency care was significantly lower among adults aged ≥45 years than among younger adults. FIGURE Adjusted prevalence ratios* , † for characteristics § , ¶ , ** , †† associated with delay or avoidance of urgent or emergency medical care because of concerns related to COVID-19 — United States, June 30, 2020 Abbreviation: COVID-19 = coronavirus disease 2019. * Comparisons within subgroups were evaluated using Poisson regressions used to calculate a prevalence ratio adjusted for all characteristics shown in figure. † 95% confidence intervals indicated with error bars. § “Other” race includes American Indian or Alaska Native, Native Hawaiian or Pacific Islander, or Other. ¶ Selected underlying medical conditions known to increase the risk for severe COVID-19 were obesity, diabetes, high blood pressure, cardiovascular disease, and any type of cancer. Obesity is defined as body mass index ≥30 kg/m2 and was calculated from self-reported height and weight (https://www.cdc.gov/healthyweight/assessing/bmi/adult_bmi/index.html). The remaining conditions were assessed using the question “Have you ever been diagnosed with any of the following conditions?” with response options of 1) “Never”; 2) “Yes, I have in the past, but don’t have it now”; 3) “Yes I have, but I do not regularly take medications or receive treatment”; and 4) “Yes I have, and I am regularly taking medications or receiving treatment.” Respondents who answered that they have been diagnosed and chose either response 3 or 4 were considered as having the specified medical condition. ** Essential worker status was self-reported. For the adjusted prevalence ratios, essential workers were compared with all other respondents (including those who were nonessential workers, retired, unemployed, and students). †† Unpaid caregiver status was self-reported. Unpaid caregivers for adults were defined as having provided unpaid care to a relative or friend aged ≥18 years to help them take care of themselves at any time in the last 3 months. The figure is a forest plot showing the adjusted prevalence ratios for characteristics associated with delay or avoidance of urgent or emergency medical care because of concerns related to COVID-19, in the United States, as of June 30, 2020. TABLE 2 Characteristics associated with delay or avoidance of any medical care because of concerns related to COVID-19 — United States, June 30, 2020 Characteristic Weighted* no. Avoided or delayed any medical care aPR† (95% CI†) P-value† All respondents 4,975 — — — Gender Female 2,528 Referent — — Male 2,447 0.81 (0.75–0.87)§ <0.001 Age group, yrs 18–24 650 1.12 (1.01–1.25)§ 0.035 25–44 1,740 Referent — — 45–64 1,727 0.80 (0.72–0.88)§ <0.001 ≥65 858 0.72 (0.64–0.81)§ <0.001 Race/Ethnicity White, non-Hispanic 3,168 Referent — — Black, non-Hispanic 607 1.07 (0.96–1.19) 0.235 Asian, non-Hispanic 238 1.04 (0.91–1.18) 0.567 Other race or multiple races, non-Hispanic¶ 150 0.87 (0.71–1.07) 0.196 Hispanic, any race or races 813 1.15 (1.03–1.27)§ 0.012 Disability** Yes 1,108 1.33 (1.23–1.43)§ <0.001 No 3,867 Referent — — Underlying medical condition†† No 2,537 Referent — — One 1,328 1.15 (1.05–1.25)§ 0.004 Two or more 1,110 1.31 (1.20–1.42)§ <0.001 Education Less than high school diploma 65 0.72 (0.53–0.98)§ 0.037 High school diploma 833 0.79 (0.71–0.89)§ <0.001 Some college 1,302 0.85 (0.78–0.93)§ 0.001 Bachelor's degree 1,755 Referent — — Professional degree 1,020 0.90 (0.82–0.98)§ 0.019 Essential workers vs others§§ Essential workers 1,707 1.00 (0.92–1.09) 0.960 Other respondents (nonessential workers, retired persons, unemployed persons, and students) 3,268 Referent — — Unpaid caregiver status¶¶ Unpaid caregiver for adults 1,344 1.64 (1.52–1.78)§ <0.001 Not unpaid caregiver for adults 3,631 Referent — — U.S. Census region*** Northeast 1,122 Referent — — Midwest 936 0.93 (0.83–1.04) 0.214 South 1,736 0.90 (0.82–0.99)§ 0.028 West 1,181 0.99 (0.89–1.09) 0.808 Rural/Urban classification††† Urban 4,411 1.00 (0.89–1.12) 0.993 Rural 564 Referent — — Health insurance status Yes 4,577 1.61 (1.31–1.98)§ <0.001 No 398 Referent — — Know someone with positive test results for SARS-CoV-2§§§ Yes 989 1.22 (1.12–1.33)§ <0.001 No 3,986 Referent — — Knew someone who died from COVID-19 Yes 364 0.99 (0.88–1.12) 0.860 No 4,611 Referent — — Believed to be in a group at high risk for severe COVID-19 Yes 981 1.33 (1.23–1.44)§ <0.001 No 3,994 Referent — — Abbreviations: aPR = adjusted prevalence ratio; CI = confidence interval; COVID-19 = coronavirus disease 2019. * Statistical raking and weight trimming were employed to improve the cross-sectional June cohort representativeness of the U.S. population by gender, age, and race/ethnicity according to the 2010 U.S. Census. † Comparisons within subgroups were evaluated using Poisson regressions used to calculate a prevalence ratio adjusted for all characteristics listed, as well as a 95% CI and p-value. Statistical significance was evaluated at a threshold of α = 0.05. § P-value calculated using Poisson regression among respondents within a characteristic is statistically significant at levels of p<0.05. ¶ “Other” race includes American Indian or Alaska Native, Native Hawaiian or Pacific Islander, or Other. ** Persons who had a disability were defined based on a qualifying response to either one of two questions: “Are you limited in any way in any activities because of physical, mental, or emotional condition?” and “Do you have any health conditions that require you to use special equipment, such as a cane, wheelchair, special bed, or special telephone?” https://www.cdc.gov/brfss/questionnaires/pdf-ques/2015-brfss-questionnaire-12-29-14.pdf. †† Selected underlying medical conditions known to increase the risk for severe COVID-19 were obesity, diabetes, high blood pressure, cardiovascular disease, and any type of cancer. Obesity is defined as body mass index ≥30 kg/m2 and was calculated from self-reported height and weight (https://www.cdc.gov/healthyweight/assessing/bmi/adult_bmi/index.html). The remaining conditions were assessed using the question “Have you ever been diagnosed with any of the following conditions?” with response options of 1) “Never”; 2) “Yes, I have in the past, but don’t have it now”; 3) “Yes I have, but I do not regularly take medications or receive treatment”; and 4) “Yes I have, and I am regularly taking medications or receiving treatment.” Respondents who answered that they have been diagnosed and chose either response 3 or 4 were considered as having the specified medical condition. §§ Essential worker status was self-reported. For the adjusted prevalence ratios, essential workers were compared with all other respondents (including those who were nonessential workers, retired, unemployed, and students). ¶¶ Unpaid caregiver status was self-reported. Unpaid caregivers for adults were defined as having provided unpaid care to a relative or friend aged ≥18 years at any time in the last 3 months. Examples provided to survey respondents included helping with personal needs, household chores, health care tasks, managing a person’s finances, taking them to a doctor’s appointment, arranging for outside services, and visiting regularly to see how they are doing. *** Region classification was determined by using the U.S. Census Bureau’s Census Regions and Divisions. https://www2.census.gov/geo/pdfs/maps-data/maps/reference/us_regdiv.pdf. ††† Rural/urban classification was determined by using self-reported ZIP codes according to the Federal Office of Rural Health Policy definition of rurality. https://www.hrsa.gov/rural-health/about-us/definition/datafiles.html. §§§ For this question, respondents were asked to select the following statement, if applicable: “I know someone who has tested positive for COVID-19.” Discussion As of June 30, 2020, an estimated 41% of U.S. adults reported having delayed or avoided medical care during the pandemic because of concerns about COVID-19, including 12% who reported having avoided urgent or emergency care. These findings align with recent reports that hospital admissions, overall emergency department (ED) visits, and the number of ED visits for heart attack, stroke, and hyperglycemic crisis have declined since the start of the pandemic ( 3 – 5 ), and that excess deaths directly or indirectly related to COVID-19 have increased in 2020 versus prior years ( 2 ). Nearly one third of adult respondents reported having delayed or avoided routine medical care, which might reflect adherence to community mitigation efforts such as stay-at-home orders, temporary closures of health facilities, or additional factors. However, if routine care avoidance were to be sustained, adults could miss opportunities for management of chronic conditions, receipt of routine vaccinations, or early detection of new conditions, which might worsen outcomes. Avoidance of both urgent or emergency and routine medical care because of COVID-19 concerns was highly prevalent among unpaid caregivers for adults, respondents with two or more underlying medical conditions, and persons with disabilities. For caregivers who reported caring for adults at increased risk for severe COVID-19, concern about exposure of care recipients might contribute to care avoidance. Persons with underlying medical conditions that increase their risk for severe COVID-19 ( 6 ) are more likely to require care to monitor and treat these conditions, potentially contributing to their more frequent report of avoidance. Moreover, persons at increased risk for severe COVID-19 might have avoided health care facilities because of perceived or actual increased risk of exposure to SARS-CoV-2, particularly at the onset of the pandemic. However, health care facilities are implementing important safety precautions to reduce the risk of SARS-CoV-2 infection among patients and personnel. In contrast, delay or avoidance of care might increase risk for life-threatening medical emergencies. In a recent study, states with large numbers of COVID-19–associated deaths also experienced large proportional increases in deaths from other underlying causes, including diabetes and cardiovascular disease ( 7 ). For persons with disabilities, accessing medical services might be challenging because of disruptions in essential support services, which can result in adverse health outcomes. Medical services for persons with disabilities might also be disrupted because of reduced availability of accessible transportation, reduced communication in accessible formats, perceptions of SARS-CoV-2 exposure risk, and specialized needs that are difficult to address with routine telehealth delivery during the pandemic response. Increasing accessibility of medical and telehealth services ¶¶¶ might help prevent delay of needed care. Increased prevalences of reported urgent or emergency care avoidance among Black adults and Hispanic adults compared with White adults are especially concerning given increased COVID-19-associated mortality among Black adults and Hispanic adults ( 8 ). In the United States, the age-adjusted COVID-19 hospitalization rates are approximately five times higher among Black persons and four times higher among Hispanic persons than are those among White persons ( 9 ). Factors contributing to racial and ethnic disparities in SARS-CoV-2 exposure, illness, and mortality might include long-standing structural inequities that influence life expectancy, including prevalence and underlying medical conditions, health insurance status, and health care access and utilization, as well as work and living circumstances, including use of public transportation and essential worker status. Communities, health care systems, and public health agencies can foster equity by working together to ensure access to information, testing, and care to assure maintenance and management of physical and mental health. The higher prevalence of medical care delay or avoidance among respondents with health insurance versus those without insurance might reflect differences in medical care-seeking behaviors. Before the pandemic, persons without insurance sought medical care much less frequently than did those with insurance ( 10 ), resulting in fewer opportunities for medical care delay or avoidance. The findings in this report are subject to at least five limitations. First, self-reported data are subject to recall, response, and social desirability biases. Second, the survey did not assess reasons for COVID-19–associated care avoidance, such as adherence to public health recommendations; closure of health care provider facilities; reduced availability of public transportation; fear of exposure to infection with SARS-CoV-2; or availability, accessibility, and acceptance or recognition of telemedicine as a means of providing care in lieu of in-person services. Third, the survey did not assess baseline patterns of care-seeking or timing or duration of care avoidance. Fourth, perceptions of whether a condition was life-threatening might vary among respondents. Finally, although quota sampling methods and survey weighting were employed to improve cohort representativeness, this web-based survey might not be fully representative of the U.S. population for income, educational attainment, and access to technology. However, the findings are consistent with reported declines in hospital admissions and ED visits during the pandemic ( 3 – 5 ). CDC has issued guidance to assist persons at increased risk for severe COVID-19 in staying healthy and safely following treatment plans**** and to prepare health care facilities to safely deliver care during the pandemic. †††† Additional public outreach in accessible formats tailored for diverse audiences might encourage these persons to seek necessary care. Messages could highlight the risks of delaying needed care, especially among persons with underlying medical conditions, and the importance of timely emergency care. Patient concerns related to potential exposure to SARS-CoV-2 in health care settings could be addressed by describing facilities’ precautions to reduce exposure risk. Further exploration of underlying reasons for medical care avoidance is needed, including among persons with disabilities, persons with underlying health conditions, unpaid caregivers for adults, and those who face structural inequities. If care were avoided because of concern about SARS-CoV-2 exposure or if there were closures or limited options for in-person services, providing accessible telehealth or in-home health care could address some care needs. Even during the COVID-19 pandemic, persons experiencing a medical emergency should seek and be provided care without delay ( 3 ). Summary What is already known about this topic? Delayed or avoided medical care might increase morbidity and mortality associated with both chronic and acute health conditions. What is added by this report? By June 30, 2020, because of concerns about COVID-19, an estimated 41% of U.S. adults had delayed or avoided medical care including urgent or emergency care (12%) and routine care (32%). Avoidance of urgent or emergency care was more prevalent among unpaid caregivers for adults, persons with underlying medical conditions, Black adults, Hispanic adults, young adults, and persons with disabilities. What are the implications for public health practice? Understanding factors associated with medical care avoidance can inform targeted care delivery approaches and communication efforts encouraging persons to safely seek timely routine, urgent, and emergency care.

          Related collections

          Most cited references7

          • Record: found
          • Abstract: found
          • Article: found
          Is Open Access

          Coronavirus Disease 2019 Case Surveillance — United States, January 22–May 30, 2020

          The coronavirus disease 2019 (COVID-19) pandemic resulted in 5,817,385 reported cases and 362,705 deaths worldwide through May, 30, 2020, † including 1,761,503 aggregated reported cases and 103,700 deaths in the United States. § Previous analyses during February–early April 2020 indicated that age ≥65 years and underlying health conditions were associated with a higher risk for severe outcomes, which were less common among children aged 10% of persons in this age group. TABLE 2 Reported underlying health conditions* and symptoms † among persons with laboratory-confirmed COVID-19, by sex and age group — United States, January 22–May 30, 2020 Characteristic No. (%) Total Sex Age group (yrs) Male Female ≤9 10–19 20–29 30–39 40–49 50–59 60–69 70–79 ≥80 Total population 1,320,488 646,358 674,130 20,458 49,245 182,469 214,849 219,139 235,774 179,007 105,252 114,295 Underlying health condition§ Known underlying medical condition status* 287,320 (21.8) 138,887 (21.5) 148,433 (22.0) 2,896 (14.2) 7,123 (14.5) 27,436 (15.0) 33,483 (15.6) 40,572 (18.5) 54,717 (23.2) 50,125 (28.0) 34,400 (32.7) 36,568 (32.0) Any cardiovascular disease¶ 92,546 (32.2) 47,567 (34.2) 44,979 (30.3) 78 (2.7) 164 (2.3) 1,177 (4.3) 3,588 (10.7) 8,198 (20.2) 16,954 (31.0) 21,466 (42.8) 18,763 (54.5) 22,158 (60.6) Any chronic lung disease 50,148 (17.5) 20,930 (15.1) 29,218 (19.7) 363 (12.5) 1,285 (18) 4,537 (16.5) 5,110 (15.3) 6,127 (15.1) 8,722 (15.9) 9,200 (18.4) 7,436 (21.6) 7,368 (20.1) Renal disease 21,908 (7.6) 12,144 (8.7) 9,764 (6.6) 21 (0.7) 34 (0.5) 204 (0.7) 587 (1.8) 1,273 (3.1) 2,789 (5.1) 4,764 (9.5) 5,401 (15.7) 6,835 (18.7) Diabetes 86,737 (30.2) 45,089 (32.5) 41,648 (28.1) 12 (0.4) 225 (3.2) 1,409 (5.1) 4,106 (12.3) 9,636 (23.8) 19,589 (35.8) 22,314 (44.5) 16,594 (48.2) 12,852 (35.1) Liver disease 3,953 (1.4) 2,439 (1.8) 1,514 (1.0) 5 (0.2) 19 (0.3) 132 (0.5) 390 (1.2) 573 (1.4) 878 (1.6) 1,074 (2.1) 583 (1.7) 299 (0.8) Immunocompromised 15,265 (5.3) 7,345 (5.3) 7,920 (5.3) 61 (2.1) 146 (2.0) 646 (2.4) 1,253 (3.7) 2,005 (4.9) 3,190 (5.8) 3,421 (6.8) 2,486 (7.2) 2,057 (5.6) Neurologic/Neurodevelopmental disability 13,665 (4.8) 6,193 (4.5) 7,472 (5.0) 41 (1.4) 113 (1.6) 395 (1.4) 533 (1.6) 734 (1.8) 1,338 (2.4) 2,006 (4.0) 2,759 (8.0) 5,746 (15.7) Symptom§ Known symptom status† 373,883 (28.3) 178,223 (27.6) 195,660 (29.0) 5,188 (25.4) 12,689 (25.8) 51,464 (28.2) 59,951 (27.9) 62,643 (28.6) 70,040 (29.7) 52,178 (29.1) 28,583 (27.2) 31,147 (27.3) Fever, cough, or shortness of breath 260,706 (69.7) 125,768 (70.6) 134,938 (69.0) 3,278 (63.2) 7,584 (59.8) 35,072 (68.1) 42,016 (70.1) 45,361 (72.4) 51,283 (73.2) 37,701 (72.3) 19,583 (68.5) 18,828 (60.4) Fever †† 161,071 (43.1) 80,578 (45.2) 80,493 (41.1) 2,404 (46.3) 4,443 (35.0) 20,381 (39.6) 25,887 (43.2) 28,407 (45.3) 32,375 (46.2) 23,591 (45.2) 12,190 (42.6) 11,393 (36.6) Cough 187,953 (50.3) 89,178 (50.0) 98,775 (50.5) 1,912 (36.9) 5,257 (41.4) 26,284 (51.1) 31,313 (52.2) 34,031 (54.3) 38,305 (54.7) 27,150 (52.0) 12,837 (44.9) 10,864 (34.9) Shortness of breath 106,387 (28.5) 49,834 (28.0) 56,553 (28.9) 339 (6.5) 2,070 (16.3) 13,649 (26.5) 16,851 (28.1) 18,978 (30.3) 21,327 (30.4) 16,018 (30.7) 8,971 (31.4) 8,184 (26.3) Myalgia 135,026 (36.1) 61,922 (34.7) 73,104 (37.4) 537 (10.4) 3,737 (29.5) 21,153 (41.1) 26,464 (44.1) 28,064 (44.8) 28,594 (40.8) 17,360 (33.3) 6,015 (21.0) 3,102 (10.0) Runny nose 22,710 (6.1) 9,900 (5.6) 12,810 (6.5) 354 (6.8) 1,025 (8.1) 4,591 (8.9) 4,406 (7.3) 4,141 (6.6) 4,100 (5.9) 2,671 (5.1) 923 (3.2) 499 (1.6) Sore throat 74,840 (20.0) 31,244 (17.5) 43,596 (22.3) 664 (12.8) 3,628 (28.6) 14,493 (28.2) 14,855 (24.8) 14,490 (23.1) 13,930 (19.9) 8,192 (15.7) 2,867 (10.0) 1,721 (5.5) Headache 128,560 (34.4) 54,721 (30.7) 73,839 (37.7) 785 (15.1) 5,315 (41.9) 23,723 (46.1) 26,142 (43.6) 26,245 (41.9) 26,057 (37.2) 14,735 (28.2) 4,163 (14.6) 1,395 (4.5) Nausea/Vomiting 42,813 (11.5) 16,549 (9.3) 26,264 (13.4) 506 (9.8) 1,314 (10.4) 6,648 (12.9) 7,661 (12.8) 8,091 (12.9) 8,737 (12.5) 5,953 (11.4) 2,380 (8.3) 1,523 (4.9) Abdominal pain 28,443 (7.6) 11,553 (6.5) 16,890 (8.6) 349 (6.7) 978 (7.7) 4,211 (8.2) 5,150 (8.6) 5,531 (8.8) 6,134 (8.8) 3,809 (7.3) 1,449 (5.1) 832 (2.7) Diarrhea 72,039 (19.3) 32,093 (18.0) 39,946 (20.4) 704 (13.6) 1,712 (13.5) 9,867 (19.2) 12,769 (21.3) 13,958 (22.3) 15,536 (22.2) 10,349 (19.8) 4,402 (15.4) 2,742 (8.8) Loss of smell or taste 31,191 (8.3) 12,717 (7.1) 18,474 (9.4) 67 (1.3) 1,257 (9.9) 6,828 (13.3) 6,907 (11.5) 6,361 (10.2) 5,828 (8.3) 2,930 (5.6) 775 (2.7) 238 (0.8) Abbreviation: COVID-19 = coronavirus disease 2019. * Status of underlying health conditions known for 287,320 persons. Status was classified as “known” if any of the following conditions were reported as present or absent: diabetes mellitus, cardiovascular disease (including hypertension), severe obesity (body mass index ≥40 kg/m2), chronic renal disease, chronic liver disease, chronic lung disease, immunocompromising condition, autoimmune condition, neurologic condition (including neurodevelopmental, intellectual, physical, visual, or hearing impairment), psychologic/psychiatric condition, and other underlying medical condition not otherwise specified. † Symptom status was known for 373,883 persons. Status was classified as “known” if any of the following symptoms were reported as present or absent: fever (measured >100.4°F [38°C] or subjective), cough, shortness of breath, wheezing, difficulty breathing, chills, rigors, myalgia, rhinorrhea, sore throat, chest pain, nausea or vomiting, abdominal pain, headache, fatigue, diarrhea (≥3 loose stools in a 24-hour period), or other symptom not otherwise specified on the form. § Responses include data from standardized fields supplemented with data from free-text fields. Information for persons with loss of smell or taste was exclusively extracted from a free-text field; therefore, persons exhibiting this symptom were likely underreported. ¶ Includes persons with reported hypertension. ** Includes all persons with at least one of these symptoms reported. †† Persons were considered to have a fever if information on either measured or subjective fever variables if “yes” was reported for either variable. Among 287,320 (22%) cases with data on individual underlying health conditions, those most frequently reported were cardiovascular disease (32%), diabetes (30%), and chronic lung disease (18%) (Table 2); the reported proportions were similar among males and females. The frequency of conditions reported varied by age group: cardiovascular disease was uncommon among those aged ≤39 years but was reported in approximately half of the cases among persons aged ≥70 years. Among 63,896 females aged 15–44 years with known pregnancy status, 6,708 (11%) were reported to be pregnant. Among the 1,320,488 cases, outcomes for hospitalization, ICU admission, and death were available for 46%, 14%, and 36%, respectively. Overall, 184,673 (14%) patients were hospitalized, including 29,837 (2%) admitted to the ICU; 71,116 (5%) patients died (Table 3). Severe outcomes were more commonly reported for patients with reported underlying conditions. Hospitalizations were six times higher among patients with a reported underlying condition than those without reported underlying conditions (45.4% versus 7.6%). Deaths were 12 times higher among patients with reported underlying conditions compared with those without reported underlying conditions (19.5% versus 1.6%). The percentages of males who were hospitalized (16%), admitted to the ICU (3%), and who died (6%) were higher than were those for females (12%, 2%, and 5%, respectively). The percentage of ICU admissions was highest among persons with reported underlying conditions aged 60–69 years (11%) and 70–79 years (12%). Death was most commonly reported among persons aged ≥80 years regardless of the presence of underlying conditions (with underlying conditions 50%; without 30%). TABLE 3 Reported hospitalizations,* , † intensive care unit (ICU) admissions, § and deaths ¶ among laboratory-confirmed COVID-19 patients with and without reported underlying health conditions, ** by sex and age — United States, January 22–May 30, 2020 Characteristic (no.) Outcome, no./total no. (%)†† Reported hospitalizations*,† (including ICU) Reported ICU admission§ Reported deaths¶ Among all patients Among patients with reported underlying health conditions Among patients with no reported underlying health conditions Among all patients Among patients with reported underlying health conditions Among patients with no reported underlying health conditions Among all patients Among patients with reported underlying health conditions Among patients with no reported underlying health conditions Sex Male (646,358) 101,133/646,358 (15.6) 49,503/96,839 (51.1) 3,596/42,048 (8.6) 18,394/646,358 (2.8) 10,302/96,839 (10.6) 864/42,048 (2.1) 38,773/646,358 (6.0) 21,667/96,839 (22.4) 724/42,048 (1.7) Female (674,130) 83,540/674,130 (12.4) 40,698/102,040 (39.9) 3,087/46,393 (6.7) 11,443/674,130 (1.7) 6,672/102,040 (6.5) 479/46,393 (1.0) 32,343/674,130 (4.8) 17,145/102,040 (16.8) 707/46,393 (1.5) Age group (yrs) ≤9 (20,458) 848/20,458 (4.1) 138/619 (22.3) 84/2,277 (3.7) 141/20,458 (0.7) 31/619 (5.0) 16/2,277 (0.7) 13/20,458 (0.1) 4/619 (0.6) 2/2,277 (0.1) 10–19 (49,245) 1,234/49,245 (2.5) 309/2,076 (14.9) 115/5,047 (2.3) 216/49,245 (0.4) 72/2,076 (3.5) 17/5,047 (0.3) 33/49,245 (0.1) 16/2,076 (0.8) 4/5,047 (0.1) 20–29 (182,469) 6,704/182,469 (3.7) 1,559/8,906 (17.5) 498/18,530 (2.7) 864/182,469 (0.5) 300/8,906 (3.4) 56/18,530 (0.3) 273/182,469 (0.1) 122/8,906 (1.4) 24/18,530 (0.1) 30–39 (214,849) 12,570/214,849 (5.9) 3,596/14,854 (24.2) 828/18,629 (4.4) 1,879/214,849 (0.9) 787/14,854 (5.3) 135/18,629 (0.7) 852/214,849 (0.4) 411/14,854 (2.8) 21/18,629 (0.1) 40–49 (219,139) 19,318/219,139 (8.8) 7,151/24,161 (29.6) 1,057/16,411 (6.4) 3,316/219,139 (1.5) 1,540/24,161 (6.4) 208/16,411 (1.3) 2,083/219,139 (1.0) 1,077/24,161 (4.5) 58/16,411 (0.4) 50–59 (235,774) 31,588/235,774 (13.4) 14,639/40,297 (36.3) 1,380/14,420 (9.6) 5,986/235,774 (2.5) 3,335/40,297 (8.3) 296/14,420 (2.1) 5,639/235,774 (2.4) 3,158/40,297 (7.8) 131/14,420 (0.9) 60–69 (179,007) 39,422/179,007 (22.0) 21,064/42,206 (49.9) 1,216/7,919 (15.4) 7,403/179,007 (4.1) 4,588/42,206 (10.9) 291/7,919 (3.7) 11,947/179,007 (6.7) 7,050/42,206 (16.7) 187/7,919 (2.4) 70–79 (105,252) 35,844/105,252 (34.1) 20,451/31,601 (64.7) 780/2,799 (27.9) 5,939/105,252 (5.6) 3,771/31,601 (11.9) 199/2,799 (7.1) 17,510/105,252 (16.6) 10,008/31,601 (31.7) 286/2,799 (10.2) ≥80 (114,295) 37,145/114,295 (32.5) 21,294/34,159 (62.3) 725/2,409 (30.1) 4,093/114,295 (3.6) 2,550/34,159 (7.5) 125/2,409 (5.2) 32,766/114,295 (28.7) 16,966/34,159 (49.7) 718/2,409 (29.8) Total (1,320,488) 184,673/1,320,488 (14.0) 90,201/198,879 (45.4) 6,683/88,441 (7.6) 29,837/1,320,488 (2.3) 16,974/198,879 (8.5) 1,343/88,441 (1.5) 71,116/1,320,488 (5.4) 38,812/198,879 (19.5) 1,431/88,441 (1.6) Abbreviation: COVID-19 = coronavirus disease 2019. * Hospitalization status was known for 600,860 (46%). Among 184,673 hospitalized patients, the presence of underlying health conditions was known for 96,884 (53%). † Includes reported ICU admissions. § ICU admission status was known for 186,563 (14%) patients among the total case population, representing 34% of hospitalized patients. Among 29,837 patients admitted to the ICU, the status of underlying health conditions was known for 18,317 (61%). ¶ Death outcomes were known for 480,565 (36%) patients. Among 71,116 reported deaths through case surveillance, the status of underlying health conditions was known for 40,243 (57%) patients. ** Status of underlying health conditions was known for 287,320 (22%) patients. Status was classified as “known” if any of the following conditions were noted as present or absent: diabetes mellitus, cardiovascular disease including hypertension, severe obesity body mass index ≥40 kg/m2, chronic renal disease, chronic liver disease, chronic lung disease, any immunocompromising condition, any autoimmune condition, any neurologic condition including neurodevelopmental, intellectual, physical, visual, or hearing impairment, any psychologic/psychiatric condition, and any other underlying medical condition not otherwise specified. †† Outcomes were calculated as the proportion of persons reported to be hospitalized, admitted to an ICU, or who died among total in the demographic group. Outcome underreporting could result from outcomes that occurred but were not reported through national case surveillance or through clinical progression to severe outcomes that occurred after time of report. Discussion As of May 30, a total of 1,761,503 aggregate U.S. cases of COVID-19 and 103,700 associated deaths were reported to CDC. Although average daily reported cases and deaths are declining, 7-day moving averages of daily incidence of COVID-19 cases indicate ongoing community transmission. ¶¶¶¶ The COVID-19 case data summarized here are essential statistics for the pandemic response and rely on information systems developed at the local, state, and federal level over decades for communicable disease surveillance that were rapidly adapted to meet an enormous, new public health threat. CDC aggregate counts are consistent with those presented through the Johns Hopkins University (JHU) Coronavirus Resource Center, which reported a cumulative total of 1,770,165 U.S. cases and 103,776 U.S. deaths on May 30, 2020.***** Differences in aggregate counts between CDC and JHU might be attributable to differences in reporting practices to CDC and jurisdictional websites accessed by JHU. Reported cumulative incidence in the case surveillance population among persons aged ≥20 years is notably higher than that among younger persons. The lower incidence in persons aged ≤19 years could be attributable to undiagnosed milder or asymptomatic illnesses among this age group that were not reported. Incidence in persons aged ≥80 years was nearly double that in persons aged 70–79 years. Among cases with known race and ethnicity, 33% of persons were Hispanic, 22% were black, and 1.3% were AI/AN. These findings suggest that persons in these groups, who account for 18%, 13%, and 0.7% of the U.S. population, respectively, are disproportionately affected by the COVID-19 pandemic. The proportion of missing race and ethnicity data limits the conclusions that can be drawn from descriptive analyses; however, these findings are consistent with an analysis of COVID-19–Associated Hospitalization Surveillance Network (COVID-NET) ††††† data that found higher proportions of black and Hispanic persons among hospitalized COVID-19 patients than were in the overall population ( 4 ). The completeness of race and ethnicity variables in case surveillance has increased from 20% to >40% from April 2 to June 2. Although reporting of race and ethnicity continues to improve, more complete data might be available in aggregate on jurisdictional websites or through sources like the COVID Tracking Project’s COVID Racial Data Tracker. §§§§§ The data in this report show that the prevalence of reported symptoms varied by age group but was similar among males and females. Fewer than 5% of persons were reported to be asymptomatic when symptom data were submitted. Persons without symptoms might be less likely to be tested for COVID-19 because initial guidance recommended testing of only symptomatic persons and was hospital-based. Guidance on testing has evolved throughout the response. ¶¶¶¶¶ Whereas incidence among males and females was similar overall, severe outcomes were more commonly reported among males. Prevalence of reported severe outcomes increased with age; the percentages of hospitalizations, ICU admissions, and deaths were highest among persons aged ≥70 years, regardless of underlying conditions, and lowest among those aged ≤19 years. Hospitalizations were six times higher and deaths 12 times higher among those with reported underlying conditions compared with those with none reported. These findings are consistent with previous reports that found that severe outcomes increased with age and underlying condition, and males were hospitalized at a higher rate than were females ( 2 , 4 , 5 ). The findings in this report are subject to at least three limitations. First, case surveillance data represent a subset of the total cases of COVID-19 in the United States; not every case in the community is captured through testing and information collected might be limited if persons are unavailable or unwilling to participate in case investigations or if medical records are unavailable for data extraction. Reported cumulative incidence, although comparable across age and sex groups within the case surveillance population, are underestimates of the U.S. cumulative incidence of COVID-19. Second, reported frequencies of individual symptoms and underlying health conditions presented from case surveillance likely underestimate the true prevalence because of missing data. Finally, asymptomatic cases are not captured well in case surveillance. Asymptomatic persons are unlikely to seek testing unless they are identified through active screening (e.g., contact tracing), and, because of limitations in testing capacity and in accordance with guidance, investigation of symptomatic persons is prioritized. Increased identification and reporting of asymptomatic cases could affect patterns described in this report. Similar to earlier reports on COVID-19 case surveillance, severe outcomes were more commonly reported among persons who were older and those with underlying health conditions ( 1 ). Findings in this report align with demographic and severe outcome trends identified through COVID-NET ( 4 ). Findings from case surveillance are evaluated along with enhanced surveillance data and serologic survey results to provide a comprehensive picture of COVID-19 trends, and differences in proportion of cases by racial and ethnic groups should continue to be examined in enhanced surveillance to better understand populations at highest risk. Since the U.S. COVID-19 response began in January, CDC has built on existing surveillance capacity to monitor the impact of illness nationally. Collection of detailed case data is a resource-intensive public health activity, regardless of disease incidence. The high incidence of COVID-19 has highlighted limitations of traditional public health case surveillance approaches to provide real-time intelligence and supports the need for continued innovation and modernization. Despite limitations, national case surveillance of COVID-19 serves a critical role in the U.S. COVID-19 response: these data demonstrate that the COVID-19 pandemic is an ongoing public health crisis in the United States that continues to affect all populations and result in severe outcomes including death. National case surveillance findings provide important information for targeted enhanced surveillance efforts and development of interventions critical to the U.S. COVID-19 response. Summary What is already known about this topic? Surveillance data reported to CDC through April 2020 indicated that COVID-19 leads to severe outcomes in older adults and those with underlying health conditions. What is added by this report? As of May 30, 2020, among COVID-19 cases, the most common underlying health conditions were cardiovascular disease (32%), diabetes (30%), and chronic lung disease (18%). Hospitalizations were six times higher and deaths 12 times higher among those with reported underlying conditions compared with those with none reported. What are the implications for public health practice? Surveillance at all levels of government, and its continued modernization, is critical for monitoring COVID-19 trends and identifying groups at risk for infection and severe outcomes. These findings highlight the continued need for community mitigation strategies, especially for vulnerable populations, to slow COVID-19 transmission.
            Bookmark
            • Record: found
            • Abstract: found
            • Article: found
            Is Open Access

            Impact of the COVID-19 Pandemic on Emergency Department Visits — United States, January 1, 2019–May 30, 2020

            On March 13, 2020, the United States declared a national emergency to combat coronavirus disease 2019 (COVID-19). As the number of persons hospitalized with COVID-19 increased, early reports from Austria ( 1 ), Hong Kong ( 2 ), Italy ( 3 ), and California ( 4 ) suggested sharp drops in the numbers of persons seeking emergency medical care for other reasons. To quantify the effect of COVID-19 on U.S. emergency department (ED) visits, CDC compared the volume of ED visits during four weeks early in the pandemic March 29–April 25, 2020 (weeks 14 to 17; the early pandemic period) to that during March 31–April 27, 2019 (the comparison period). During the early pandemic period, the total number of U.S. ED visits was 42% lower than during the same period a year earlier, with the largest declines in visits in persons aged ≤14 years, females, and the Northeast region. Health messages that reinforce the importance of immediately seeking care for symptoms of serious conditions, such as myocardial infarction, are needed. To minimize SARS-CoV-2, the virus that causes COVID-19, transmission risk and address public concerns about visiting the ED during the pandemic, CDC recommends continued use of virtual visits and triage help lines and adherence to CDC infection control guidance. To assess trends in ED visits during the pandemic, CDC analyzed data from the National Syndromic Surveillance Program (NSSP), a collaborative network developed and maintained by CDC, state and local health departments, and academic and private sector health partners to collect electronic health data in real time. The national data in NSSP includes ED visits from a subset of hospitals in 47 states (all but Hawaii, South Dakota, and Wyoming), capturing approximately 73% of ED visits in the United States able to be analyzed at the national level. During the most recent week, 3,552 EDs reported data. Total ED visit volume, as well as patient age, sex, region, and reason for visit were analyzed. Weekly number of ED visits were examined during January 1, 2019–May 30, 2020. In addition, ED visits during two 4-week periods were compared using mean differences and ratios. The change in mean visits per week during the early pandemic period and the comparison period was calculated as the mean difference in total visits in a diagnostic category between the two periods, divided by 4 weeks ([visits in diagnostic category {early pandemic period} – visits in diagnostic category {comparison period}]/4). The visit prevalence ratio (PR) was calculated for each diagnostic category as the proportion of ED visits during the early pandemic period divided by the proportion of visits during the comparison period ([visits in category {early pandemic period}/all visits {early pandemic period}]/[visits in category {comparison period}/all visits {comparison period}]). All analyses were conducted using R software (version 3.6.0; R Foundation). Reason for visit was analyzed using a subset of records that had at least one specific, billable International Classification of Diseases, Tenth Revision, Clinical Modification (ICD-10-CM) code. In addition to Hawaii, South Dakota, and Wyoming, four states (Florida, Louisiana, New York outside New York City, and Oklahoma), two California counties reporting to the NSSP (Santa Cruz and Solano), and the District of Columbia were also excluded from the diagnostic code analysis because they did not report diagnostic codes during both periods or had differences in completeness of codes between 2019 and 2020. Among eligible visits for the diagnostic code analysis, 20.3% without a valid ICD-10-CM code were excluded. ED visits were categorized using the Clinical Classifications Software Refined tool (version 2020.2; Healthcare Cost and Utilization Project), which combines ICD-10-CM codes into clinically meaningful groups ( 5 ). A visit with multiple ICD-10-CM codes could be included in multiple categories; for example, a visit by a patient with diabetes and hypertension would be included in the category for diabetes and the category for hypertension. Because COVID-19 is not yet classified in this tool, a custom category, defined as any visit with the ICD-10-CM code for confirmed COVID-19 diagnosis (U07.1), was created ( 6 ). The analysis was limited to the top 200 diagnostic categories during each period. The lowest number of visits reported to NSSP occurred during April 12–18, 2020 (week 16). Although visits have increased since the nadir, the most recent complete week (May 24–30, week 22) remained 26% below the corresponding week in 2019 (Figure 1). The number of ED visits decreased 42%, from a mean of 2,099,734 per week during March 31–April 27, 2019, to a mean of 1,220,211 per week during the early pandemic period of March 29–April 25, 2020. Visits declined for every age group (Figure 2), with the largest proportional declines in visits by children aged ≤10 years (72%) and 11–14 years (71%). Declines in ED visits varied by U.S. Department of Health and Human Services region,* with the largest declines in the Northeast (Region 1, 49%) and in the region that includes New Jersey and New York (Region 2, 48%) (Figure 2). Visits declined 37% among males and 45% among females across all NSSP EDs between the comparison and early pandemic periods. FIGURE 1 Weekly number of emergency department (ED) visits — National Syndromic Surveillance Program, United States,* January 1, 2019– May 30, 2020† * Hawaii, South Dakota, and Wyoming are not included. † Vertical lines indicate the beginning and end of the 4-week coronavirus disease 2019 (COVID-19) early pandemic period (March 29–April 25, 2020) and the comparison period (March 31–April 27, 2019). The figure is a line graph showing the weekly number of emergency department visits, using data from the National Syndromic Surveillance Program, in the United States, during January 1, 2019–May 30, 2020. FIGURE 2 Emergency department (ED) visits, by age group (A) and U.S. Department of Health and Human Services (HHS) region* (B) — National Syndromic Surveillance Program, United States,† March 31–April 27, 2019 (comparison period) and March 29–April 25, 2020 (early pandemic period) * Region 1: Connecticut, Maine, Massachusetts, New Hampshire, Rhode Island, and Vermont; Region 2: New Jersey and New York; Region 3: Delaware, District of Columbia, Maryland, Pennsylvania, Virginia, and West Virginia; Region 4: Alabama, Florida, Georgia, Kentucky, Mississippi, North Carolina, South Carolina, and Tennessee; Region 5: Illinois, Indiana, Michigan, Minnesota, Ohio, and Wisconsin; Region 6: Arkansas, Louisiana, New Mexico, Oklahoma, and Texas; Region 7: Iowa, Kansas, Missouri, and Nebraska; Region 8: Colorado, Montana, North Dakota, and Utah; Region 9: Arizona, California, and Nevada; Region 10: Alaska, Idaho, Oregon, and Washington. † Hawaii, South Dakota, and Wyoming are not included. The figure is a bar chart showing the emergency department visits, by age group and U.S. Department of Health and Human Services region, using data from the National Syndromic Surveillance Program, in the United States, during March 31–April 27, 2019 (comparison period) and March 29–April 25, 2020 (pandemic period). Among all ages, an increase of >100 mean visits per week from the comparison period to the early pandemic period occurred in eight of the top 200 diagnostic categories (Table). These included 1) exposure, encounters, screening, or contact with infectious disease (mean increase 18,834 visits per week); 2) COVID-19 (17,774); 3) other general signs and symptoms (4,532); 4) pneumonia not caused by tuberculosis (3,911); 5) other specified and unspecified lower respiratory disease (1,506); 6) respiratory failure, insufficiency, or arrest (776); 7) cardiac arrest and ventricular fibrillation (472); and 8) socioeconomic or psychosocial factors (354). The largest declines were in visits for abdominal pain and other digestive or abdomen signs and symptoms (–66,456), musculoskeletal pain excluding low back pain (–52,150), essential hypertension (–45,184), nausea and vomiting (–38,536), other specified upper respiratory infections (–36,189), sprains and strains (–33,709), and superficial injuries (–30,918). Visits for nonspecific chest pain were also among the top 20 diagnostic categories for which visits decreased (–24,258). Although not in the top 20 declining diagnoses, visits for acute myocardial infarction also declined (–1,156). TABLE Differences in mean weekly numbers of emergency department (ED) visits* for diagnostic categories with the largest increases or decreases† and prevalence ratios§ comparing the proportion of ED visits in each diagnostic category, for categories with the highest and lowest ratios — National Syndromic Surveillance Program, United States,¶ March 31–April 27, 2019 (comparison period) and March 29–April 25, 2020 (early pandemic period) Diagnostic category Change in mean no. of weekly ED visits* Prevalence ratio (95% CI)§ All categories with higher visit counts during the early pandemic period Exposure, encounters, screening, or contact with infectious disease** 18,834 3.79 (3.76–3.83) COVID-19 17,774 — Other general signs and symptoms** 4,532 1.87 (1.86–1.89) Pneumonia (except that caused by tuberculosis)** 3,911 1.91 (1.90–1.93) Other specified and unspecified lower respiratory disease** 1,506 1.99 (1.96–2.02) Respiratory failure, insufficiency, arrest** 776 1.76 (1.74–1.78) Cardiac arrest and ventricular fibrillation** 472 1.98 (1.93–2.03) Socioeconomic or psychosocial factors** 354 1.78 (1.75–1.81) Other top 10 highest prevalence ratios Mental and substance use disorders, in remission** 6 1.69 (1.64–1.75) Other specified encounters and counseling** 22 1.69 (1.67–1.72) Stimulant-related disorders** −189 1.65 (1.62–1.67) Top 20 categories with lower visit counts during the early pandemic period Abdominal pain and other digestive or abdomen signs and symptoms −66,456 0.93 (0.93–0.93) Musculoskeletal pain, not low back pain −52,150 0.81 (0.81–0.82) Essential hypertension −45,184 1.11 (1.10–1.11) Nausea and vomiting −38,536 0.85 (0.84–0.85) Other specified upper respiratory infections −36,189 0.82 (0.81–0.82) Sprains and strains, initial encounter †† −33,709 0.61 (0.61–0.62) Superficial injury; contusion, initial encounter −30,918 0.85 (0.84–0.85) Personal or family history of disease −28,734 1.21 (1.20–1.22) Headache, including migraine −27,458 0.85 (0.84–0.85) Other unspecified injury −25,974 0.84 (0.83–0.84) Nonspecific chest pain −24,258 1.20 (1.20–1.21) Tobacco-related disorders −23,657 1.19 (1.18–1.19) Urinary tract infections −23,346 1.02 (1.02–1.03) Asthma −20,660 0.91 (0.90–0.91) Disorders of lipid metabolism −20,145 1.12 (1.11–1.13) Spondylopathies/Spondyloarthropathy (including infective) −19,441 0.78 (0.77–0.79) Otitis media †† −17,852 0.35 (0.34–0.36) Diabetes mellitus without complication −15,893 1.10 (1.10–1.11) Skin and subcutaneous tissue infections −15,598 1.01 (1.00–1.02) Chronic obstructive pulmonary disease and bronchiectasis −15,520 1.05 (1.04–1.06) Other top 10 lowest prevalence ratios Influenza †† −12,094 0.16 (0.15–0.16) No immunization or underimmunization †† −1,895 0.28 (0.27–0.30) Neoplasm-related encounters †† −1,926 0.40 (0.39–0.42) Intestinal infection †† −5,310 0.52 (0.51–0.54) Cornea and external disease †† −9,096 0.54 (0.53–0.55) Sinusitis †† −7,283 0.55 (0.54–0.56) Acute bronchitis †† −15,470 0.59 (0.58–0.60) Noninfectious gastroenteritis †† −11,572 0.63 (0.62–0.64) Abbreviations: CI = confidence interval; COVID-19 = coronavirus disease 2019. * The change in visits per week during the early pandemic and comparison periods was calculated as the difference in total visits between the two periods, divided by 4 weeks ([visits in diagnostic category, {early pandemic period} – visits in diagnostic category, {comparison period}] / 4). † Analysis is limited to the 200 most common diagnostic categories. All eight diagnostic categories with an increase of >100 in the mean number of visits nationwide in the early pandemic period are shown. The top 20 categories with decreasing visit counts are shown. § Ratio calculated as the proportion of all ED visits in each diagnostic category during the early pandemic period, divided by the proportion of all ED visits in that category during the comparison period ([visits in category {early pandemic period}/all visits {early pandemic period})/(visits in category {comparison period}/all visits {comparison period}]). Ratios >1 indicate a higher proportion of visits in that category during the early pandemic period than the comparison period; ratios <1 indicate a lower proportion during the early pandemic than during the comparison period. Analysis is limited to the 200 most common diagnostic categories. The 10 categories with the highest and lowest ratios are shown. ¶ Florida, Hawaii, Louisiana, New York outside of New York City, Oklahoma, South Dakota, Wyoming, Santa Cruz and Solano counties in California, and the District of Columbia are not included. ** Top 10 highest prevalence ratios; higher proportion of visits in the early pandemic period than the comparison period. †† Top 10 lowest prevalence ratios; lower proportion of visits in the early pandemic period than the comparison period. During the early pandemic period, the proportion of ED visits for exposure, encounters, screening, or contact with infectious disease compared with total visits was nearly four times as large as during the comparison period (Table) (prevalence ratio [PR] = 3.79, 95% confidence interval [CI] = 3.76–3.83). The other diagnostic categories with the highest proportions of visits during the early pandemic compared with the comparison period were other specified and unspecified lower respiratory disease, which did not include influenza, pneumonia, asthma, or bronchitis (PR = 1.99; 95% CI = 1.96–2.02), cardiac arrest and ventricular fibrillation (PR = 1.98; 95% CI = 1.93–2.03), and pneumonia not caused by tuberculosis (PR = 1.91; 95% CI = 1.90–1.93). Diagnostic categories that were recorded less commonly during the early pandemic period included influenza (PR = 0.16; 95% CI = 0.15–0.16), no immunization or underimmunization (PR = 0.28; 95% CI = 0.27–0.30), otitis media (PR = 0.35; 95% CI = 0.34–0.36), and neoplasm-related encounters (PR = 0.40; 95% CI = 0.39–0.42). In the 2019 comparison period, 12% of all ED visits were in children aged ≤10 years old, compared with 6% during the early pandemic period. Among children aged ≤10 years, the largest declines were in visits for influenza (97% decrease), otitis media (85%), other specified upper respiratory conditions (84%), nausea and vomiting (84%), asthma (84%), viral infection (79%), respiratory signs and symptoms (78%), abdominal pain and other digestive or abdomen symptoms (78%), and fever (72%). Mean weekly visits with confirmed COVID-19 diagnoses and screening for infectious disease during the early pandemic period were lower among children than among adults. Among all ages, the diagnostic categories with the largest changes (abdominal pain and other digestive or abdomen signs and symptoms, musculoskeletal pain, and essential hypertension) were the same in males and females, but declines in those categories were larger in females than males. Females also had large declines in visits for urinary tract infections (–19,833 mean weekly visits). Discussion During an early 4-week interval in the COVID-19 pandemic, ED visits were substantially lower than during the same 4-week period during the previous year; these decreases were especially pronounced for children and females and in the Northeast. In addition to diagnoses associated with lower respiratory disease, pneumonia, and difficulty breathing, the number and ratio of visits (early pandemic period versus comparison period) for cardiac arrest and ventricular fibrillation increased. The number of visits for conditions including nonspecific chest pain and acute myocardial infarction decreased, suggesting that some persons could be delaying care for conditions that might result in additional mortality if left untreated. Some declines were in categories including otitis media, superficial injuries, and sprains and strains that can often be managed through primary or urgent care. Future analyses will help clarify the proportion of the decline in ED visits that were not preventable or avoidable such as those for life-threatening conditions, those that were manageable through primary care, and those that represented actual reductions in injuries or illness attributable to changing activity patterns during the pandemic (such as lower risks for occupational and motor vehicle injuries or other infectious diseases). The striking decline in ED visits nationwide, with the highest declines in regions where the pandemic was most severe in April 2020, suggests that the pandemic has altered the use of the ED by the public. Persons who use the ED as a safety net because they lack access to primary care and telemedicine might be disproportionately affected if they avoid seeking care because of concerns about the infection risk in the ED. Syndromic surveillance has important strengths, including automated electronic reporting and the ability to track outbreaks in real time ( 7 ). Among all visits, 74% are reported within 24 hours, with 75% of discharge diagnoses typically added to the record within 1 week. The findings in this report are subject to at least four limitations. First, hospitals reporting to NSSP change over time as facilities are added, and more rarely, as they close ( 8 ). An average of 3,173 hospitals reported to NSSP nationally in April 2019, representing an estimated 66% of U.S. ED visits, and an average of 3,467 reported in April 2020, representing 73% of ED visits. Second, diagnostic categories rely on the use of specific codes, which were missing in 20% of visits and might be used inconsistently across hospitals and providers, which could result in misclassification. The COVID-19 diagnosis code was introduced recently (April 1, 2020) and timing of uptake might have differed across hospitals ( 6 ). Third, NSSP coverage is not uniform across or within all states; in some states nearly all hospitals report, whereas in others, a lower proportion statewide or only those in certain counties report. Finally, because this analysis is limited to ED visit data, the proportion of persons who did not visit EDs but received treatment elsewhere is not captured. Health care systems should continue to address public concern about exposure to SARS-CoV-2 in the ED through adherence to CDC infection control recommendations, such as immediately screening every person for fever and symptoms of COVID-19, and maintaining separate, well-ventilated triage areas for patients with and without signs and symptoms of COVID-19 ( 9 ). Wider access is needed to health messages that reinforce the importance of immediately seeking care for serious conditions for which ED visits cannot be avoided, such as symptoms of myocardial infarction. Expanded access to triage telephone lines that help persons rapidly decide whether they need to go to an ED for symptoms of possible COVID-19 infection and other urgent conditions is also needed. For conditions that do not require immediate care or in-person treatment, health care systems should continue to expand the use of virtual visits during the pandemic ( 10 ). Summary What is already known about this topic? The National Syndromic Surveillance Program (NSSP) collects electronic health data in real time. What is added by this report? NSSP found that emergency department (ED) visits declined 42% during the early COVID-19 pandemic, from a mean of 2.1 million per week (March 31–April 27, 2019) to 1.2 million (March 29–April 25, 2020), with the steepest decreases in persons aged ≤14 years, females, and the Northeast. The proportion of infectious disease–related visits was four times higher during the early pandemic period. What are the implications for public health practice? To minimize SARS-CoV-2 transmission risk and address public concerns about visiting the ED during the pandemic, CDC recommends continued use of virtual visits and triage help lines and adherence to CDC infection control guidance.
              Bookmark
              • Record: found
              • Abstract: found
              • Article: not found

              Effects of the COVID-19 Pandemic on Routine Pediatric Vaccine Ordering and Administration — United States, 2020

              On March 13, 2020, the president of the United States declared a national emergency in response to the coronavirus disease 2019 (COVID-19) pandemic (1). With reports of laboratory-confirmed cases in all 50 states by that time (2), disruptions were anticipated in the U.S. health care system's ability to continue providing routine preventive and other nonemergency care. In addition, many states and localities issued shelter-in-place or stay-at-home orders to reduce the spread of COVID-19, limiting movement outside the home to essential activities (3). On March 24, CDC posted guidance emphasizing the importance of routine well child care and immunization, particularly for children aged ≤24 months, when many childhood vaccines are recommended.
                Bookmark

                Author and article information

                Journal
                MMWR Morb Mortal Wkly Rep
                MMWR Morb. Mortal. Wkly. Rep
                WR
                Morbidity and Mortality Weekly Report
                Centers for Disease Control and Prevention
                0149-2195
                1545-861X
                11 September 2020
                11 September 2020
                : 69
                : 36
                : 1250-1257
                Affiliations
                Turner Institute for Brain and Mental Health, Monash University, Melbourne, Australia; Austin Health, Melbourne, Australia; CDC COVID-19 Response Team; Johns Hopkins University Bloomberg School of Public Health, Baltimore, Maryland; Brigham and Women’s Hospital, Boston, Massachusetts; Harvard Medical School, Boston, Massachusetts; University of Melbourne, Melbourne, Australia.
                Author notes
                Corresponding author: Kristy Marynak, KMarynak@ 123456cdc.gov .
                Article
                mm6936a4
                10.15585/mmwr.mm6936a4
                7499838
                32915166
                3ade6de6-05b3-427e-a487-6a9beb9085e5

                All material in the MMWR Series is in the public domain and may be used and reprinted without permission; citation as to source, however, is appreciated.

                History
                Categories
                Full Report

                Comments

                Comment on this article