27
views
0
recommends
+1 Recommend
1 collections
    0
    shares
      • Record: found
      • Abstract: found
      • Article: found
      Is Open Access

      Association of Healthy Lifestyle With Years Lived Without Major Chronic Diseases

      research-article
      , PhD 1 , , , PhD 2 , 3 , , MSc 1 , 4 , 5 , , PhD 6 , , PhD 2 , 3 , , PhD 7 , 8 , , MD 6 , , PhD 9 , , PhD 10 , , MD 11 , 12 , , PhD 13 , , PhD 14 , , PhD 15 , , PhD 1 , 16 , , MD 1 , , PhD 17 , , PhD 18 , 19 , , MD 16 , , PhD 20 , , PhD 1 , , PhD 6 , 21 , , MSc 2 , , MD 1 , , PhD 4 , 5 , , PhD 4 , 22 , , MD 4 , 5 , , PhD 23 , 24 , , PhD 18 , , MD 11 , 12 , , PhD 25 , , DSc 2 , 26 , , PhD 1 , 2
      JAMA Internal Medicine
      American Medical Association

      Read this article at

      ScienceOpenPublisherPMC
      Bookmark
          There is no author summary for this article yet. Authors can add summaries to their articles on ScienceOpen to make them more accessible to a non-specialist audience.

          Key Points

          Question

          Are different combinations of lifestyle factors associated with years lived without chronic diseases?

          Findings

          In a multicohort study of 116 043 participants, a statistically significant association between overall healthy lifestyle score and an increased number of disease-free life-years was noted. Of 16 different lifestyle profiles studied, the 4 that were associated with the greatest disease-free life years included body mass index lower than 25 and at least 2 of 3 factors: never smoking, physical activity, and moderate alcohol consumption.

          Meaning

          Various healthy lifestyle profiles appear to be associated with extended gains in life lived without type 2 diabetes, cardiovascular and respiratory diseases, and cancer.

          Abstract

          Importance

          It is well established that selected lifestyle factors are individually associated with lower risk of chronic diseases, but how combinations of these factors are associated with disease-free life-years is unknown.

          Objective

          To estimate the association between healthy lifestyle and the number of disease-free life-years.

          Design, Setting, and Participants

          A prospective multicohort study, including 12 European studies as part of the Individual-Participant-Data Meta-analysis in Working Populations Consortium, was performed. Participants included 116 043 people free of major noncommunicable disease at baseline from August 7, 1991, to May 31, 2006. Data analysis was conducted from May 22, 2018, to January 21, 2020.

          Exposures

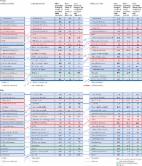
          Four baseline lifestyle factors (smoking, body mass index, physical activity, and alcohol consumption) were each allocated a score based on risk status: optimal (2 points), intermediate (1 point), or poor (0 points) resulting in an aggregated lifestyle score ranging from 0 (worst) to 8 (best). Sixteen lifestyle profiles were constructed from combinations of these risk factors.

          Main Outcomes and Measures

          The number of years between ages 40 and 75 years without chronic disease, including type 2 diabetes, coronary heart disease, stroke, cancer, asthma, and chronic obstructive pulmonary disease.

          Results

          Of the 116 043 people included in the analysis, the mean (SD) age was 43.7 (10.1) years and 70 911 were women (61.1%). During 1.45 million person-years at risk (mean follow-up, 12.5 years; range, 4.9-18.6 years), 17 383 participants developed at least 1 chronic disease. There was a linear association between overall healthy lifestyle score and the number of disease-free years, such that a 1-point improvement in the score was associated with an increase of 0.96 (95% CI, 0.83-1.08) disease-free years in men and 0.89 (95% CI, 0.75-1.02) years in women. Comparing the best lifestyle score with the worst lifestyle score was associated with 9.9 (95% CI 6.7-13.1) additional years without chronic diseases in men and 9.4 (95% CI 5.4-13.3) additional years in women ( P < .001 for dose-response). All of the 4 lifestyle profiles that were associated with the highest number of disease-free years included a body-mass index less than 25 (calculated as weight in kilograms divided by height in meters squared) and at least 2 of the following factors: never smoking, physical activity, and moderate alcohol consumption. Participants with 1 of these lifestyle profiles reached age 70.3 (95% CI, 69.9-70.8) to 71.4 (95% CI, 70.9-72.0) years disease free depending on the profile and sex.

          Conclusions and Relevance

          In this multicohort analysis, various healthy lifestyle profiles appeared to be associated with gains in life-years without major chronic diseases.

          Abstract

          This cohort study examines disease-free life-years in participants with varying combinations of lifestyle risk factors.

          Related collections

          Most cited references35

          • Record: found
          • Abstract: found
          • Article: found
          Is Open Access

          Global, regional, and national incidence, prevalence, and years lived with disability for 354 diseases and injuries for 195 countries and territories, 1990–2017: a systematic analysis for the Global Burden of Disease Study 2017

          Summary Background The Global Burden of Diseases, Injuries, and Risk Factors Study 2017 (GBD 2017) includes a comprehensive assessment of incidence, prevalence, and years lived with disability (YLDs) for 354 causes in 195 countries and territories from 1990 to 2017. Previous GBD studies have shown how the decline of mortality rates from 1990 to 2016 has led to an increase in life expectancy, an ageing global population, and an expansion of the non-fatal burden of disease and injury. These studies have also shown how a substantial portion of the world's population experiences non-fatal health loss with considerable heterogeneity among different causes, locations, ages, and sexes. Ongoing objectives of the GBD study include increasing the level of estimation detail, improving analytical strategies, and increasing the amount of high-quality data. Methods We estimated incidence and prevalence for 354 diseases and injuries and 3484 sequelae. We used an updated and extensive body of literature studies, survey data, surveillance data, inpatient admission records, outpatient visit records, and health insurance claims, and additionally used results from cause of death models to inform estimates using a total of 68 781 data sources. Newly available clinical data from India, Iran, Japan, Jordan, Nepal, China, Brazil, Norway, and Italy were incorporated, as well as updated claims data from the USA and new claims data from Taiwan (province of China) and Singapore. We used DisMod-MR 2.1, a Bayesian meta-regression tool, as the main method of estimation, ensuring consistency between rates of incidence, prevalence, remission, and cause of death for each condition. YLDs were estimated as the product of a prevalence estimate and a disability weight for health states of each mutually exclusive sequela, adjusted for comorbidity. We updated the Socio-demographic Index (SDI), a summary development indicator of income per capita, years of schooling, and total fertility rate. Additionally, we calculated differences between male and female YLDs to identify divergent trends across sexes. GBD 2017 complies with the Guidelines for Accurate and Transparent Health Estimates Reporting. Findings Globally, for females, the causes with the greatest age-standardised prevalence were oral disorders, headache disorders, and haemoglobinopathies and haemolytic anaemias in both 1990 and 2017. For males, the causes with the greatest age-standardised prevalence were oral disorders, headache disorders, and tuberculosis including latent tuberculosis infection in both 1990 and 2017. In terms of YLDs, low back pain, headache disorders, and dietary iron deficiency were the leading Level 3 causes of YLD counts in 1990, whereas low back pain, headache disorders, and depressive disorders were the leading causes in 2017 for both sexes combined. All-cause age-standardised YLD rates decreased by 3·9% (95% uncertainty interval [UI] 3·1–4·6) from 1990 to 2017; however, the all-age YLD rate increased by 7·2% (6·0–8·4) while the total sum of global YLDs increased from 562 million (421–723) to 853 million (642–1100). The increases for males and females were similar, with increases in all-age YLD rates of 7·9% (6·6–9·2) for males and 6·5% (5·4–7·7) for females. We found significant differences between males and females in terms of age-standardised prevalence estimates for multiple causes. The causes with the greatest relative differences between sexes in 2017 included substance use disorders (3018 cases [95% UI 2782–3252] per 100 000 in males vs s1400 [1279–1524] per 100 000 in females), transport injuries (3322 [3082–3583] vs 2336 [2154–2535]), and self-harm and interpersonal violence (3265 [2943–3630] vs 5643 [5057–6302]). Interpretation Global all-cause age-standardised YLD rates have improved only slightly over a period spanning nearly three decades. However, the magnitude of the non-fatal disease burden has expanded globally, with increasing numbers of people who have a wide spectrum of conditions. A subset of conditions has remained globally pervasive since 1990, whereas other conditions have displayed more dynamic trends, with different ages, sexes, and geographies across the globe experiencing varying burdens and trends of health loss. This study emphasises how global improvements in premature mortality for select conditions have led to older populations with complex and potentially expensive diseases, yet also highlights global achievements in certain domains of disease and injury. Funding Bill & Melinda Gates Foundation.
            Bookmark
            • Record: found
            • Abstract: found
            • Article: found
            Is Open Access

            Global, regional, and national age-sex-specific mortality for 282 causes of death in 195 countries and territories, 1980–2017: a systematic analysis for the Global Burden of Disease Study 2017

            Summary Background Global development goals increasingly rely on country-specific estimates for benchmarking a nation's progress. To meet this need, the Global Burden of Diseases, Injuries, and Risk Factors Study (GBD) 2016 estimated global, regional, national, and, for selected locations, subnational cause-specific mortality beginning in the year 1980. Here we report an update to that study, making use of newly available data and improved methods. GBD 2017 provides a comprehensive assessment of cause-specific mortality for 282 causes in 195 countries and territories from 1980 to 2017. Methods The causes of death database is composed of vital registration (VR), verbal autopsy (VA), registry, survey, police, and surveillance data. GBD 2017 added ten VA studies, 127 country-years of VR data, 502 cancer-registry country-years, and an additional surveillance country-year. Expansions of the GBD cause of death hierarchy resulted in 18 additional causes estimated for GBD 2017. Newly available data led to subnational estimates for five additional countries—Ethiopia, Iran, New Zealand, Norway, and Russia. Deaths assigned International Classification of Diseases (ICD) codes for non-specific, implausible, or intermediate causes of death were reassigned to underlying causes by redistribution algorithms that were incorporated into uncertainty estimation. We used statistical modelling tools developed for GBD, including the Cause of Death Ensemble model (CODEm), to generate cause fractions and cause-specific death rates for each location, year, age, and sex. Instead of using UN estimates as in previous versions, GBD 2017 independently estimated population size and fertility rate for all locations. Years of life lost (YLLs) were then calculated as the sum of each death multiplied by the standard life expectancy at each age. All rates reported here are age-standardised. Findings At the broadest grouping of causes of death (Level 1), non-communicable diseases (NCDs) comprised the greatest fraction of deaths, contributing to 73·4% (95% uncertainty interval [UI] 72·5–74·1) of total deaths in 2017, while communicable, maternal, neonatal, and nutritional (CMNN) causes accounted for 18·6% (17·9–19·6), and injuries 8·0% (7·7–8·2). Total numbers of deaths from NCD causes increased from 2007 to 2017 by 22·7% (21·5–23·9), representing an additional 7·61 million (7·20–8·01) deaths estimated in 2017 versus 2007. The death rate from NCDs decreased globally by 7·9% (7·0–8·8). The number of deaths for CMNN causes decreased by 22·2% (20·0–24·0) and the death rate by 31·8% (30·1–33·3). Total deaths from injuries increased by 2·3% (0·5–4·0) between 2007 and 2017, and the death rate from injuries decreased by 13·7% (12·2–15·1) to 57·9 deaths (55·9–59·2) per 100 000 in 2017. Deaths from substance use disorders also increased, rising from 284 000 deaths (268 000–289 000) globally in 2007 to 352 000 (334 000–363 000) in 2017. Between 2007 and 2017, total deaths from conflict and terrorism increased by 118·0% (88·8–148·6). A greater reduction in total deaths and death rates was observed for some CMNN causes among children younger than 5 years than for older adults, such as a 36·4% (32·2–40·6) reduction in deaths from lower respiratory infections for children younger than 5 years compared with a 33·6% (31·2–36·1) increase in adults older than 70 years. Globally, the number of deaths was greater for men than for women at most ages in 2017, except at ages older than 85 years. Trends in global YLLs reflect an epidemiological transition, with decreases in total YLLs from enteric infections, respiratory infections and tuberculosis, and maternal and neonatal disorders between 1990 and 2017; these were generally greater in magnitude at the lowest levels of the Socio-demographic Index (SDI). At the same time, there were large increases in YLLs from neoplasms and cardiovascular diseases. YLL rates decreased across the five leading Level 2 causes in all SDI quintiles. The leading causes of YLLs in 1990—neonatal disorders, lower respiratory infections, and diarrhoeal diseases—were ranked second, fourth, and fifth, in 2017. Meanwhile, estimated YLLs increased for ischaemic heart disease (ranked first in 2017) and stroke (ranked third), even though YLL rates decreased. Population growth contributed to increased total deaths across the 20 leading Level 2 causes of mortality between 2007 and 2017. Decreases in the cause-specific mortality rate reduced the effect of population growth for all but three causes: substance use disorders, neurological disorders, and skin and subcutaneous diseases. Interpretation Improvements in global health have been unevenly distributed among populations. Deaths due to injuries, substance use disorders, armed conflict and terrorism, neoplasms, and cardiovascular disease are expanding threats to global health. For causes of death such as lower respiratory and enteric infections, more rapid progress occurred for children than for the oldest adults, and there is continuing disparity in mortality rates by sex across age groups. Reductions in the death rate of some common diseases are themselves slowing or have ceased, primarily for NCDs, and the death rate for selected causes has increased in the past decade. Funding Bill & Melinda Gates Foundation.
              Bookmark
              • Record: found
              • Abstract: found
              • Article: not found

              General cardiovascular risk profile for use in primary care: the Framingham Heart Study.

              Separate multivariable risk algorithms are commonly used to assess risk of specific atherosclerotic cardiovascular disease (CVD) events, ie, coronary heart disease, cerebrovascular disease, peripheral vascular disease, and heart failure. The present report presents a single multivariable risk function that predicts risk of developing all CVD and of its constituents. We used Cox proportional-hazards regression to evaluate the risk of developing a first CVD event in 8491 Framingham study participants (mean age, 49 years; 4522 women) who attended a routine examination between 30 and 74 years of age and were free of CVD. Sex-specific multivariable risk functions ("general CVD" algorithms) were derived that incorporated age, total and high-density lipoprotein cholesterol, systolic blood pressure, treatment for hypertension, smoking, and diabetes status. We assessed the performance of the general CVD algorithms for predicting individual CVD events (coronary heart disease, stroke, peripheral artery disease, or heart failure). Over 12 years of follow-up, 1174 participants (456 women) developed a first CVD event. All traditional risk factors evaluated predicted CVD risk (multivariable-adjusted P<0.0001). The general CVD algorithm demonstrated good discrimination (C statistic, 0.763 [men] and 0.793 [women]) and calibration. Simple adjustments to the general CVD risk algorithms allowed estimation of the risks of each CVD component. Two simple risk scores are presented, 1 based on all traditional risk factors and the other based on non-laboratory-based predictors. A sex-specific multivariable risk factor algorithm can be conveniently used to assess general CVD risk and risk of individual CVD events (coronary, cerebrovascular, and peripheral arterial disease and heart failure). The estimated absolute CVD event rates can be used to quantify risk and to guide preventive care.
                Bookmark

                Author and article information

                Journal
                JAMA Intern Med
                JAMA Intern Med
                JAMA Intern Med
                JAMA Internal Medicine
                American Medical Association
                2168-6106
                2168-6114
                May 2020
                6 April 2020
                6 April 2020
                : 180
                : 5
                : 1-10
                Affiliations
                [1 ]Clinicum, Department of Public Health, Faculty of Medicine, University of Helsinki, Helsinki, Finland
                [2 ]Department of Epidemiology and Public Health, University College London, London, United Kingdom
                [3 ]Inserm U1153, Epidemiology of Ageing and Neurodegenrative Diseases, Paris, France
                [4 ]Department of Public Health, University of Turku, Turku University Hospital, Turku, Finland
                [5 ]Centre for Population Health Research, University of Turku, Turku University Hospital, Turku, Finland
                [6 ]National Research Centre for the Working Environment, Copenhagen, Denmark
                [7 ]Institute of Environmental Medicine, Karolinska Institutet, Stockholm, Sweden
                [8 ]Centre for Occupational and Environmental Medicine, Stockholm County Council, Stockholm, Sweden
                [9 ]Bispebjerg University Hospital, Copenhagen, Denmark
                [10 ]Federal Institute for Occupational Safety and Health, Berlin, Germany
                [11 ]Faculty of Medicine, Paris Descartes University, Paris, France
                [12 ]Inserm UMS 011, Population-Based Epidemiological Cohorts Unit, Villejuif, France
                [13 ]Department of Health Services Research and Policy, London School of Hygiene and Tropical Medicine, London, United Kingdom
                [14 ]Department of Psychology and Logopedics, Faculty of Medicine, University of Helsinki, Helsinki, Finland
                [15 ]Department of Health Sciences, Mid Sweden University, Sundsvall, Sweden
                [16 ]Finnish Institute of Occupational Health, Helsinki, Finland
                [17 ]AS3 Employment, AS3 Companies, Viby J, Denmark
                [18 ]Stress Research Institute, Stockholm University, Stockholm, Sweden
                [19 ]Department of Psychology, Umeå University, Umeå, Sweden
                [20 ]VIVE–The Danish Center for Social Science Research, Copenhagen, Denmark
                [21 ]Department of Public Health and Department of Psychology, University of Copenhagen, Copenhagen, Denmark
                [22 ]University of Skövde, School of Health and Education, Skövde, Sweden
                [23 ]School of Educational Sciences and Psychology, University of Eastern Finland, Joensuu, Finland
                [24 ]Department of Clinical Neuroscience, Karolinska Institutet, Stockholm, Sweden
                [25 ]Division of Surgery & Interventional Science, Faculty of Medical Sciences, University College London, London, United Kingdom
                [26 ]School of Biological and Population Health Sciences, Oregon State University, Corvallis, Oregon
                Author notes
                Article Information
                Accepted for Publication: February 12, 2020.
                Published Online: April 6, 2020. doi:10.1001/jamainternmed.2020.0618
                Open Access: This is an open access article distributed under the terms of the CC-BY License. © 2020 Nyberg ST et al. JAMA Internal Medicine.
                Corresponding Author: Solja T. Nyberg, PhD, University of Helsinki, PL 20, 00014 Helsingin yliopisto, Finland ( solja.nyberg@ 123456helsinki.fi ).
                Author Contributions: Dr Nyberg had full access to data from Finnish Public Sector; Health and Social Support; Helsinki Health Study; Électricité de France-Gaz de France Employees; Whitehall II; Work, Lipids, and Fibrinogen Norrland; and Work, Lipids, and Fibrinogen Norrland cohort studies and Dr Madsen had full access to data from the Copenhagen Psychosocial Questionnaire II, Danish Work Environment Cohort Study 2000 and 2005, Intervention Project on Absence and Well-being, and Burnout, Motivation, and Job Satisfaction studies and they take responsibility for the integrity of the data and the accuracy of the data analysis.
                Concept and design: Nyberg, Alfredsson, Borritz, Jokela, Nordin, Rugulies, Sipilä, Virtanen, Kivimäki.
                Acquisition, analysis, or interpretation of data: Nyberg, Singh-Manoux, Pentti, Madsen, Sabia, Alfredsson, Bjorner, Borritz, Burr, Goldberg, Heikkila, Knutsson, Lallukka, Lindbohm, Nielsen, Oksanen, Pejtersen, Rahkonen, Rugulies, Shipley, Sipilä, Stenholm, Suominen, Vahtera, Westerlund, Zins, Hamer, Batty, Kivimäki.
                Drafting of the manuscript: Nyberg, Kivimäki.
                Critical revision of the manuscript for important intellectual content: All authors.
                Statistical analysis: Nyberg, Pentti, Madsen, Goldberg, Heikkila, Lindbohm, Shipley.
                Obtained funding: Alfredsson, Westerlund, Kivimäki.
                Administrative, technical, or material support: Singh-Manoux, Jokela, Knutsson, Lallukka, Nordin, Pejtersen, Rahkonen, Shipley.
                Supervision: Kivimäki.
                Conflict of Interest Disclosures: Dr Nyberg reported receiving grants from NordForsk during the conduct of the study. Dr Sabia reported receiving grants from the National Institute of Ageing and grants from French Agence Nationale de la Recherche outside the submitted work. Dr Alfredsson reported receiving grants from the Swedish Research Council for Health, Working Life and Welfare during the conduct of the study; and grants from the Swedish Research Council for Health, Working Life and Welfare, the Swedish Brain Foundation, and AstraZenica outside the submitted work. Dr Lallukka reported receiving grants from the Academy of Finland during the conduct of the study and personal fees from LähiTapiola Insurance Company outside the submitted work. Dr Lindbohm reported receiving grants from the Academy of Finland (nonprofit government organization) during the conduct of the study. Dr Sipilä reported receiving grants from the Helsinki Institute of Life Science during the conduct of the study and grants from the Finnish Foundation for Alcohol Studies outside the submitted work. Dr Stenholm reported receiving grants from the Academy of Finland during the conduct of the study. Dr Westerlund reported receiving grants from the Swedish Research Council (Vetenskapsrådet) during the conduct of the study. Dr Kivimäki reported receiving grants from NordForsk, the UK Medical Research Council, the US National Institute on Aging, the Academy of Finland, and Helsinki Institute of Life Science during the conduct of the study. No other disclosures were reported.
                Funding/Support: The Individual-Participant-Data Meta-analysis in Working Populations Consortium (principal investigator, Dr Kivimäki) has received funding from NordForsk (grant 70521, the Nordic Research Programme on Health and Welfare), the UK Medical Research Council (grant MRC S011676), the US National Institute on Aging (NIA) (grant, R01AG056477), the Academy of Finland (grant 311492), and Helsinki Institute of Life Science. Dr Nyberg was supported by NordForsk, Ms Pentti and Dr Lindbohm were supported by the Academy of Finland (grant 311492), Dr Lallukka was supported by the Academy of Finland (grant 319200), Drs Sabia and Singh-Manoux was supported by the NIA (grants R01AG056477 and R01AG034454), Dr Sipilä was supported by the Helsinki Institute of Life Science and the Finnish Foundation for Alcohol Studies, Dr Stenholm was supported by the Academy of Finland (grants 286294, 294154, and 319246), and Dr Batty was supported by the Medical Research Council (grant MR/P023444/1) and NIA (grant 1R56AG052519-01). Dr Kivimäki reported receiving grants from NordForsk, the UK Medical Research Council, the US National Institute on Aging, the Academy of Finland, and Helsinki Institute of Life Science during the conduct of the study.
                Role of the Funder/Sponsor: The funding sources had no role in the design and conduct of the study; collection, management, analysis, and interpretation of the data; preparation, review, or approval of the manuscript; and decision to submit the manuscript for publication.
                Article
                ioi200017
                10.1001/jamainternmed.2020.0618
                7136858
                32250383
                ac36d177-1be5-47a6-adcc-dcf08309f60c
                Copyright 2020 Nyberg ST et al. JAMA Internal Medicine.

                This is an open access article distributed under the terms of the CC-BY License.

                History
                : 22 November 2019
                : 12 February 2020
                Categories
                Research
                Research
                Original Investigation
                Online First

                Comments

                Comment on this article

                scite_

                Similar content310

                Cited by94

                Most referenced authors5,309