13
views
0
recommends
+1 Recommend
2 collections
    0
    shares
      • Record: found
      • Abstract: found
      • Article: found
      Is Open Access

      Health Center Testing for SARS-CoV-2 During the COVID-19 Pandemic — United States, June 5–October 2, 2020

      research-article

      Read this article at

      Bookmark
          There is no author summary for this article yet. Authors can add summaries to their articles on ScienceOpen to make them more accessible to a non-specialist audience.

          Abstract

          Long-standing social inequities and health disparities have resulted in increased risk for coronavirus disease 2019 (COVID-19) infection, severe illness, and death among racial and ethnic minority populations. The Health Resources and Services Administration (HRSA) Health Center Program supports nearly 1,400 health centers that provide comprehensive primary health care* to approximately 30 million patients in 13,000 service sites across the United States. † In 2019, 63% of HRSA health center patients who reported race and ethnicity identified as members of racial ethnic minority populations ( 1 ). Historically underserved communities and populations served by health centers have a need for access to important information and resources for preventing exposure to SARS-CoV-2, the virus that causes COVID-19, to testing for those at risk, and to follow-up services for those with positive test results. § During the COVID-19 public health emergency, health centers ¶ have provided and continue to provide testing and follow-up care to medically underserved populations**; these centers are capable of reaching areas disproportionately affected by the pandemic. †† HRSA administers a weekly, voluntary Health Center COVID-19 Survey §§ to track health center COVID-19 testing capacity and the impact of COVID-19 on operations, patients, and personnel. Potential respondents can include up to 1,382 HRSA-funded health centers. ¶¶ To assess health centers’ capacity to reach racial and ethnic minority groups at increased risk for COVID-19 and to provide access to testing, CDC and HRSA analyzed survey data for the weeks June 5–October 2, 2020*** to describe all patients tested (3,194,838) and those who received positive SARS-CoV-2 test results (308,780) by race/ethnicity and state of residence. Among persons with known race/ethnicity who received testing (2,506,935), 36% were Hispanic/Latino (Hispanic), 38% were non-Hispanic White (White), and 20% were non-Hispanic Black (Black); among those with known race/ethnicity with positive test results, 56% were Hispanic, 24% were White, and 15% were Black. Improving health centers’ ability to reach groups at increased risk for COVID-19 might reduce transmission by identifying cases and supporting contact tracing and isolation. Efforts to improve coordination of COVID-19 response-related activities between state and local public health departments and HRSA-funded health centers can increase access to testing and follow-up care for populations at increased risk for COVID-19. HRSA administers a weekly voluntary Health Center COVID-19 Survey to track health center COVID-19 testing capacity and the impact of COVID-19 on operations, patients, and staff members. The 1,382 health centers asked to complete the survey are located in all 50 states, the District of Columbia (DC), and five territories and freely associated states. ††† This analysis used survey data from the weeks ending June 5–October 2, 2020, to describe the patient population and, among all patients who received testing for SARS-CoV-2 with viral tests (i.e., polymerase chain reaction and antigen tests), the numbers and proportions of persons with tests and positive results by race/ethnicity and state of residence. State survey response rates ranged from 68% to 80% among health centers. Proportions of patients receiving SARS-CoV-2 tests and positive test results included unreported race/ethnicity as a separate category. 
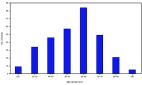
As reported in the HRSA Uniform Data System in 2019, HRSA-funded health centers reported that 35% of their national patient population was White, 35% Hispanic, §§§ 18% Black, 4% Asian, 1% American Indian/Alaska Native (AI/AN), 1% Native Hawaiian/Other Pacific Islander, and 1.3% multiracial persons; race/ethnicity was not reported for 6% of the patient population (Figure) ( 1 ). By comparison, the 2019 American Community Survey ¶¶¶ estimated that the U.S. population comprises 60% White, 18% Hispanic, 12% Black, 6% Asian, 1% AI/AN, 0.2% Native Hawaiian/Other Pacific Islander, and 3% multiracial persons. FIGURE Racial/ethnic distribution of 2019 national* and Health Resources and Services Administration (HRSA)–funded health center † patient populations § and persons who received testing and had positive SARS-CoV-2 test results ¶ — Health Center COVID-19 Survey, United States, June 5–October 2, 2020 Abbreviations: AI/AN = American Indian/Alaska Native; COVID-19 = coronavirus disease 2019; HC = health center; NH/PI = Native Hawaiian/Other Pacific Islander; NH = non-Hispanic. * Data from the 2019 American Community Survey (https://data.census.gov/cedsci/table?d=ACS%201-Year%20Estimates%20Data%20Profiles&tid=ACSDP1Y2019. DP05&hidePreview=false). Data include non-Hispanic NH/PI (0.2%), not visible in figure and do not include other race (0.3%). Persons with multiracial or unreported race/ethnicity have an unreported or non-Hispanic ethnicity. † HRSA–funded health centers include both Federally Qualified Health Centers (FQHCs) and Health Center Program Look-Alikes (i.e, meets all Health Care Center Program requirements but does not receive federal funding). During the COVID-19 pandemic, HRSA provided one-time COVID-19 funding to FQHCs and Health Center Look-Alikes to purchase, administer, and expand capacity for testing to monitor and suppress COVID-19 testing and response-related activities. § HRSA 2019 Uniform Data System. https://data.hrsa.gov/tools/data-reporting/program-data/national. ¶ HRSA COVID-19 Survey, June 5–October 2, 2020. Data for the number tested or the number tested positive are aggregated by health centers before submission and cannot be deduplicated, which might inflate or misrepresent the number of patients tested or who had positive test results. The figure is a bar graph showing the racial/ethnic distribution of U.S. 2019 national and Health Resources and Services Administration–funded health center patient populations and persons who received testing and had positive SARS-CoV-2 test results during June 5–October 2, 2020, based on data from the Health Center COVID-19 Survey. During June 5–October 2, 2020, health centers responding to the survey reported that 3,194,838 patients received testing and 308,780 had positive SARS-CoV-2 test results. Compared to other jurisdictions, Texas reported the highest number of patients who received testing (353,081; 11%), and California reported the highest number of patients who had positive test results (46,113; 15%). Based on data reported to the Health Center COVID-19 Survey, White and Hispanic patients each accounted for 29% of patients who received testing for SARS-CoV-2 (Table 1) and, among patients who received positive test results, 19% were White and 45% were Hispanic (Table 2). Overall, race was not reported for 22% (687,903) of patients tested and 19% of patients with positive test results (57,208); 1% (26,386) of patients receiving testing and 1% (2,378) of patients with positive test results were multiracial. In Puerto Rico, 96% of patients receiving testing were Hispanic; among other jurisdictions, the highest proportions of patients receiving testing who were Hispanic were in Nevada (9,990; 56%) and New Mexico (11,705; 56%). Compared with all other jurisdictions, California reported the most Hispanic patients who received testing (186,034) and the most positive test results among Hispanic patients (33,310; 18%). Among those with positive test results, Puerto Rico reported the largest proportion of Hispanic patients (2,095; 98%) and New Mexico the second highest proportion (531; 73%). Nationally, Black patients accounted for 15% of patients receiving testing and 12% of those who received positive test results. Mississippi reported the highest proportion of patients who received testing who were Black (25,850; 67%) and the highest proportion of those who had positive test results who were Black (2,348; 69%). Georgia reported the largest number of tests conducted (42,889; 43%) and positive test results (4,204; 32%) among Black patients. TABLE 1 Viral testing for SARS-CoV-2,* by race/ethnicity and jurisdiction † — Health Center COVID-19 Survey, United States, June 5–October 2, 2020 Jurisdiction No.§ of FQHCs¶ Response range** (%) Total no. patients tested†† Race/Ethnicity, no. tested (row %) Hispanic/Latino White, NH Black, NH Asian, NH AI/AN, NH NH/PI, NH Multiracial Unreported United States 1,382–1,376 68–80 3,194,838 913,718 (29) 941,017 (29) 491,311 (15) 77,528 (2) 36,837 (1) 5,161 (—) 26,386 (1) 687,903 (22) Alabama 17 59–94 46,146 3,393 (7) 16,089 (35) 21,262 (46) 183 (—) 139 (—) 4 (—) 241 (1) 4,800 (10) Alaska 27 44–74 57,147 1,788 (3) 11,510 (20) 528 (1) 967 (2) 20,785 (36) 83 (—) 362 (1) 21,080 (37) American Samoa 1 0–100 1,567 104 (7) 46 (3) 0 (—) 55 (4) 12 (1) 0 (—) 2 (—) 8 (1) Arizona 23 65–83 53,455 27,220 (51) 15,584 (29) 1,509 (3) 335 (1) 1,741 (3) 50 (—) 392 (1) 6,573 (12) Arkansas 12 50–100 51,488 7,855 (15) 24,988 (49) 13,061 (25) 243 (—) 152 (—) 21 (—) 189 (—) 4,169 (8) California 175–178 59–74 336,454 186,034 (55) 51,114 (15) 26,371 (8) 20,103 (6) 949 (—) 634 (—) 4,891 (1) 45,217 (13) Colorado 19 68–95 59,401 24,702 (42) 19,064 (32) 5,165 (9) 1,166 (2) 324 (1) 31 (—) 791 (1) 8,123 (14) Connecticut 16 56–94 83,507 27,872 (33) 15,803 (19) 8,258 (10) 1,190 (1) 218 (—) 20 (—) 349 (—) 29,613 (35) Delaware 3 33–100 2,356 894 (38) 466 (20) 850 (36) 31 (1) 9 (—) 4 (—) 14 (1) 88 (4) District of Columbia 8 63–100 18,438 5,632 (31) 1,628 (9) 8,554 (46) 274 (1) 30 (—) 2 (—) 89 (—) 2,215 (12) Federated States of Micronesia 4 25–100 198 0 (—) 0 (—) 0 (—) 54 (27) 0 (—) 0 (—) 0 (—) 0 (—) Florida 47 62–87 257,119 97,542 (38) 51,704 (20) 38,483 (15) 1,868 (1) 189 (—) 44 (—) 2,431 (1) 64,665 (25) Georgia 35 60–91 100,909 15,410 (15) 32,664 (32) 42,889 (43) 1,119 (1) 67 (—) 11 (—) 862 (1) 7,861 (8) Guam 1 0–100 8,574 31 (—) 199 (2) 38 (—) 2,572 (30) 9 (—) 4 (—) 432 (5) 268 (3) Hawaii 14 36–86 8,894 850 (10) 911 (10) 91 (1) 1,325 (15) 13 (—) 2,833 (32) 286 (3) 1,081 (12) Idaho 14 71–100 12,111 3,014 (25) 6,281 (52) 168 (1) 100 (1) 1,028 (8) 25 (—) 26 (—) 1,460 (12) Illinois 45 64–82 162,663 51,534 (32) 37,781 (23) 22,276 (14) 3,097 (2) 217 (—) 44 (—) 676 (—) 46,966 (29) Indiana 27 48–78 20,639 6,031 (29) 5,570 (27) 2,035 (10) 967 (5) 34 (—) 3 (—) 112 (1) 5,876 (28) Iowa 14 64–93 30,891 5,292 (17) 14,786 (48) 1,511 (5) 447 (1) 222 (1) 16 (—) 235 (1) 8,357 (27) Kansas 19 53–100 25,472 6,582 (26) 13,631 (54) 1,972 (8) 326 (1) 336 (1) 93 (—) 212 (1) 2,264 (9) Kentucky 25 76–96 64,494 3,453 (5) 51,839 (80) 4,141 (6) 446 (1) 36 (—) 15 (—) 506 (1) 4,017 (6) Louisiana 36 61–81 48,007 5,297 (11) 16,396 (34) 21,333 (44) 487 (1) 143 (—) 39 (—) 323 (1) 3,968 (8) Maine 18 50–89 9,049 600 (7) 6,614 (73) 515 (6) 40 (—) 40 (—) 7 (—) 43 (—) 1,189 (13) Marshall Islands 1 0–100 121 0 (—) 0 (—) 0 (—) 1 (1) 0 (—) 0 (—) 0 (—) 0 (—) Maryland 17 47–82 8,898 2,696 (30) 1,824 (20) 2,629 (30) 117 (1) 248 (3) 3 (—) 135 (2) 1,242 (14) Massachusetts 37–38 59–89 153,411 51,639 (34) 52,813 (34) 16,444 (11) 5,326 (3) 181 (—) 61 (—) 817 (1) 25,712 (17) Michigan 39 51–79 99,960 12,870 (13) 53,804 (54) 13,622 (14) 1,799 (2) 305 (—) 46 (—) 1,040 (1) 16,412 (16) Minnesota 16 56–81 16,645 2,828 (17) 5,093 (31) 3,627 (22) 1,178 (7) 794 (5) 5 (—) 32 (—) 3,077 (18) Mississippi 20 65–95 38,843 3,411 (9) 8,300 (21) 25,850 (67) 218 (1) 59 (—) 9 (—) 326 (1) 605 (2) Missouri 28–29 66–90 78,075 7,414 (9) 36,275 (46) 16,802 (22) 677 (1) 207 (—) 57 (—) 567 (1) 15,895 (20) Montana 14 43–86 18,377 368 (2) 7,522 (41) 31 (—) 18 (—) 441 (2) 7 (—) 60 (—) 9,928 (54) Nebraska 7 57–86 9,224 3,585 (39) 2,167 (23) 2,008 (22) 896 (10) 40 (—) 6 (—) 97 (1) 422 (5) Nevada 8 38–88 17,827 9,990 (56) 4,102 (23) 938 (5) 1,145 (6) 47 (—) 157 (1) 94 (1) 1,322 (7) New Hampshire 10 70–100 3,535 936 (26) 2,140 (61) 88 (2) 80 (2) 6 (—) 3 (—) 10 (—) 272 (8) New Jersey 23–24 33–67 51,393 26,433 (51) 9,698 (19) 7,173 (14) 603 (1) 62 (—) 43 (—) 398 (1) 6,887 (13) New Mexico 16 75–100 20,857 11,705 (56) 4,115 (20) 295 (1) 98 (—) 1,427 (7) 12 (—) 208 (1) 2,985 (14) New York 63 48–67 204,075 31,877 (16) 32,798 (16) 24,734 (12) 5,972 (3) 194 (—) 30 (—) 1,606 (1) 106,749 (52) North Carolina 39 46–69 65,685 14,505 (22) 18,118 (28) 22,130 (34) 661 (1) 524 (1) 66 (—) 334 (1) 9,326 (14) North Dakota 4 75–100 5,003 199 (4) 2,425 (48) 385 (8) 170 (3) 300 (6) 9 (—) 35 (1) 1,476 (30) Northern Mariana Islands 1 0–100 0 0 (—) 0 (—) 0 (—) 0 (—) 0 (—) 0 (—) 0 (—) 0 (—) Ohio 51 67–82 72,400 7,604 (11) 37,561 (52) 13,461 (19) 1,216 (2) 443 (1) 39 (—) 550 (1) 11,418 (16) Oklahoma 21 52–95 13,147 2,833 (22) 5,284 (40) 1,151 (9) 86 (1) 480 (4) 16 (—) 145 (1) 3,117 (24) Oregon 30 73–90 17,782 6,771 (38) 7,471 (42) 474 (3) 400 (2) 686 (4) 40 (—) 145 (1) 1,697 (10) Palau 1 0–100 1,612 0 (—) 254 (16) 4 (—) 334 (21) 0 (—) 0 (—) 0 (—) 0 (—) Pennsylvania 43 67–91 54,143 9,563 (18) 22,464 (41) 13,911 (26) 2,549 (5) 118 (—) 13 (—) 651 (1) 4,745 (9) Puerto Rico 21–22 73–91 28,909 27,709 (96) 134 (—) 5 (—) 0 (—) 3 (—) 0 (—) 260 (1) 798 (3) Rhode Island 8 63–100 22,637 10,653 (47) 4,907 (22) 2,120 (9) 388 (2) 55 (—) 9 (—) 241 (1) 4,228 (19) South Carolina 23 70–91 63,976 4,705 (7) 15,311 (24) 36,609 (57) 686 (1) 124 (—) 12 (—) 321 (1) 6,097 (10) South Dakota 4 50–100 5,966 1,194 (20) 3,536 (59) 67 (1) 223 (4) 283 (5) 14 (—) 16 (—) 631 (11) Tennessee 29 59–83 85,712 8,496 (10) 53,673 (63) 8,411 (10) 430 (1) 63 (—) 53 (—) 1,018 (1) 13,549 (16) Texas 72 69–85 353,081 109,844 (31) 55,515 (16) 42,531 (12) 10,324 (3) 766 (—) 170 (—) 1,510 (—) 132,353 (37) U.S. Virgin Islands 2 0–50 365 100 (27) 45 (12) 200 (55) 0 (—) 0 (—) 0 (—) 20 (5) 0 (—) Utah 13 62–92 13,870 5,451 (39) 4,663 (34) 209 (2) 65 (—) 622 (4) 26 (—) 125 (1) 2,671 (19) Vermont 11 64–100 5,017 143 (3) 4,415 (88) 42 (1) 41 (1) 16 (—) 0 (—) 10 (—) 348 (7) Virginia 26 65–88 35,346 8,234 (23) 15,027 (43) 6,979 (20) 381 (1) 140 (—) 4 (—) 211 (1) 4,350 (12) Washington 27 70–89 98,481 34,877 (35) 30,972 (31) 3,647 (4) 3,844 (4) 1,317 (1) 240 (—) 1,664 (2) 20,566 (21) West Virginia 28 61–89 47,084 2,864 (6) 39,019 (83) 1,748 (4) 48 (—) 18 (—) 12 (—) 221 (—) 3,153 (7) Wisconsin 16 69–100 23,098 10,532 (46) 4,309 (19) 1,962 (8) 153 (1) 150 (1) 15 (—) 33 (—) 5,932 (26) Wyoming 6 33–83 1,304 559 (43) 595 (46) 14 (1) 6 (—) 25 (2) 1 (—) 22 (2) 82 (6) Abbreviations: AI/AN = American Indian/Alaska Native; COVID-19 = coronavirus disease 2019; FQHC = Federally Qualified Health Center; NH/PI = Native Hawaiian/Other Pacific Islander; NH = non-Hispanic. * SARS-CoV-2 viral tests include polymerase chain reaction and antigen tests. † The Health Resources Services Administration (HRSA) funds health centers in all 50 states, the District of Columbia, and the following U.S. territories and freely associated states: American Samoa, Federated States of Micronesia, Guam, Northern Mariana Islands, Marshall Islands, Puerto Rico, and U.S. Virgin Islands. § In June 2020, the number of HRSA-fund health centers was 1,382. By September, the number of HRSA-funded centers decreased to 1,376, by three in California and by one each in Massachusetts, Missouri, New Jersey, and Puerto Rico. By October, the number of Puerto Rico’s HRSA-funded health centers increased by one. ¶ FQHCs receive HRSA Health Center Program federal grant funding to improve the health of underserved populations ** The weekly response rate was calculated using the number of health centers that responded to the survey as the numerator and number of current HRSA-funded health centers as the denominator. The response range represents the lowest response rate and the highest response rate nationally and by state during June 5–October 2, 2020. †† Data for the number of persons receiving testing or who had positive test results are aggregated by health center before submission and cannot be deduplicated, which might inflate or misrepresent the number of patients who received testing or who had positive test results. TABLE 2 Positive viral tests for SARS-CoV-2,* by race/ethnicity and jurisdiction † — Health Center COVID-19 Survey, United States, June 5–October 2, 2020 Jurisdiction Total positive§ Race/Ethnicity, no. positive (row %) Hispanic/Latino White, NH Black, NH Asian, NH AI/AN, NH NH/PI, NH Multiracial Unreported United States 308,780 140,462 (45) 59,959 (19) 38,385 (12) 6,792 (2) 1,262 (—) 473 (—) 2,378 (1) 57,208 (19) Alabama 5,097 710 (14) 1,469 (29) 2,296 (45) 23 (—) 14 (—) 0 (—) 32 (1) 542 (11) Alaska 961 81 (8) 167 (17) 31 (3) 18 (2) 253 (26) 0 (—) 7 (1) 399 (42) American Samoa 0 0 (—) 0 (—) 0 (—) 0 (—) 0 (—) 0 (—) 0 (—) 0 (—) Arizona 8,297 4,719 (57) 1,857 (22) 243 (3) 25 (—) 178 (2) 9 (—) 70 (1) 1,190 (14) Arkansas 5,946 1,808 (30) 1,738 (29) 883 (15) 14 (—) 13 (—) 7 (—) 10 (—) 886 (15) California 46,113 33,310 (72) 4,075 (9) 2,458 (5) 997 (2) 76 (—) 63 (—) 572 (1) 4,470 (10) Colorado 4,656 3,234 (69) 721 (15) 142 (3) 49 (1) 14 (—) 3 (—) 10 (—) 480 (10) Connecticut 3,904 2,032 (52) 221 (6) 229 (6) 33 (1) 2 (—) 1 (—) 3 (—) 1,379 (35) Delaware 244 144 (59) 19 (8) 71 (29) 4 (2) 2 (1) 0 (—) 0 (—) 4 (2) District of Columbia 1,697 737 (43) 82 (5) 696 (41) 16 (1) 4 (—) 0 (—) 6 (—) 154 (9) Federated States of Micronesia 0 0 (—) 0 (—) 0 (—) 0 (—) 0 (—) 0 (—) 0 (—) 0 (—) Florida 43,859 17,913 (41) 3,500 (8) 3,347 (8) 131 (—) 9 (—) 2 (—) 142 (—) 18,802 (43) Georgia 13,130 2,984 (23) 4,213 (32) 4,204 (32) 69 (1) 6 (—) 2 (—) 48 (—) 1,597 (12) Guam 633 2 (—) 5 (1) 0 (—) 222 (35) 0 (—) 0 (—) 35 (6) 2 (—) Hawaii 907 63 (7) 27 (3) 3 (—) 144 (16) 1 (—) 234 (26) 20 (2) 78 (9) Idaho 2,938 1,185 (40) 991 (34) 119 (4) 55 (2) 94 (3) 18 (1) 9 (—) 467 (16) Illinois 16,752 6,993 (42) 3,571 (21) 2,074 (12) 151 (1) 16 (—) 1 (—) 55 (—) 3,874 (23) Indiana 3,274 1,372 (42) 600 (18) 238 (7) 152 (5) 2 (—) 0 (—) 12 (—) 897 (27) Iowa 3,634 1,011 (28) 1,550 (43) 141 (4) 68 (2) 14 (—) 1 (—) 25 (1) 821 (23) Kansas 2,810 1,345 (48) 986 (35) 177 (6) 27 (1) 30 (1) 5 (—) 3 (—) 226 (8) Kentucky 4,191 579 (14) 2,884 (69) 306 (7) 35 (1) 0 (—) 2 (—) 22 (1) 361 (9) Louisiana 4,922 734 (15) 1,826 (37) 2,088 (42) 29 (1) 11 (—) 0 (—) 37 (1) 191 (4) Maine 119 28 (24) 42 (35) 43 (36) 0 (—) 0 (—) 0 (—) 1 (1) 5 (4) Marshall Islands 0 0 (—) 0 (—) 0 (—) 0 (—) 0 (—) 0 (—) 0 (—) 0 (—) Maryland 1,472 763 (52) 148 (10) 410 (28) 24 (2) 13 (1) 1 (—) 19 (1) 93 (6) Massachusetts 10,029 6,755 (67) 1,167 (12) 696 (7) 312 (3) 1 (—) 1 (—) 50 (—) 1,031 (10) Michigan 3,931 1,060 (27) 1,455 (37) 460 (12) 65 (2) 9 (—) 2 (—) 48 (1) 828 (21) Minnesota 2,194 991 (45) 219 (10) 527 (24) 190 (9) 22 (1) 1 (—) 2 (—) 241 (11) Mississippi 3,412 255 (7) 686 (20) 2,348 (69) 23 (1) 7 (—) 1 (—) 29 (1) 54 (2) Missouri 5,770 1,319 (23) 2,310 (40) 1,090 (19) 48 (1) 8 (—) 0 (—) 23 (—) 916 (16) Montana 865 26 (3) 323 (37) 2 (—) 1 (—) 30 (3) 1 (—) 2 (—) 480 (55) Nebraska 1,749 1,171 (67) 160 (9) 138 (8) 131 (7) 2 (—) 0 (—) 6 (—) 140 (8) Nevada 2,893 2,029 (70) 325 (11) 121 (4) 127 (4) 7 (—) 21 (1) 14 (—) 245 (8) New Hampshire 139 91 (65) 32 (23) 8 (6) 4 (3) 0 (—) 0 (—) 0 (—) 4 (3) New Jersey 3,275 1,080 (33) 266 (8) 287 (9) 40 (1) 0 (—) 0 (—) 16 (—) 1,584 (48) New Mexico 729 531 (73) 89 (12) 8 (1) 2 (—) 23 (3) 0 (—) 7 (1) 66 (9) New York 10,697 1,404 (13) 1,382 (13) 1,507 (14) 1,775 (17) 6 (—) 3 (—) 75 (1) 4,528 (42) North Carolina 8,467 3,922 (46) 1,846 (22) 1,623 (19) 63 (1) 53 (1) 8 (—) 40 (—) 908 (11) North Dakota 402 13 (3) 173 (43) 49 (12) 17 (4) 8 (2) 0 (—) 0 (—) 142 (35) Northern Mariana Islands 0 0 (—) 0 (—) 0 (—) 0 (—) 0 (—) 0 (—) 0 (—) 0 (—) Ohio 4,794 1,014 (21) 1,881 (39) 1,197 (25) 88 (2) 2 (—) 21 (—) 33 (1) 556 (12) Oklahoma 1,264 500 (40) 419 (33) 70 (6) 14 (1) 46 (4) 1 (—) 10 (1) 197 (16) Oregon 1,785 1,011 (57) 266 (15) 79 (4) 346 (19) 14 (1) 1 (—) 3 (—) 62 (3) Palau 0 0 (—) 0 (—) 0 (—) 0 (—) 0 (—) 0 (—) 0 (—) 0 (—) Pennsylvania 3,573 1,105 (31) 954 (27) 719 (20) 357 (10) 7 (—) 1 (—) 87 (2) 333 (9) Puerto Rico 2,137 2,095 (98) 5 (—) 5 (—) 0 (—) 0 (—) 0 (—) 0 (—) 32 (1) Rhode Island 2,808 1,943 (69) 250 (9) 196 (7) 35 (1) 0 (—) 2 (—) 19 (1) 360 (13) South Carolina 5,399 1,087 (20) 1,075 (20) 2,602 (48) 18 (—) 18 (—) 1 (—) 16 (—) 568 (11) South Dakota 857 167 (19) 542 (63) 5 (1) 65 (8) 18 (2) 1 (—) 1 (—) 58 (7) Tennessee 13,014 2,726 (21) 6,116 (47) 1,544 (12) 114 (1) 22 (—) 6 (—) 432 (3) 2,038 (16) Texas 22,444 15,079 (67) 2,588 (12) 1,725 (8) 397 (2) 47 (—) 2 (—) 180 (1) 2,419 (11) U.S. Virgin Islands 2 0 (—) 0 (—) 2 (100) 0 (—) 0 (—) 0 (—) 0 (—) 0 (—) Utah 1,597 1,099 (69) 284 (18) 20 (1) 6 (—) 48 (3) 1 (—) 17 (1) 116 (7) Vermont 35 2 (6) 20 (57) 4 (11) 5 (14) 0 (—) 0 (—) 0 (—) 4 (11) Virginia 3,966 1,684 (42) 1,272 (32) 633 (16) 23 (1) 6 (—) 0 (—) 17 (—) 331 (8) Washington 9,601 6,115 (64) 1,295 (13) 265 (3) 219 (2) 92 (1) 39 (—) 95 (1) 1,289 (13) West Virginia 1,792 249 (14) 1,363 (76) 78 (4) 2 (—) 0 (—) 0 (—) 8 (—) 92 (5) Wisconsin 3,381 2,090 (62) 418 (12) 175 (5) 19 (1) 6 (—) 10 (—) 4 (—) 650 (19) Wyoming 223 102 (46) 86 (39) 3 (1) 0 (—) 8 (4) 0 (—) 6 (3) 18 (8) Abbreviations: AI/AN = American Indian/Alaska Native; COVID-19 = coronavirus disease 2019; NH = non-Hispanic; NH/PI = Native Hawaiian/Other Pacific Islander. * SARS-CoV-2 viral tests include polymerase chain reaction and antigen tests. † The Health Resources Services Administration funds health centers in all 50 states, the District of Columbia, and the following U.S. territories and freely associated states: American Samoa, Federated States of Micronesia, Guam, Northern Mariana Islands, Marshall Islands, Puerto Rico, and U.S. Virgin Islands. § Data for the number of persons receiving testing or who had positive test results are aggregated by health center before submission and cannot be deduplicated, which might inflate or misrepresent the number of patients who received testing or who had positive test results. Discussion Health centers’ efforts to increase testing for SARS-CoV-2 are an important mitigation strategy to reach racial and ethnic minority groups at increased risk for COVID-19. Published state and national data indicate that racial and ethnic minority groups might be more likely to become infected with SARS-CoV-2, experience more severe COVID-19–associated illness, and have higher risk for death from COVID-19 ( 2 – 7 ). This study contributes to understanding current health center testing patterns and areas for improvement. Long-standing social inequalities and health disparities among racial and ethnic minority groups likely result from a multitude of factors that lead to increased risk for getting ill and dying of COVID-19, including discrimination,**** limited health care access and utilization, occupation, housing, and educational and income gaps. †††† Further, these factors might contribute to other risk factors for severe disease and death, including limited health care access, underlying medical conditions, and higher levels of environmental exposure. The factors contributing to disparities likely vary widely within and among groups, depending on geographic location and other contextual factors. Health centers have a long-standing commitment to meeting the primary care needs of their communities ( 8 ). HRSA has awarded funding §§§§ to support health centers to purchase, administer, and expand capacity for COVID-19 testing and response-related activities, which has enabled health centers to maintain or increase their staffing levels, conduct training, purchase personal protective equipment, and administer tests. Health center services, including testing, contact tracing, isolation, providing health care, and aiding recovery from the impact of unintended negative consequences ¶¶¶¶ of mitigation strategies, have increased the capacity of health centers to reach populations at increased risk for COVID-19 as well as access to testing and care.***** A recent analysis of SARS-CoV-2 testing in a multistate network of health centers during the first weeks of the COVID-19 pandemic reported small racial differences in testing and positivity rates; however, larger differences were identified by ethnicity, preferred language, and insurance status, underscoring health centers’ unique position for serving racial and ethnic minority groups and addressing the ongoing need for targeted, language-concordant testing strategies ( 9 ). The results of this analysis indicate that health centers have afforded racial and ethnic minority populations access to SARS-CoV-2 testing during the COVID-19 pandemic and that these populations were at increased risk for COVID-19, given the large percentage of positive test results. White and Hispanic patients each accounted for 29% of tests performed; however, only 19% of positive test results were among White persons who received testing, whereas 61% were among racial and ethnic minority groups, with the largest percentage of positive test results (45%) among Hispanic patients. Twenty-six states and Puerto Rico reported >40% of positive tests among persons of Hispanic ethnicity with 1.5% of all Hispanic patients receiving testing at Puerto Rican health centers. The findings in this report are subject to at least five limitations. First, the data used in this analysis are based on responses from health centers that voluntarily reported data to the Health Center COVID-19 Survey and might not be representative of all health centers in the United States, its territories, and freely associated states. Second, data represent a date range of information provided by health centers specified by weekly reporting date. Summary information across report dates is not comparable because of differences in health center responses for a given report date. Third, race and ethnicity data were missing for approximately 22% of patients who received testing and 19% of patients who had positive test results. Fourth, the reported number of patients tested each week does not fully represent the same patients included in the reported number with positive test results that week because of a lag between the date the specimen is collected and the availability of test results. Therefore, positivity cannot be inferred by dividing the number of patients who received positive test results by the number receiving testing. Finally, data for the number of persons with testing or positive results are aggregated by health centers before submission and cannot be deduplicated, which might inflate or misrepresent the number of patients receiving testing or positive test results. Health centers are an integral component of health systems designed to address structural inequities ( 10 ). During the COVID-19 public health emergency, health centers have played an important role in providing access to testing in communities disproportionately affected by COVID-19. Health centers’ ability to reach populations at higher risk for SARS-CoV-2 infection might reduce COVID-19 transmission by identifying cases and supporting public health contact tracing and isolation among populations they serve. Summary What is already known about this topic? Long-standing social inequities and health disparities have resulted in increased risk for COVID-19 infection, severe illness, and death among racial and ethnic minority populations. What is added by this report? Health centers have provided racial and ethnic minority populations access to SARS-CoV-2 testing. Improving health centers’ ability to reach groups at increased risk for COVID-19 might reduce transmission by identifying cases and supporting contact tracing and isolation. What are the implications for public health practice? Efforts to improve coordination of COVID-19 response-related activities between state and local public health departments and HRSA-funded health centers can increase access to testing and follow-up care for populations at increased risk for COVID-19.

          Related collections

          Most cited references8

          • Record: found
          • Abstract: found
          • Article: found
          Is Open Access

          Coronavirus Disease 2019 Case Surveillance — United States, January 22–May 30, 2020

          The coronavirus disease 2019 (COVID-19) pandemic resulted in 5,817,385 reported cases and 362,705 deaths worldwide through May, 30, 2020, † including 1,761,503 aggregated reported cases and 103,700 deaths in the United States. § Previous analyses during February–early April 2020 indicated that age ≥65 years and underlying health conditions were associated with a higher risk for severe outcomes, which were less common among children aged 10% of persons in this age group. TABLE 2 Reported underlying health conditions* and symptoms † among persons with laboratory-confirmed COVID-19, by sex and age group — United States, January 22–May 30, 2020 Characteristic No. (%) Total Sex Age group (yrs) Male Female ≤9 10–19 20–29 30–39 40–49 50–59 60–69 70–79 ≥80 Total population 1,320,488 646,358 674,130 20,458 49,245 182,469 214,849 219,139 235,774 179,007 105,252 114,295 Underlying health condition§ Known underlying medical condition status* 287,320 (21.8) 138,887 (21.5) 148,433 (22.0) 2,896 (14.2) 7,123 (14.5) 27,436 (15.0) 33,483 (15.6) 40,572 (18.5) 54,717 (23.2) 50,125 (28.0) 34,400 (32.7) 36,568 (32.0) Any cardiovascular disease¶ 92,546 (32.2) 47,567 (34.2) 44,979 (30.3) 78 (2.7) 164 (2.3) 1,177 (4.3) 3,588 (10.7) 8,198 (20.2) 16,954 (31.0) 21,466 (42.8) 18,763 (54.5) 22,158 (60.6) Any chronic lung disease 50,148 (17.5) 20,930 (15.1) 29,218 (19.7) 363 (12.5) 1,285 (18) 4,537 (16.5) 5,110 (15.3) 6,127 (15.1) 8,722 (15.9) 9,200 (18.4) 7,436 (21.6) 7,368 (20.1) Renal disease 21,908 (7.6) 12,144 (8.7) 9,764 (6.6) 21 (0.7) 34 (0.5) 204 (0.7) 587 (1.8) 1,273 (3.1) 2,789 (5.1) 4,764 (9.5) 5,401 (15.7) 6,835 (18.7) Diabetes 86,737 (30.2) 45,089 (32.5) 41,648 (28.1) 12 (0.4) 225 (3.2) 1,409 (5.1) 4,106 (12.3) 9,636 (23.8) 19,589 (35.8) 22,314 (44.5) 16,594 (48.2) 12,852 (35.1) Liver disease 3,953 (1.4) 2,439 (1.8) 1,514 (1.0) 5 (0.2) 19 (0.3) 132 (0.5) 390 (1.2) 573 (1.4) 878 (1.6) 1,074 (2.1) 583 (1.7) 299 (0.8) Immunocompromised 15,265 (5.3) 7,345 (5.3) 7,920 (5.3) 61 (2.1) 146 (2.0) 646 (2.4) 1,253 (3.7) 2,005 (4.9) 3,190 (5.8) 3,421 (6.8) 2,486 (7.2) 2,057 (5.6) Neurologic/Neurodevelopmental disability 13,665 (4.8) 6,193 (4.5) 7,472 (5.0) 41 (1.4) 113 (1.6) 395 (1.4) 533 (1.6) 734 (1.8) 1,338 (2.4) 2,006 (4.0) 2,759 (8.0) 5,746 (15.7) Symptom§ Known symptom status† 373,883 (28.3) 178,223 (27.6) 195,660 (29.0) 5,188 (25.4) 12,689 (25.8) 51,464 (28.2) 59,951 (27.9) 62,643 (28.6) 70,040 (29.7) 52,178 (29.1) 28,583 (27.2) 31,147 (27.3) Fever, cough, or shortness of breath 260,706 (69.7) 125,768 (70.6) 134,938 (69.0) 3,278 (63.2) 7,584 (59.8) 35,072 (68.1) 42,016 (70.1) 45,361 (72.4) 51,283 (73.2) 37,701 (72.3) 19,583 (68.5) 18,828 (60.4) Fever †† 161,071 (43.1) 80,578 (45.2) 80,493 (41.1) 2,404 (46.3) 4,443 (35.0) 20,381 (39.6) 25,887 (43.2) 28,407 (45.3) 32,375 (46.2) 23,591 (45.2) 12,190 (42.6) 11,393 (36.6) Cough 187,953 (50.3) 89,178 (50.0) 98,775 (50.5) 1,912 (36.9) 5,257 (41.4) 26,284 (51.1) 31,313 (52.2) 34,031 (54.3) 38,305 (54.7) 27,150 (52.0) 12,837 (44.9) 10,864 (34.9) Shortness of breath 106,387 (28.5) 49,834 (28.0) 56,553 (28.9) 339 (6.5) 2,070 (16.3) 13,649 (26.5) 16,851 (28.1) 18,978 (30.3) 21,327 (30.4) 16,018 (30.7) 8,971 (31.4) 8,184 (26.3) Myalgia 135,026 (36.1) 61,922 (34.7) 73,104 (37.4) 537 (10.4) 3,737 (29.5) 21,153 (41.1) 26,464 (44.1) 28,064 (44.8) 28,594 (40.8) 17,360 (33.3) 6,015 (21.0) 3,102 (10.0) Runny nose 22,710 (6.1) 9,900 (5.6) 12,810 (6.5) 354 (6.8) 1,025 (8.1) 4,591 (8.9) 4,406 (7.3) 4,141 (6.6) 4,100 (5.9) 2,671 (5.1) 923 (3.2) 499 (1.6) Sore throat 74,840 (20.0) 31,244 (17.5) 43,596 (22.3) 664 (12.8) 3,628 (28.6) 14,493 (28.2) 14,855 (24.8) 14,490 (23.1) 13,930 (19.9) 8,192 (15.7) 2,867 (10.0) 1,721 (5.5) Headache 128,560 (34.4) 54,721 (30.7) 73,839 (37.7) 785 (15.1) 5,315 (41.9) 23,723 (46.1) 26,142 (43.6) 26,245 (41.9) 26,057 (37.2) 14,735 (28.2) 4,163 (14.6) 1,395 (4.5) Nausea/Vomiting 42,813 (11.5) 16,549 (9.3) 26,264 (13.4) 506 (9.8) 1,314 (10.4) 6,648 (12.9) 7,661 (12.8) 8,091 (12.9) 8,737 (12.5) 5,953 (11.4) 2,380 (8.3) 1,523 (4.9) Abdominal pain 28,443 (7.6) 11,553 (6.5) 16,890 (8.6) 349 (6.7) 978 (7.7) 4,211 (8.2) 5,150 (8.6) 5,531 (8.8) 6,134 (8.8) 3,809 (7.3) 1,449 (5.1) 832 (2.7) Diarrhea 72,039 (19.3) 32,093 (18.0) 39,946 (20.4) 704 (13.6) 1,712 (13.5) 9,867 (19.2) 12,769 (21.3) 13,958 (22.3) 15,536 (22.2) 10,349 (19.8) 4,402 (15.4) 2,742 (8.8) Loss of smell or taste 31,191 (8.3) 12,717 (7.1) 18,474 (9.4) 67 (1.3) 1,257 (9.9) 6,828 (13.3) 6,907 (11.5) 6,361 (10.2) 5,828 (8.3) 2,930 (5.6) 775 (2.7) 238 (0.8) Abbreviation: COVID-19 = coronavirus disease 2019. * Status of underlying health conditions known for 287,320 persons. Status was classified as “known” if any of the following conditions were reported as present or absent: diabetes mellitus, cardiovascular disease (including hypertension), severe obesity (body mass index ≥40 kg/m2), chronic renal disease, chronic liver disease, chronic lung disease, immunocompromising condition, autoimmune condition, neurologic condition (including neurodevelopmental, intellectual, physical, visual, or hearing impairment), psychologic/psychiatric condition, and other underlying medical condition not otherwise specified. † Symptom status was known for 373,883 persons. Status was classified as “known” if any of the following symptoms were reported as present or absent: fever (measured >100.4°F [38°C] or subjective), cough, shortness of breath, wheezing, difficulty breathing, chills, rigors, myalgia, rhinorrhea, sore throat, chest pain, nausea or vomiting, abdominal pain, headache, fatigue, diarrhea (≥3 loose stools in a 24-hour period), or other symptom not otherwise specified on the form. § Responses include data from standardized fields supplemented with data from free-text fields. Information for persons with loss of smell or taste was exclusively extracted from a free-text field; therefore, persons exhibiting this symptom were likely underreported. ¶ Includes persons with reported hypertension. ** Includes all persons with at least one of these symptoms reported. †† Persons were considered to have a fever if information on either measured or subjective fever variables if “yes” was reported for either variable. Among 287,320 (22%) cases with data on individual underlying health conditions, those most frequently reported were cardiovascular disease (32%), diabetes (30%), and chronic lung disease (18%) (Table 2); the reported proportions were similar among males and females. The frequency of conditions reported varied by age group: cardiovascular disease was uncommon among those aged ≤39 years but was reported in approximately half of the cases among persons aged ≥70 years. Among 63,896 females aged 15–44 years with known pregnancy status, 6,708 (11%) were reported to be pregnant. Among the 1,320,488 cases, outcomes for hospitalization, ICU admission, and death were available for 46%, 14%, and 36%, respectively. Overall, 184,673 (14%) patients were hospitalized, including 29,837 (2%) admitted to the ICU; 71,116 (5%) patients died (Table 3). Severe outcomes were more commonly reported for patients with reported underlying conditions. Hospitalizations were six times higher among patients with a reported underlying condition than those without reported underlying conditions (45.4% versus 7.6%). Deaths were 12 times higher among patients with reported underlying conditions compared with those without reported underlying conditions (19.5% versus 1.6%). The percentages of males who were hospitalized (16%), admitted to the ICU (3%), and who died (6%) were higher than were those for females (12%, 2%, and 5%, respectively). The percentage of ICU admissions was highest among persons with reported underlying conditions aged 60–69 years (11%) and 70–79 years (12%). Death was most commonly reported among persons aged ≥80 years regardless of the presence of underlying conditions (with underlying conditions 50%; without 30%). TABLE 3 Reported hospitalizations,* , † intensive care unit (ICU) admissions, § and deaths ¶ among laboratory-confirmed COVID-19 patients with and without reported underlying health conditions, ** by sex and age — United States, January 22–May 30, 2020 Characteristic (no.) Outcome, no./total no. (%)†† Reported hospitalizations*,† (including ICU) Reported ICU admission§ Reported deaths¶ Among all patients Among patients with reported underlying health conditions Among patients with no reported underlying health conditions Among all patients Among patients with reported underlying health conditions Among patients with no reported underlying health conditions Among all patients Among patients with reported underlying health conditions Among patients with no reported underlying health conditions Sex Male (646,358) 101,133/646,358 (15.6) 49,503/96,839 (51.1) 3,596/42,048 (8.6) 18,394/646,358 (2.8) 10,302/96,839 (10.6) 864/42,048 (2.1) 38,773/646,358 (6.0) 21,667/96,839 (22.4) 724/42,048 (1.7) Female (674,130) 83,540/674,130 (12.4) 40,698/102,040 (39.9) 3,087/46,393 (6.7) 11,443/674,130 (1.7) 6,672/102,040 (6.5) 479/46,393 (1.0) 32,343/674,130 (4.8) 17,145/102,040 (16.8) 707/46,393 (1.5) Age group (yrs) ≤9 (20,458) 848/20,458 (4.1) 138/619 (22.3) 84/2,277 (3.7) 141/20,458 (0.7) 31/619 (5.0) 16/2,277 (0.7) 13/20,458 (0.1) 4/619 (0.6) 2/2,277 (0.1) 10–19 (49,245) 1,234/49,245 (2.5) 309/2,076 (14.9) 115/5,047 (2.3) 216/49,245 (0.4) 72/2,076 (3.5) 17/5,047 (0.3) 33/49,245 (0.1) 16/2,076 (0.8) 4/5,047 (0.1) 20–29 (182,469) 6,704/182,469 (3.7) 1,559/8,906 (17.5) 498/18,530 (2.7) 864/182,469 (0.5) 300/8,906 (3.4) 56/18,530 (0.3) 273/182,469 (0.1) 122/8,906 (1.4) 24/18,530 (0.1) 30–39 (214,849) 12,570/214,849 (5.9) 3,596/14,854 (24.2) 828/18,629 (4.4) 1,879/214,849 (0.9) 787/14,854 (5.3) 135/18,629 (0.7) 852/214,849 (0.4) 411/14,854 (2.8) 21/18,629 (0.1) 40–49 (219,139) 19,318/219,139 (8.8) 7,151/24,161 (29.6) 1,057/16,411 (6.4) 3,316/219,139 (1.5) 1,540/24,161 (6.4) 208/16,411 (1.3) 2,083/219,139 (1.0) 1,077/24,161 (4.5) 58/16,411 (0.4) 50–59 (235,774) 31,588/235,774 (13.4) 14,639/40,297 (36.3) 1,380/14,420 (9.6) 5,986/235,774 (2.5) 3,335/40,297 (8.3) 296/14,420 (2.1) 5,639/235,774 (2.4) 3,158/40,297 (7.8) 131/14,420 (0.9) 60–69 (179,007) 39,422/179,007 (22.0) 21,064/42,206 (49.9) 1,216/7,919 (15.4) 7,403/179,007 (4.1) 4,588/42,206 (10.9) 291/7,919 (3.7) 11,947/179,007 (6.7) 7,050/42,206 (16.7) 187/7,919 (2.4) 70–79 (105,252) 35,844/105,252 (34.1) 20,451/31,601 (64.7) 780/2,799 (27.9) 5,939/105,252 (5.6) 3,771/31,601 (11.9) 199/2,799 (7.1) 17,510/105,252 (16.6) 10,008/31,601 (31.7) 286/2,799 (10.2) ≥80 (114,295) 37,145/114,295 (32.5) 21,294/34,159 (62.3) 725/2,409 (30.1) 4,093/114,295 (3.6) 2,550/34,159 (7.5) 125/2,409 (5.2) 32,766/114,295 (28.7) 16,966/34,159 (49.7) 718/2,409 (29.8) Total (1,320,488) 184,673/1,320,488 (14.0) 90,201/198,879 (45.4) 6,683/88,441 (7.6) 29,837/1,320,488 (2.3) 16,974/198,879 (8.5) 1,343/88,441 (1.5) 71,116/1,320,488 (5.4) 38,812/198,879 (19.5) 1,431/88,441 (1.6) Abbreviation: COVID-19 = coronavirus disease 2019. * Hospitalization status was known for 600,860 (46%). Among 184,673 hospitalized patients, the presence of underlying health conditions was known for 96,884 (53%). † Includes reported ICU admissions. § ICU admission status was known for 186,563 (14%) patients among the total case population, representing 34% of hospitalized patients. Among 29,837 patients admitted to the ICU, the status of underlying health conditions was known for 18,317 (61%). ¶ Death outcomes were known for 480,565 (36%) patients. Among 71,116 reported deaths through case surveillance, the status of underlying health conditions was known for 40,243 (57%) patients. ** Status of underlying health conditions was known for 287,320 (22%) patients. Status was classified as “known” if any of the following conditions were noted as present or absent: diabetes mellitus, cardiovascular disease including hypertension, severe obesity body mass index ≥40 kg/m2, chronic renal disease, chronic liver disease, chronic lung disease, any immunocompromising condition, any autoimmune condition, any neurologic condition including neurodevelopmental, intellectual, physical, visual, or hearing impairment, any psychologic/psychiatric condition, and any other underlying medical condition not otherwise specified. †† Outcomes were calculated as the proportion of persons reported to be hospitalized, admitted to an ICU, or who died among total in the demographic group. Outcome underreporting could result from outcomes that occurred but were not reported through national case surveillance or through clinical progression to severe outcomes that occurred after time of report. Discussion As of May 30, a total of 1,761,503 aggregate U.S. cases of COVID-19 and 103,700 associated deaths were reported to CDC. Although average daily reported cases and deaths are declining, 7-day moving averages of daily incidence of COVID-19 cases indicate ongoing community transmission. ¶¶¶¶ The COVID-19 case data summarized here are essential statistics for the pandemic response and rely on information systems developed at the local, state, and federal level over decades for communicable disease surveillance that were rapidly adapted to meet an enormous, new public health threat. CDC aggregate counts are consistent with those presented through the Johns Hopkins University (JHU) Coronavirus Resource Center, which reported a cumulative total of 1,770,165 U.S. cases and 103,776 U.S. deaths on May 30, 2020.***** Differences in aggregate counts between CDC and JHU might be attributable to differences in reporting practices to CDC and jurisdictional websites accessed by JHU. Reported cumulative incidence in the case surveillance population among persons aged ≥20 years is notably higher than that among younger persons. The lower incidence in persons aged ≤19 years could be attributable to undiagnosed milder or asymptomatic illnesses among this age group that were not reported. Incidence in persons aged ≥80 years was nearly double that in persons aged 70–79 years. Among cases with known race and ethnicity, 33% of persons were Hispanic, 22% were black, and 1.3% were AI/AN. These findings suggest that persons in these groups, who account for 18%, 13%, and 0.7% of the U.S. population, respectively, are disproportionately affected by the COVID-19 pandemic. The proportion of missing race and ethnicity data limits the conclusions that can be drawn from descriptive analyses; however, these findings are consistent with an analysis of COVID-19–Associated Hospitalization Surveillance Network (COVID-NET) ††††† data that found higher proportions of black and Hispanic persons among hospitalized COVID-19 patients than were in the overall population ( 4 ). The completeness of race and ethnicity variables in case surveillance has increased from 20% to >40% from April 2 to June 2. Although reporting of race and ethnicity continues to improve, more complete data might be available in aggregate on jurisdictional websites or through sources like the COVID Tracking Project’s COVID Racial Data Tracker. §§§§§ The data in this report show that the prevalence of reported symptoms varied by age group but was similar among males and females. Fewer than 5% of persons were reported to be asymptomatic when symptom data were submitted. Persons without symptoms might be less likely to be tested for COVID-19 because initial guidance recommended testing of only symptomatic persons and was hospital-based. Guidance on testing has evolved throughout the response. ¶¶¶¶¶ Whereas incidence among males and females was similar overall, severe outcomes were more commonly reported among males. Prevalence of reported severe outcomes increased with age; the percentages of hospitalizations, ICU admissions, and deaths were highest among persons aged ≥70 years, regardless of underlying conditions, and lowest among those aged ≤19 years. Hospitalizations were six times higher and deaths 12 times higher among those with reported underlying conditions compared with those with none reported. These findings are consistent with previous reports that found that severe outcomes increased with age and underlying condition, and males were hospitalized at a higher rate than were females ( 2 , 4 , 5 ). The findings in this report are subject to at least three limitations. First, case surveillance data represent a subset of the total cases of COVID-19 in the United States; not every case in the community is captured through testing and information collected might be limited if persons are unavailable or unwilling to participate in case investigations or if medical records are unavailable for data extraction. Reported cumulative incidence, although comparable across age and sex groups within the case surveillance population, are underestimates of the U.S. cumulative incidence of COVID-19. Second, reported frequencies of individual symptoms and underlying health conditions presented from case surveillance likely underestimate the true prevalence because of missing data. Finally, asymptomatic cases are not captured well in case surveillance. Asymptomatic persons are unlikely to seek testing unless they are identified through active screening (e.g., contact tracing), and, because of limitations in testing capacity and in accordance with guidance, investigation of symptomatic persons is prioritized. Increased identification and reporting of asymptomatic cases could affect patterns described in this report. Similar to earlier reports on COVID-19 case surveillance, severe outcomes were more commonly reported among persons who were older and those with underlying health conditions ( 1 ). Findings in this report align with demographic and severe outcome trends identified through COVID-NET ( 4 ). Findings from case surveillance are evaluated along with enhanced surveillance data and serologic survey results to provide a comprehensive picture of COVID-19 trends, and differences in proportion of cases by racial and ethnic groups should continue to be examined in enhanced surveillance to better understand populations at highest risk. Since the U.S. COVID-19 response began in January, CDC has built on existing surveillance capacity to monitor the impact of illness nationally. Collection of detailed case data is a resource-intensive public health activity, regardless of disease incidence. The high incidence of COVID-19 has highlighted limitations of traditional public health case surveillance approaches to provide real-time intelligence and supports the need for continued innovation and modernization. Despite limitations, national case surveillance of COVID-19 serves a critical role in the U.S. COVID-19 response: these data demonstrate that the COVID-19 pandemic is an ongoing public health crisis in the United States that continues to affect all populations and result in severe outcomes including death. National case surveillance findings provide important information for targeted enhanced surveillance efforts and development of interventions critical to the U.S. COVID-19 response. Summary What is already known about this topic? Surveillance data reported to CDC through April 2020 indicated that COVID-19 leads to severe outcomes in older adults and those with underlying health conditions. What is added by this report? As of May 30, 2020, among COVID-19 cases, the most common underlying health conditions were cardiovascular disease (32%), diabetes (30%), and chronic lung disease (18%). Hospitalizations were six times higher and deaths 12 times higher among those with reported underlying conditions compared with those with none reported. What are the implications for public health practice? Surveillance at all levels of government, and its continued modernization, is critical for monitoring COVID-19 trends and identifying groups at risk for infection and severe outcomes. These findings highlight the continued need for community mitigation strategies, especially for vulnerable populations, to slow COVID-19 transmission.
            Bookmark
            • Record: found
            • Abstract: found
            • Article: found
            Is Open Access

            Characteristics and Clinical Outcomes of Adult Patients Hospitalized with COVID-19 — Georgia, March 2020

            SARS-CoV-2, the novel coronavirus that causes coronavirus disease 2019 (COVID-19), was first detected in the United States during January 2020 ( 1 ). Since then, >980,000 cases have been reported in the United States, including >55,000 associated deaths as of April 28, 2020 ( 2 ). Detailed data on demographic characteristics, underlying medical conditions, and clinical outcomes for persons hospitalized with COVID-19 are needed to inform prevention strategies and community-specific intervention messages. For this report, CDC, the Georgia Department of Public Health, and eight Georgia hospitals (seven in metropolitan Atlanta and one in southern Georgia) summarized medical record–abstracted data for hospitalized adult patients with laboratory-confirmed* COVID-19 who were admitted during March 2020. Among 305 hospitalized patients with COVID-19, 61.6% were aged 0.99 Chronic kidney disease, without dialysis 32 (10.5) 2 (2.2) 12 (12.1) 18 (15.4) 0.003 24 (9.7) 8 (16.0) 0.21 Cancer 12 (3.9) 3 (3.4) 3 (3.0) 6 (5.1) 0.76 10 (4.0) 2 (4.0) >0.99 Rheumatologic or autoimmune condition 8 (2.6) 1 (1.1) 5 (5.1) 2 (1.7) 0.22 6 (2.4) 2 (4.0) 0.63 Abbreviations: BMI = body mass index; COPD = chronic obstructive pulmonary disease; COVID-19 = coronavirus disease 2019; IQR = interquartile range; N/A = not applicable. * Black was defined as non-Hispanic black race/ethnicity; other includes all other racial/ethnic groups. † P-values were calculated using Fisher’s exact tests for proportions. § Eight patients were excluded from race comparisons because race and ethnicity data were missing. ¶ Age ≥65 years was considered a high-risk condition. ** BMI data were missing for 13 patients. §§ Documented conditions included solid organ transplant (eight), human immunodeficiency virus infection (eight), cancer with chemotherapy receipt within the previous year (three), stem cell transplant (three), and leukemia (two); 16 patients were taking immunosuppressive medications. Among the 305 hospitalized patients, the median duration of hospitalization was 8.5 days and duration increased with age (Table 2). Intensive care unit (ICU) admission occurred among 119 (39.0%) patients and increased significantly with age group: among patients aged ≥65 years, 53.8% were admitted to an ICU (p 0.99 Vasopressor support 84 (27.5) 13 (14.6) 21 (21.2) 50 (42.7) 0.99 Outcome Discharged alive 233 (76.4) 85 (95.5) 83 (83.8) 65 (55.6) <0.001 192 (77.7) 34 (68.0) 0.15 Still hospitalized 24 (7.9) 1 (1.1) 7 (7.1) 16 (13.7) 0.002 18 (7.3) 6 (12.0) 0.26 Died** 48 (17.1) 3 (3.4) 9 (9.8) 36 (35.6) <0.001 37 (16.2) 10 (22.7) 0.28 Invasive mechanical ventilation or death** 86 (30.6) 16 (18.2) 22 (23.9) 48 (47.5) <0.001 69 (30.1) 16 (36.4) 0.48 Abbreviations: COVID-19 = coronavirus disease 2019; ICU = intensive care unit; IQR = interquartile range. * Black was defined as non-Hispanic black race/ethnicity; other includes all other racial/ethnic groups. † Eight patients were excluded from race comparisons because race and ethnicity data were missing. § P-values were calculated using Fisher’s exact tests for proportions and the Wilcoxon rank-sum test or the Kruskal-Wallis H test for medians. ¶ Continuous variables are presented as median (IQR). ** Among 281 total patients who were no longer hospitalized, 88 (31.3%) were aged 18–49 years, 92 (32.7%) were aged 50–64 years, and 101 (35.9%) were aged ≥65 years; among 273 patients with available race/ethnicity data who were no longer hospitalized, 229 (83.9%) were non-Hispanic black, and 44 (16.1) were of other race/ethnicity. Among 281 (92.1%) patients who were no longer hospitalized at the time of data abstraction, 48 (17.1%) died. Case fatality among patients aged 18–49 years, 50–64 years, and ≥65 years was 3.4%, 9.8%, and 35.6%, respectively (p<0.001). Black patients were not more likely than were nonblack patients to receive IMV, to die, or to experience the composite outcome of IMV or death (Figure 2). Among patients without high-risk conditions, 22.5% were admitted to the ICU, 15.0% received IMV, and 5.1% died while in the hospital. As of April 24, 2020, 24 (7.9%) patients remained hospitalized, including 14 (58.3%) in the ICU and nine (37.5%) on IMV. Overall, the estimated percentage of deaths among patients who received ICU care ranged from 37.0%, assuming all remaining ICU patients survived, to 48.7%, assuming all remaining ICU patients died. In an adjusted time-to-event analysis of IMV or death as a composite outcome, no significant difference was found between black and nonblack patients (HR = 0.63; 95% CI = 0.35–1.13). Discussion This report characterizing a cohort of hospitalized adults with COVID-19 in Georgia (primarily metropolitan Atlanta) found that most patients in the cohort were black, and black patients had a similar probability of receiving IMV or dying during hospitalization compared with nonblack patients. Although a larger proportion of older patients had worse outcomes (IMV or death), a considerable proportion of patients aged 18–64 years who lacked high-risk conditions received ICU-level care and died (23% and 5%, respectively). Estimated case fatality among patients who received ICU care was high (37%–49%) but comparable with that observed in a smaller case series of COVID-19 patients in the state of Washington ( 5 ). Among hospitalized patients, 26% lacked high-risk factors for severe COVID-19, and few patients (7%) lived in institutional settings before admission, suggesting that SARS-CoV-2 infection can cause significant morbidity in relatively young persons without severe underlying medical conditions. Community mitigation recommendations (e.g., social distancing) should be widely instituted, not only to protect older adults and those with underlying medical conditions, but also to prevent the spread of SARS-CoV-2 among persons in the general population who might not consider themselves to be at risk for severe illness ( 6 ). The proportion of hospitalized patients who were black was higher than expected based on overall hospitalizations. At four affiliated hospitals, which accounted for 67% of patients in the cohort, 80% of cohort patients were black compared with 47% of hospitalized patients overall during March 2020 (D. Murphy, personal communication, April 7, 2020). Similarly, COVID-NET, which conducts population-based surveillance for laboratory-confirmed COVID-19–associated hospitalizations across 14 sites nationwide, ¶ found that black persons were disproportionately represented among hospitalized patients with COVID-19 ( 7 ). It is important to continue ongoing efforts to understand why black persons are disproportionately hospitalized for COVID-19, including the role of social and economic factors (including occupational exposures) in SARS-CoV-2 acquisition risk. It is critical that public health officials ensure that prevention activities prioritize communities and racial groups most affected by COVID-19. The findings in this report are subject to at least three limitations. First, the data are from a convenience sample of hospitalized adult patients in metropolitan Atlanta and southern Georgia, and data collection for this assessment was limited by the intention to conduct the investigation quickly. These patients do not necessarily represent all hospitalized patients with COVID-19 at those hospitals, or within Georgia. Second, patients were not tracked after discharge in this investigation. Finally, race and ethnicity were abstracted from medical records, and methods for recording these categories might have differed across hospitals, which could result in misclassification. This report provides valuable clinical data on a large cohort of hospitalized patients. Although frequency of IMV and fatality did not differ by race, black patients were disproportionately represented among hospitalized patients, reflecting greater severity of COVID-19 among this population. Public officials should consider racial differences among patients affected by COVID-19 when planning prevention activities. Approximately one quarter of patients had no high-risk conditions, and 5% of these patients died, suggesting that all adults, regardless of underlying conditions or age, are at risk for serious COVID-19–associated illness. Summary What is already known about this topic? Older adults and persons with underlying medical conditions are at higher risk for severe COVID-19. Non-Hispanic black patients are overrepresented among hospitalized U.S. COVID-19 patients. What is added by this report? In a cohort of 305 hospitalized adults with COVID-19 in Georgia (primarily metropolitan Atlanta), black patients were overrepresented, and their clinical outcomes were similar to those of nonblack patients. One in four hospitalized patients had no recognized risk factors for severe COVID-19. What are the implications for public health practice? Prevention activities should prioritize communities and racial groups most affected by severe COVID-19. Increased awareness of the risk for serious illness among all adults, regardless of underlying medical conditions or age, is needed.
              Bookmark
              • Record: found
              • Abstract: found
              • Article: found
              Is Open Access

              Characteristics Associated with Hospitalization Among Patients with COVID-19 — Metropolitan Atlanta, Georgia, March–April 2020

              On June 17, 2020, this report was posted online as an MMWR Early Release. The first reported U.S. case of coronavirus disease 2019 (COVID-19) was detected in January 2020 ( 1 ). As of June 15, 2020, approximately 2 million cases and 115,000 COVID-19–associated deaths have been reported in the United States.* Reports of U.S. patients hospitalized with SARS-CoV-2 infection (the virus that causes COVID-19) describe high proportions of older, male, and black persons ( 2 – 4 ). Similarly, when comparing hospitalized patients with catchment area populations or nonhospitalized COVID-19 patients, high proportions have underlying conditions, including diabetes mellitus, hypertension, obesity, cardiovascular disease, chronic kidney disease, or chronic respiratory disease ( 3 , 4 ). For this report, data were abstracted from the medical records of 220 hospitalized and 311 nonhospitalized patients aged ≥18 years with laboratory-confirmed COVID-19 from six acute care hospitals and associated outpatient clinics in metropolitan Atlanta, Georgia. Multivariable analyses were performed to identify patient characteristics associated with hospitalization. The following characteristics were independently associated with hospitalization: age ≥65 years (adjusted odds ratio [aOR] = 3.4), black race (aOR = 3.2), having diabetes mellitus (aOR = 3.1), lack of insurance (aOR = 2.8), male sex (aOR = 2.4), smoking (aOR = 2.3), and obesity (aOR = 1.9). Infection with SARS-CoV-2 can lead to severe outcomes, including death, and measures to protect persons from infection, such as staying at home, social distancing ( 5 ), and awareness and management of underlying conditions should be emphasized for those at highest risk for hospitalization with COVID-19. Measures that prevent the spread of infection to others, such as wearing cloth face coverings ( 6 ), should be used whenever possible to protect groups at high risk. Potential barriers to the ability to adhere to these measures need to be addressed. Patients were selected from six acute care hospitals and associated outpatient clinics affiliated with a single academic health care system in metropolitan Atlanta. Hospitalized patients were selected sequentially from hospital-provided lists of patients aged ≥18 years who were hospitalized with laboratory-confirmed COVID-19 (defined as a positive real-time reverse transcription–polymerase chain reaction [RT-PCR] test result for SARS-CoV-2) during March 1–30. The 220 selected hospitalized patients were described previously ( 2 ); hospitalizations included stays for observation and deaths that occurred in an emergency department (ED). All 311 nonhospitalized patients (i.e., evaluated at outpatient clinics or an ED and not admitted) aged ≥18 years with laboratory-confirmed COVID-19 during March 1–April 7, were included, unless they stayed for observation or died in an ED. During April 8–May 1, trained personnel abstracted information from electronic medical records on patient demographics, occupation, underlying conditions, and symptoms using REDCap software (version 8.8.0; Vanderbilt University) ( 7 ). This investigation was determined by CDC to be public health surveillance and by the Georgia Department of Public Health as an institutional review board–exempt public health evaluation. During March 1–April 7, 2020, the health care system operated a telephone triage line to manage incoming patients with COVID-19–compatible symptoms. Patients with signs of severe illness (e.g., severe shortness of breath, confusion, or hemoptysis) were directed to an ED. Other symptomatic persons could receive outpatient SARS-CoV-2 testing; however, testing was limited, and appointments were prioritized for health care personnel and persons considered to be at higher risk for severe COVID-19–associated illness (e.g., persons aged ≥65 years and those with underlying conditions, including diabetes mellitus, cardiovascular disease, and chronic respiratory disease). For analyses, race was categorized as black or other race; obesity was defined as body mass index ≥30 kg/m2; age was categorized as 18–44, 45–64, and ≥65 years; smoking was defined as being a current or former smoker; cardiovascular disease excluded hypertension alone; and chronic kidney disease included end stage renal disease. Health care personnel were classified as persons whose occupations included patient contact or possible exposure to infectious agents in a health care setting. † Univariable and multivariable logistic regressions were used to compare hospitalized with nonhospitalized patients; variables included age group, race, sex, smoking status, insurance status, obesity, hypertension, diabetes mellitus, cardiovascular disease, chronic respiratory disease, and chronic kidney disease. These variables were selected based upon risk factors for severe COVID-19 identified in other studies ( 3 , 4 ) rather than a defined statistical endpoint. Persons lacking a health care visit during which a medical history could be recorded (25) were excluded from analyses. Because of small sample sizes for some variables, Firth’s correction was used to provide bias-reduction ( 8 ). Because information on race was missing for nearly one quarter (23%) of nonhospitalized patients, sensitivity analyses were performed. Multivariable analyses were repeated and any patient with missing race was reclassified, first as black, then as other race. This method of sensitivity analysis was used to avoid implicit assumptions about the nature of missing data. Data were analyzed using SAS statistical software (version 9.4; SAS Institute). Compared with nonhospitalized patients (311), hospitalized patients (220) were older (median age = 61 years) and more frequently male (52%) and black (79%) (Table). Obesity, smoking, hypertension, diabetes mellitus, and chronic kidney disease were more prevalent among hospitalized patients than among nonhospitalized patients. Among those whose occupations were reported, nonhospitalized patients were more likely to be health care personnel (54%) than were hospitalized patients (4%). Fever or cough were commonly reported among both hospitalized and nonhospitalized patients, whereas shortness of breath was reported more often among hospitalized patients. Chills, headache, loss of smell or taste, or sore throat were reported more often among nonhospitalized patients. TABLE Characteristics of hospitalized and nonhospitalized patients with COVID-19 treated at six acute care hospitals and associated outpatient clinics in metropolitan Atlanta, Georgia, March 1–April 7, 2020 Demographic characteristic No. (%) of patients Nonhospitalized
(n = 311) Hospitalized
(n = 220) Sex Male 114 (36.7) 114 (51.8) Female 197 (63.3) 106 (48.2) Age group (yrs) Median age, yrs (IQR) 45.0 (33.0–58.0) 61.0 (45.0–70.0) 18–44 151 (48.6) 54 (24.6) 45–64 120 (38.6) 76 (34.6) ≥65 years 40 (12.9) 90 (40.9) Race White 90 (28.9) 29 (13.2) Black 139 (44.7) 174 (79.1) Other 10 (3.2) 7 (3.2) Missing race 72 (23.2) 10 (4.6) Ethnicity Hispanic 10 (3.2) 6 (2.7) Non-Hispanic* 197 (63.3) 203 (92.3) Missing ethnicity 104 (33.4) 11 (5.0) Occupation Health care personnel† 168 (54.0) 8 (3.6) Non-health care personnel 78 (25.1) 50 (22.7) Missing occupation 65 (20.9) 162 (73.6) Other characteristic Uninsured 20 (6.4) 22 (10.0) Missing insurance status 6 (1.9) 3 (1.4) Lives in a congregate living facility§ 1 (0.3) 12 (5.5) Pregnant 4 (1.3) 3 (1.4) Past or current smoking 37 (11.9) 54 (24.6) Missing smoking status 52 (16.7) 9 (4.1) Underlying condition Obesity¶ 104 (33.4) 123 (55.9) Missing BMI 84 (27.0) 11 (5.0) Cardiovascular disease 12 (3.9) 8 (3.6) Hypertension 101 (32.5) 142 (64.6) Diabetes mellitus 30 (9.7) 81 (36.8) Type 1 2 (0.6) 2 (0.9) Type 2 28 (9.0) 74 (33.6) Chronic respiratory disease 56 (18.0) 45 (20.5) Chronic kidney disease 7 (2.3) 38 (17.3) Chronic kidney disease without dialysis 6 (1.9) 24 (10.9) End stage renal disease 1 (0.3) 14 (6.4) Any transplant 1 (0.3) 10 (4.6) Liver disease 4 (1.3) 5 (2.3) HIV infection 10 (3.2) 5 (2.3) Cancer 28 (9.0) 6 (2.7) Rheumatological disease 4 (1.3) 6 (2.7) No. of underlying conditions** 0 169 (54.3) 44 (20.0) 1 88 (28.3) 77 (35.0) 2 44 (14.2) 65 (29.6) ≥3 10 (3.2) 34 (15.5) Symptoms at initial evaluation Fever†† 240 (77.2) 188 (85.5) Cough 275 (88.4) 180 (81.8) Shortness of breath (dyspnea) 135 (43.4) 149 (67.7) Headache 171 (55.0) 35 (15.9) Chills 178 (57.2) 58 (26.4) Arthralgia 44 (14.2) 9 (4.1) Myalgia 184 (59.2) 69 (31.4) Sore throat 146 (47.0) 21 (9.6) Loss of smell§§ 130 (41.8) 4 (1.8) Loss of taste 106 (34.1) 6 (2.7) Gastrointestinal symptoms¶¶ 137 (44.1) 88 (40.0) Median interval between symptom onset and testing, days (IQR) 4.0 (2.0–7.0) 6.0 (3.0–9.5) Abbreviations: BMI = body mass index; HIV = human immunodeficiency virus; IQR = interquartile range. * Includes non-Hispanic white and other races/ethnicities. † Includes any occupation with patient contact. § Includes nursing homes, assisted living facilities, shelters, and dormitories. ¶ BMI ≥30.0 kg/m2. ** Includes cardiovascular disease, hypertension, diabetes, chronic respiratory disease, and chronic kidney disease. †† Includes subjective or objective fever (≥100.4°F [38°C]). §§ Loss of smell or taste was first widely reported on April 23, 2020; differences in the periods of investigations between hospitalized and nonhospitalized patients might be responsible for differences in proportions reported. ¶¶ Includes abdominal pain, diarrhea, nausea, or vomiting. After controlling for age, sex, race, obesity, smoking status, insurance status, hypertension, diabetes mellitus, cardiovascular disease, chronic respiratory disease, and chronic kidney disease, characteristics independently associated with hospitalization were age ≥65 years (aOR = 3.4, 95% confidence interval [CI] = 1.6–7.4); black race (aOR = 3.2, 95% CI = 1.8–5.8); having diabetes mellitus (aOR = 3.1, 95% CI = 1.7–5.9); lack of insurance (aOR = 2.8, 95% CI 1.1–7.3); male sex (aOR = 2.4, 95% CI = 1.4–4.1); smoking (aOR = 2.3, 95% CI = 1.2–4.5); and obesity (aOR = 1.9, 95% CI = 1.1–3.3) (Figure). When missing race was reclassified as black or other race in sensitivity analyses, associations with hospitalization did not appreciably change for any variables. FIGURE Unadjusted and adjusted* odds ratios and 95% confidence intervals for hospitalizations in COVID-19 patients (n = 506 † ) evaluated at six acute care hospitals and associated outpatient clinics, by selected characteristics — metropolitan Atlanta, Georgia, March 1–April 7, 2020 Abbreviation: COVID-19 = coronavirus disease 2019. * Adjusted for age, sex, race, obesity, past or current smoking, insurance status, obesity, and other underlying conditions (hypertension, diabetes mellitus, cardiovascular disease, chronic respiratory disease, and chronic kidney disease). † Complete case analysis was used for multivariable analyses; therefore, n = 368 for the multivariable model. The figure is a logarithmic plot showing unadjusted and adjusted odds ratios and 95% confidence intervals for hospitalizations in 506 COVID-19 patients evaluated at six acute care hospitals and associated outpatient clinics in metropolitan Atlanta, Georgia, during March 1–April 7, 2020, by selected characteristics. Discussion Older age, as measured by age ≥65 years, was associated with hospitalization, consistent with previous findings ( 3 , 4 ). Hospitalized patients with COVID-19 were more likely to have diabetes mellitus and obesity than were nonhospitalized patients, suggesting a relationship between these underlying conditions and increased severity of illness. Diabetes mellitus has been determined to be associated with more severe illness in hospitalized patients with COVID-19 ( 4 ) and in persons with illness caused by Middle East respiratory syndrome coronavirus ( 9 ). Obesity has previously been reported to be overrepresented in hospitalized patients with COVID-19 ( 3 ) and associated with hospitalization ( 4 ). After controlling for other underlying conditions and patient characteristics, hypertension was no longer associated with hospitalization, suggesting that other underlying conditions or factors associated with hypertension might be partially responsible for the higher prevalence of hypertension in hospitalized COVID-19 patients. The COVID-19 pandemic has highlighted persistent health disparities in the United States. In a previous investigation of hospitalized patients in Georgia, including the subset of hospitalized patients reported here, the proportion of patients who were black was higher than expected based on overall hospitalizations during the same period ( 2 ). Racial and ethnic minority groups are at higher risk for severe complications from COVID-19 because of the increased prevalence of diabetes, cardiovascular disease, and other underlying conditions among racial and ethnic minority groups. § Social determinants of health might also contribute to the disproportionate incidence of COVID-19 in racial and ethnic minority groups, including factors related to housing, economic stability, and work circumstances. ¶ In the United States, black workers are more likely than other workers to be frontline industry or essential workers,** which increases their likelihood of infection with SARS-CoV-2 while performing their jobs. This and other social factors could contribute to the disproportionate diagnoses of COVID-19 among black persons in metropolitan Atlanta. Black race has previously been associated with increased hospitalization among COVID-19 patients ( 10 ); however, race has not been associated with mortality among patients who were hospitalized ( 2 , 10 ). The independent association between black race and hospitalization in this investigation remained, even when the analysis controlled for other characteristics (including diagnosed underlying conditions), suggesting underlying conditions alone might not account for the higher rate of hospitalization among black persons. This might indicate that black persons are more likely to be hospitalized because of more severe illness, or it might indicate that black persons are less likely to be identified in the outpatient setting, potentially reflecting differences in health care access or utilization or other factors not identified through medical record review. Additional research is needed to more fully understand the association between black race and hospitalization. CDC and state and local partners are working to ensure completeness of race and ethnicity data and will continue to analyze and report on racial and ethnic disparities to further elucidate factors and health disparities associated with COVID-19 incidence and illness severity. The findings in this report are subject to at least five limitations. First, although this investigation identified COVID-19 patients from a single health care system, hospitalized patients likely represent a broader population than nonhospitalized patients because those experiencing mild illness might have accessed outpatient services outside of this health care system or chosen not to seek care. Differences in these two populations caused by selection bias might therefore result in nonhospitalized patients differing beyond having milder illness than hospitalized patients. Thus, in this report, hospitalization status might not only represent severity of illness but also care seeking and potentially other confounding characteristics. Second, given that outpatient testing was prioritized for certain persons, older patients and those with underlying conditions might be overrepresented among outpatients receiving testing, resulting in underestimated odds ratios for hospitalization. In addition, overrepresentation of health care personnel in the outpatient setting could result in overestimation of odds ratios if health care personnel were disproportionately young or healthy. Third, outpatient visits did not always include a full medical history; thus, underlying conditions and other characteristics might be underreported. Fourth, data on age was stratified into groups, and because of sample size, smaller age group categories could not be explored. Finally, data on race, body mass index, and smoking status were missing for a substantial proportion of nonhospitalized patients. Data could not be disaggregated for other races or analyzed by ethnicity because of small sample sizes. This investigation found that age ≥65 years, black race, and having diabetes mellitus were independently associated with hospitalization. Among the underlying conditions included in the multivariable analysis, diabetes mellitus was most strongly associated with hospitalization. The reported association between black race and hospitalization, which remained even after controlling for diagnosed underlying conditions, suggests that underlying conditions alone might not account for the higher rate of hospitalization among black persons. Other factors that might explain higher rates of hospitalization include health care access, other social determinants of health, or the possibility of bias. Infection with SARS-CoV-2 can lead to severe outcomes, including death, and measures to protect persons from infection such as staying at home, social distancing ( 5 ), and awareness and management of underlying conditions should be emphasized for those at highest risk for hospitalization with COVID-19. To protect groups at high risk, measures that prevent the spread of infection to others, such as wearing cloth face coverings ( 6 ), should be used whenever possible. Potential barriers to the ability to adhere to these measures need to be addressed. Summary What is already known about this topic? Hospitalized COVID-19 patients are more commonly older, male, of black race, and have underlying conditions. Less is known about factors increasing risk for hospitalization. What is added by this report? Data for 220 hospitalized and 311 nonhospitalized COVID-19 patients from six metropolitan Atlanta hospitals and associated outpatient clinics found that older age, black race, diabetes, lack of insurance, male sex, smoking, and obesity were independently associated with hospitalization. What are the implications for public health practice? To reduce severe outcomes from COVID-19, measures to prevent infection with SARS-COV-2 should be emphasized for persons at highest risk for hospitalization with COVID-19. Potential barriers to the ability to adhere to these measures need to be addressed.
                Bookmark

                Author and article information

                Journal
                MMWR Morb Mortal Wkly Rep
                MMWR Morb Mortal Wkly Rep
                WR
                Morbidity and Mortality Weekly Report
                Centers for Disease Control and Prevention
                0149-2195
                1545-861X
                18 December 2020
                18 December 2020
                : 69
                : 50
                : 1895-1901
                Affiliations
                CDC COVID-19 Response Team; Bureau of Primary Heath Care, Health Resources and Services Administration, Rockville, Maryland.
                Author notes
                Corresponding author: Lisa Romero, eon1@ 123456cdc.gov .
                Article
                mm6950a3
                10.15585/mmwr.mm6950a3
                7745953
                33332299
                ac9908aa-cebf-4e5d-9012-a590ad45ba5c

                All material in the MMWR Series is in the public domain and may be used and reprinted without permission; citation as to source, however, is appreciated.

                History
                Categories
                Full Report

                Comments

                Comment on this article