0
views
0
recommends
+1 Recommend
0 collections
    0
    shares
      • Record: found
      • Abstract: found
      • Article: found
      Is Open Access

      Fat-to-blood recirculation of partially dysfunctional PD-1 +CD4 Tconv cells is associated with dysglycemia in human obesity

      research-article

      Read this article at

      Bookmark
          There is no author summary for this article yet. Authors can add summaries to their articles on ScienceOpen to make them more accessible to a non-specialist audience.

          Summary

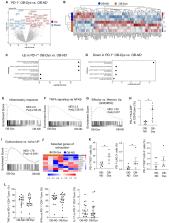
          Obesity is characterized by the accumulation of T cells in insulin-sensitive tissues, including the visceral adipose tissue (VAT), that can interfere with the insulin signaling pathway eventually leading to insulin resistance (IR) and type 2 diabetes. Here, we found that PD-1 +CD4 conventional T (Tconv) cells, endowed with a transcriptomic and functional profile of partially dysfunctional cells, are diminished in VAT of obese patients with dysglycemia (OB-Dys), without a concomitant increase in apoptosis. These cells showed enhanced capacity to recirculate into the bloodstream and had a non-restricted TCRβ repertoire divergent from that of normoglycemic obese and lean individuals. PD-1 +CD4 Tconv were reduced in the circulation of OB-Dys, exhibited an altered migration potential, and were detected in the liver of patients with non-alcoholic steatohepatitis. The findings suggest a potential role for partially dysfunctional PD-1 +CD4 Tconv cells as inter-organ mediators of IR in obese patients with dysglycemic.

          Graphical abstract

          Highlights

          • Dysglycemic obesity associates with reduced partially dysfunctional PD-1+CD4 Tconv in VAT

          • Dysglycemia induces alterations in the TCRβ repertoire of CD4 Tconv cells in obese VAT

          • Dysglycemia prompts an increased recirculation of PD-1+CD4 Tconv cells to the bloodstream

          • PD-1+CD4 Tconv cells accumulate in the liver of patients with dysglycemic

          Abstract

          Health sciences; Obesity medicine

          Related collections

          Most cited references60

          • Record: found
          • Abstract: found
          • Article: not found

          Gene set enrichment analysis: A knowledge-based approach for interpreting genome-wide expression profiles

          Although genomewide RNA expression analysis has become a routine tool in biomedical research, extracting biological insight from such information remains a major challenge. Here, we describe a powerful analytical method called Gene Set Enrichment Analysis (GSEA) for interpreting gene expression data. The method derives its power by focusing on gene sets, that is, groups of genes that share common biological function, chromosomal location, or regulation. We demonstrate how GSEA yields insights into several cancer-related data sets, including leukemia and lung cancer. Notably, where single-gene analysis finds little similarity between two independent studies of patient survival in lung cancer, GSEA reveals many biological pathways in common. The GSEA method is embodied in a freely available software package, together with an initial database of 1,325 biologically defined gene sets.
            Bookmark
            • Record: found
            • Abstract: found
            • Article: found
            Is Open Access

            Enrichr: interactive and collaborative HTML5 gene list enrichment analysis tool

            Background System-wide profiling of genes and proteins in mammalian cells produce lists of differentially expressed genes/proteins that need to be further analyzed for their collective functions in order to extract new knowledge. Once unbiased lists of genes or proteins are generated from such experiments, these lists are used as input for computing enrichment with existing lists created from prior knowledge organized into gene-set libraries. While many enrichment analysis tools and gene-set libraries databases have been developed, there is still room for improvement. Results Here, we present Enrichr, an integrative web-based and mobile software application that includes new gene-set libraries, an alternative approach to rank enriched terms, and various interactive visualization approaches to display enrichment results using the JavaScript library, Data Driven Documents (D3). The software can also be embedded into any tool that performs gene list analysis. We applied Enrichr to analyze nine cancer cell lines by comparing their enrichment signatures to the enrichment signatures of matched normal tissues. We observed a common pattern of up regulation of the polycomb group PRC2 and enrichment for the histone mark H3K27me3 in many cancer cell lines, as well as alterations in Toll-like receptor and interlukin signaling in K562 cells when compared with normal myeloid CD33+ cells. Such analyses provide global visualization of critical differences between normal tissues and cancer cell lines but can be applied to many other scenarios. Conclusions Enrichr is an easy to use intuitive enrichment analysis web-based tool providing various types of visualization summaries of collective functions of gene lists. Enrichr is open source and freely available online at: http://amp.pharm.mssm.edu/Enrichr.
              Bookmark
              • Record: found
              • Abstract: found
              • Article: not found

              Homeostasis model assessment: insulin resistance and beta-cell function from fasting plasma glucose and insulin concentrations in man.

              The steady-state basal plasma glucose and insulin concentrations are determined by their interaction in a feedback loop. A computer-solved model has been used to predict the homeostatic concentrations which arise from varying degrees beta-cell deficiency and insulin resistance. Comparison of a patient's fasting values with the model's predictions allows a quantitative assessment of the contributions of insulin resistance and deficient beta-cell function to the fasting hyperglycaemia (homeostasis model assessment, HOMA). The accuracy and precision of the estimate have been determined by comparison with independent measures of insulin resistance and beta-cell function using hyperglycaemic and euglycaemic clamps and an intravenous glucose tolerance test. The estimate of insulin resistance obtained by homeostasis model assessment correlated with estimates obtained by use of the euglycaemic clamp (Rs = 0.88, p less than 0.0001), the fasting insulin concentration (Rs = 0.81, p less than 0.0001), and the hyperglycaemic clamp, (Rs = 0.69, p less than 0.01). There was no correlation with any aspect of insulin-receptor binding. The estimate of deficient beta-cell function obtained by homeostasis model assessment correlated with that derived using the hyperglycaemic clamp (Rs = 0.61, p less than 0.01) and with the estimate from the intravenous glucose tolerance test (Rs = 0.64, p less than 0.05). The low precision of the estimates from the model (coefficients of variation: 31% for insulin resistance and 32% for beta-cell deficit) limits its use, but the correlation of the model's estimates with patient data accords with the hypothesis that basal glucose and insulin interactions are largely determined by a simple feed back loop.
                Bookmark

                Author and article information

                Contributors
                Journal
                iScience
                iScience
                iScience
                Elsevier
                2589-0042
                01 February 2024
                15 March 2024
                01 February 2024
                : 27
                : 3
                : 109032
                Affiliations
                [1 ]IRCCS Ospedale San Raffaele, Milan, Italy
                [2 ]San Marco Hospital GSD, Zingonia, Bergamo, Italy
                [3 ]Università Vita-Salute San Raffaele, Milan, Italy
                Author notes
                []Corresponding author petrelli.alessandra@ 123456hsr.it
                [4]

                Lead contact

                Article
                S2589-0042(24)00253-0 109032
                10.1016/j.isci.2024.109032
                10877684
                38380252
                f54cfecb-4028-4352-b70b-87f1f761011a
                © 2024 The Author(s)

                This is an open access article under the CC BY license (http://creativecommons.org/licenses/by/4.0/).

                History
                : 9 August 2023
                : 3 January 2024
                : 23 January 2024
                Categories
                Article

                health sciences,obesity medicine
                health sciences, obesity medicine

                Comments

                Comment on this article