- Record: found
- Abstract: found
- Article: found
Vaccination Coverage Among Children Aged 19–35 Months — United States, 2017
research-article

Holly A. Hill , MD, PhD
1
,
,
Laurie D. Elam-Evans , PhD
1 ,
David Yankey , PhD
1 ,
James A. Singleton , PhD
1 ,
Yoonjae Kang , MPH
1
12 October 2018
Read this article at
There is no author summary for this article yet. Authors can add summaries to their articles on ScienceOpen to make them more accessible to a non-specialist audience.
Abstract
The Advisory Committee on Immunization Practices (ACIP) recommends routine vaccination
by age 24 months against 14 potentially serious illnesses (
1
). CDC used data from the 2017 National Immunization Survey-Child (NIS-Child) to assess
vaccination coverage at national, state, territorial, and selected local levels among
children aged 19–35 months in the United States. Coverage remained high and stable
overall, exceeding 90% for ≥3 doses of poliovirus vaccine, ≥1 dose of measles, mumps,
and rubella vaccine (MMR), ≥3 doses of hepatitis B vaccine (HepB), and ≥1 dose of
varicella vaccine. Although the proportion of children who received no vaccine doses
by age 24 months was low, this proportion increased gradually from 0.9% for children
born in 2011 to 1.3% for children born in 2015. Coverage was lower for most vaccines
among uninsured children and those insured by Medicaid, compared with those having
private health insurance, and for children living outside of metropolitan statistical
areas* (MSAs), compared with those living in MSA principal cities. These disparities
could be reduced with greater awareness and use of the Vaccines for Children
†
(VFC) program, eliminating missed opportunities to vaccinate children during visits
to health care providers, and minimizing interruptions in health insurance coverage.
The NIS-Child is a random-digit–dialed telephone (cellular and landline) survey of
parents/guardians of children aged 19–35 months in the 50 states, the District of
Columbia, selected local areas, and U.S. territories.
§
NIS-Child coverage estimates are based on a provider-reported vaccination history.
Interviewers request contact information for all the child’s vaccination providers
and permission to contact each provider to obtain vaccination records for that child.
All identified providers are mailed an immunization history questionnaire to record
dates and types of vaccines administered; data from responding providers are combined
to create a synthesized vaccination history for each child. NIS-Child methods, including
weighting procedures, have been described.
¶
In 2017, the overall response rate** to the telephone interview portion of the survey
was 26.1%. Adequate provider-reported vaccination data
††
were available for 53.9% of children with a completed household interview, resulting
in a sample size of 15,333 children. T-tests on weighted data were used to evaluate
differences in coverage estimates by sociodemographic characteristics; differences
were considered statistically significant for p-values <0.05. CDC assessed changes
in survey accuracy, estimated components of difference between the 2016 and 2017 NIS-Child
estimates, and estimated linear trends in vaccination coverage by month and year of
birth using weighted linear regression.
§§
No evidence for change in survey accuracy from 2016 to 2017 was detected (
2
).
2017 Vaccination Coverage
Coverage was >90% for vaccination with ≥3 doses of poliovirus vaccine (92.7%), ≥1
dose of MMR (91.5%), ≥3 doses of HepB (91.4%), and ≥1 dose of varicella vaccine (91.0%)
(Table 1). Children were least likely to be up-to-date with ≥2 doses of hepatitis
A vaccine (HepA) (59.7%), the combined 7-vaccine series
¶¶
(70.4%), and rotavirus vaccination (73.2%). Coverage with HepB birth dose was also
low (73.6%).
TABLE 1
Estimated vaccination coverage among children aged 19–35 months, by selected vaccines
and doses — National Immunization Survey-Child, United States, 2013–2017*
Vaccine/Dose
Survey year
% (95% CI)
2013
2014
2015
2016
2017
DTaP†
≥3 doses
94.1 (93.2–95.0)
94.7 (94.0–95.4)
95.0 (94.4–95.5)
93.7 (92.8–94.5)§
94.0 (93.3–94.7)
≥4 doses
83.1 (81.8–84.3)
84.2 (83.0–85.4)
84.6 (83.5–85.7)
83.4 (82.1–84.6)
83.2 (82.0–84.3)
Poliovirus (≥3 doses)
92.7 (91.6–93.6)
93.3 (92.5–94.1)
93.7 (93.0–94.3)
91.9 (90.9–92.9)§
92.7 (91.9–93.5)
MMR (≥1 dose)¶
91.9 (90.9–92.7)
91.5 (90.6–92.4)
91.9 (91.0–92.7)
91.1 (90.1–92.0)
91.5 (90.6–92.3)
Hib
Primary series**
93.7 (92.7–94.5)
93.3 (92.5–94.1)
94.3 (93.7–94.9)
92.8 (91.8–93.6)§
92.8 (91.9–93.6)
Full series**
82.0 (80.7–83.3)
82.0 (80.7–83.2)
82.7 (81.5–83.8)
81.8 (80.5–83.0)
80.7 (79.4–82.0)
HepB
≥3 doses
90.8 (89.7–91.7)
91.6 (90.7–92.4)
92.6 (91.9–93.3)
90.5 (89.3–91.5)§
91.4 (90.5–92.3)
Birth dose††
74.2 (72.8–75.7)§
72.4 (70.9–73.9)
72.4 (71.0–73.7)
71.1 (69.5–72.7)
73.6 (72.0–75.2)§
Varicella (≥1 dose)¶
91.2 (90.2–92.1)
91.0 (90.1–91.9)
91.8 (91.0–92.5)
90.6 (89.6–91.5)
91.0 (90.1–91.8)
PCV
≥3 doses
92.4 (91.4–93.3)
92.6 (91.8–93.4)
93.3 (92.5–94.0)
91.8 (90.8–92.7)§
91.9 (90.9–92.8)
≥4 doses
82.0 (80.6–83.3)
82.9 (81.6–84.2)
84.1 (83.0–85.2)
81.8 (80.4–83.1)§
82.4 (81.1–83.6)
HepA
≥1 dose
83.1 (81.9–84.3)§
85.1 (84.0–86.2)§
85.8 (84.7–86.8)
86.1 (84.9–87.2)
86.0 (84.8–87.1)
≥2 doses§§
54.7 (53.1–56.3)
57.5 (55.9–59.1)§
59.6 (58.1–61.0)
60.6 (59.1–62.2)
59.7 (58.2–61.3)
Rotavirus¶¶
72.6 (71.1–74.0)§
71.7 (70.1–73.2)
73.2 (71.8–74.6)
74.1 (72.6–75.5)
73.2 (71.6–74.7)
Combined 7-vaccine series***
70.4 (68.8–71.9)
71.6 (70.2–73.1)
72.2 (70.9–73.6)
70.7 (69.2–72.2)
70.4 (68.9–71.9)
No vaccinations
0.7 (0.5–1.1)
0.8 (0.6–1.0)
0.8 (0.6–1.0)
0.8 (0.6–1.0)
1.1 (0.9–1.4)§
Abbreviations: CI = confidence interval; DTaP = diphtheria, tetanus toxoids, and acellular
pertussis vaccine; HepA = hepatitis A vaccine; HepB = hepatitis B vaccine; Hib = Haemophilus
influenzae type b conjugate vaccine; MMR = measles, mumps, and rubella vaccine; PCV = pneumococcal
conjugate vaccine.
* For 2013, children born during January 2010–May 2012; for 2014, children born during
January 2011–May 2013; for 2015, children born during January 2012–May 2014; for 2016,
children born during January 2013–May 2015; and for 2017, children born during January
2014–May 2016.
† Includes children who might have been vaccinated with diphtheria and tetanus toxoids
vaccine or diphtheria, tetanus toxoids, and pertussis vaccine.
§ Statistically significant (p<0.05) change in coverage compared with previous survey
year.
¶ Includes children who might have been vaccinated with measles, mumps, rubella, and
varicella vaccine.
** Hib primary series: ≥2 or ≥3 doses, depending on product type received; full series
includes primary series and booster dose, which includes receipt of ≥3 or ≥4 doses,
depending on product type received.
†† One dose of HepB administered from birth through age 3 days.
§§ Estimates of ≥2 doses of HepA are likely underestimates because a child could be
on schedule but not receive a second dose of HepA until age 41 months. This dose would
not be collected by NIS-Child, which includes children aged 19–35 months only.
¶¶ Includes ≥2 doses of Rotarix monovalent rotavirus vaccine (RV1), or ≥3 doses of
RotaTeq pentavalent rotavirus vaccine (RV5). The maximum age for the final rotavirus
dose is 8 months, 0 days.
*** The combined 7-vaccine series (4:3:1:3*:3:1:4) includes ≥4 doses of DTaP, ≥3 doses
of poliovirus vaccine, ≥1 dose of measles-containing vaccine, the full series of Hib
(≥3 or ≥4 doses, depending on product type), ≥3 doses of HepB, ≥1 dose of varicella
vaccine, and ≥4 doses of PCV.
Vaccination Coverage by Selected Characteristics
Coverage was lower (range = 2.6–6.9 percentage points) for children living in non-MSAs
than among those living in MSA principal cities for most vaccines (Table 2). Children
living in non-MSAs had a higher prevalence of having received no vaccinations (1.9%)
compared with children in MSA principal cities (1.0%).
TABLE 2
Estimated vaccination coverage among children aged 19–35 months, by selected vaccines
and doses, metropolitan statistical area (MSA) status,* and health insurance status
†
— National Immunization Survey-Child, United States, 2017
§
Vaccine/Dose
MSA status
% (95% CI)
Health insurance status
% (95% CI)
MSA, principal city (referent)
(n = 6,689)
MSA, non-principal city
(n = 5,846)
Non-MSA
(n = 2,798)
Private only (referent)
(n = 8,536)
Any Medicaid
(n = 5,714)
Other insurance
(n = 644)
Uninsured
(n = 439)
DTaP¶
≥3 doses
94.6 (93.4–95.6)
94.1 (92.9–95.0)
91.6 (89.1–93.6)**
96.5 (95.7–97.2)
92.6 (91.2–93.8)**
93.7 (90.7–95.8)**
78.2 (71.3–83.8)**
≥4 doses
85.0 (83.3–86.5)
82.6 (80.6–84.5)
78.1 (74.9–80.9)**
86.9 (85.2–88.5)
80.8 (78.9–82.5)**
83.6 (79.3–87.2)
62.4 (55.0–69.1)**
Poliovirus (≥3 doses)
93.2 (91.9–94.4)
92.9 (91.7–93.9)
90.1 (87.4–92.2)**
95.2 (94.3–96.0)
91.2 (89.6–92.5)**
92.7 (89.5–95.0)
77.9 (71.0–83.6)**
MMR†† (≥1 dose)
92.5 (91.2–93.6)
90.9 (89.3–92.3)
89.9 (88.0–91.6)**
93.7 (92.3–94.8)
90.4 (89.1–91.6)**
91.0 (87.5–93.6)
74.6 (67.5–80.6)**
Hib
Primary series§§
93.4 (92.2–94.5)
92.6 (91.1–93.9)
91.2 (88.7–93.2)
95.5 (94.6–96.2)
91.1 (89.5–92.5)**
92.2 (88.8–94.7)**
78.0 (71.1–83.7)**
Full series§§
81.6 (79.6–83.4)
80.7 (78.6–82.7)
77.3 (74.1–80.2)**
85.1 (83.2–86.9)
77.7 (75.6–79.7)**
78.8 (73.8–83.1)**
62.0 (54.6–68.9)**
HepB
≥3 doses
92.6 (91.3–93.7)
90.4 (88.7–91.9)**
90.7 (88.8–92.3)
93.3 (91.9–94.4)
90.4 (88.8–91.7)**
92.5 (89.4–94.7)
78.6 (71.8–84.1)**
Birth dose¶¶
73.6 (71.1–76.0)
72.8 (70.3–75.1)
76.6 (73.6–79.3)
73.0 (70.9–75.0)
74.7 (72.0–77.2)
71.8 (66.2–76.8)
68.7 (61.9–74.8)
Varicella†† (≥1 dose)
92.3 (91.0–93.4)
90.4 (88.7–91.8)
88.3 (86.2–90.1)**
92.9 (91.5–94.1)
90.4 (89.1–91.6)**
91.3 (88.0–93.8)
69.5 (62.2–76.0)**
PCV
≥3 doses
92.2 (90.5–93.6)
91.9 (90.4–93.2)
90.6 (88.0–92.6)
94.5 (92.9–95.7)
90.5 (88.9–91.8)**
91.0 (87.6–93.5)**
75.2 (67.9–81.2)**
≥4 doses
83.6 (81.7–85.4)
82.0 (79.9–84.0)
79.1 (75.9–81.9)**
87.6 (85.8–89.3)
78.9 (76.8–80.8)**
81.3 (76.8–85.2)**
59.0 (51.6–66.1)**
HepA
≥1 dose
87.2 (85.3–88.9)
85.7 (83.9–87.4)
82.5 (80.1–84.6)**
88.1 (86.5–89.6)
85.3 (83.5–87.0)**
86.1 (81.7–89.5)
63.3 (55.7–70.3)**
≥2 doses
61.1 (58.7–63.4)
59.2 (56.7–61.6)
56.5 (53.3–59.7)**
63.2 (61.0–65.2)
57.7 (55.2–60.2)**
61.1 (55.2–66.7)
35.7 (29.1–42.9)**
Rotavirus***
73.8 (71.3–76.2)
73.3 (70.7–75.7)
70.5 (67.3–73.6)
81.8 (79.8–83.6)
66.8 (64.2–69.4)**
67.4 (61.0–73.3)**
51.5 (44.2–58.7)**
Combined 7-vaccine series†††
71.9 (69.7–74.1)
69.8 (67.4–72.2)
66.8 (63.6–69.9)**
76.0 (73.9–77.9)
66.5 (64.1–68.9)**
69.2 (63.6–74.2)**
48.5 (41.2–55.8)**
No vaccinations
1.0 (0.7–1.3)
1.1 (0.8–1.5)
1.9 (1.3–2.7)**
0.8 (0.6–1.1)
1.0 (0.7–1.4)
—§§§
7.1 (4.6–10.8)**
Abbreviations: CI = confidence interval; DTaP = diphtheria and tetanus toxoids and
acellular pertussis vaccine; HepA = hepatitis A vaccine; HepB = hepatitis B vaccine;
Hib = Haemophilus influenzae type b conjugate vaccine; MMR = measles, mumps, and rubella
vaccine; PCV = pneumococcal conjugate vaccine.
* MSA status was determined on the basis of household-reported county and city of
residence and was grouped into three categories: MSA principal city, MSA nonprincipal
city, and non-MSA. MSA and principal city were as defined by the U.S. Census Bureau
(https://www.census.gov/geo/reference/gtc/gtc_cbsa.html). Non-MSA areas include urban
populations not located within an MSA as well as completely rural areas.
† Children’s health insurance status was reported by parent or guardian. “Other insurance”
includes the Children’s Health Insurance Program, military insurance, coverage via
the Indian Health Service, and any other type of health insurance not mentioned elsewhere.
§ Children in the 2017 National Immunization Survey-Child were born during January
2014–May 2016.
¶ Includes children who might have been vaccinated with diphtheria and tetanus toxoids
vaccine or diphtheria, tetanus toxoids, and pertussis vaccine.
** Statistically significant (p<0.05) difference compared with the referent group.
†† Includes children who might have been vaccinated with measles, mumps, rubella,
and varicella vaccine.
§§ Hib primary series: ≥2 or ≥3 doses, depending on product type received; full series
includes primary series and booster dose, which includes receipt of ≥3 or ≥4 doses,
depending on product type received.
¶¶ One dose of HepB administered from birth through age 3 days.
*** Includes ≥2 or ≥3 doses, depending on product type received (≥2 doses for Rotarix
[RV1] or ≥3 doses for RotaTeq [RV5]).
††† The combined 7-vaccine series (4:3:1:3*:3:1:4) includes ≥4 doses of DTaP, ≥3 doses
of poliovirus vaccine, ≥1 dose of measles-containing vaccine, the full series of Hib
(≥3 or ≥4 doses, depending on product type of vaccine), ≥3 doses of HepB, ≥1 dose
of varicella, and ≥4 doses of PCV.
§§§ Estimate not available because the 95% CI was ≥20.
Coverage among children insured by Medicaid was lower (2.5–15.0 percentage points,
depending on vaccine) than that among those with private insurance for all vaccines
assessed except the HepB birth dose (Table 2). The same pattern was observed among
uninsured children: coverage was substantially lower (14.7–30.3 percentage points)
than that among those privately insured. Prevalence of uninsured children in the 2017
NIS-Child was 2.8%. This lower vaccination coverage among the uninsured, Medicaid-insured,
and those living outside of MSAs was especially evident for diphtheria and tetanus
toxoids and acellular pertussis vaccine (DTaP), the full series of Haemophilius influenzae
type b conjugate vaccine (Hib), and pneumococcal conjugate vaccine (PCV), that require
a booster dose in the second year of life. In addition, the proportion of uninsured
children who had received no vaccinations (7.1%) was higher than that among those
with private insurance (0.8%). The proportion of unvaccinated children was similar
among children insured by Medicaid and those with private insurance. Among unvaccinated
children in the 2017 NIS-Child, 17.2% were uninsured.
Differences in vaccination coverage by race/ethnicity and poverty status in 2017 were
similar to those observed in previous years (Supplementary Table 1, https://stacks.cdc.gov/view/cdc/59414)
(
3
). Vaccination coverage also varied by state (Supplementary Table 2, https://stacks.cdc.gov/view/cdc/59415).
For example, estimated rotavirus coverage ranged from 64.7% in California to 85.1%
in Rhode Island. Coverage with MMR ranged from 85.8% in Missouri to 98.3% in Massachusetts;
MMR coverage was <90% for 11 states in 2017.
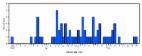
Trends in Vaccination Coverage
Coverage by month and year of birth remained stable during January 2012–January 2016
for most vaccines (Figure) (
2
). Coverage by age 2 years over 12 consecutive birth months declined by 0.5 percentage
points for ≥3 HepB doses and increased by 1.1 percentage points for ≥2 HepA doses
(
2
). Coverage with ≥2 HepA doses was higher by age 35 months than by age 24 months (e.g.,
75.3% versus 39.6% for children born January 2012) (
2
).
FIGURE
Estimated linear trend in coverage with selected vaccines* by age 24 months,
†
by month and year of birth
§
— National Immunization Survey-Child, United States, 2013–2017
Abbreviations: CI = confidence interval; DTaP = diphtheria, tetanus toxoids, and acellular
pertussis vaccine; HepA = hepatitis A vaccine; HepB = hepatitis B vaccine; Hib = Haemophilus
influenzae type b conjugate vaccine; MMR = measles, mumps, and rubella vaccine; PCV
= pneumococcal conjugate vaccine.
* Hib full series: ≥3 or ≥4 doses, depending on product type received (primary series
and booster dose). Rotavirus: ≥2 or ≥3 doses, depending on product type received (≥2
doses for Rotarix [RV1] or ≥3 doses for RotaTeq [RV5]).
† Except for rotavirus, vaccination coverage was assessed before the child reached
his/her 24-month birthday. The Kaplan-Meier method was used to account for censoring
vaccination status for children assessed before age 24 months. Rotavirus vaccination
was assessed before the child reached his/her 8-month birthday.
§ Estimated linear relationship between month and year of birth and vaccination coverage,
based on weighted linear regression analysis using the inverse of the estimated variance
of each point estimate to construct the weights. Estimated percentage point change
over 12 birth months: ≥4 DTaP −0.55 (95% CI = -1.20 to 0.10); ≥3 poliovirus -0.17
(-0.52 to 0.18); ≥1 MMR -0.11 (-0.58 to 0.35); Hib full series -0.51 (-1.13 to 0.11);
≥3 HepB -0.53 (-0.97 to -0.09); ≥1 varicella -0.05 (-0.53 to 0.42); ≥4 PCV 0.0 (-0.69
to 0.68); ≥2 HepA 1.13 (0.30 to 1.97); rotavirus 0.68 (-0.09 to 1.45).
The figure is a line graph showing the estimated linear trend in coverage with selected
vaccines in U.S. children by age 24 months, by month and year of birth, based on data
from the National Immunization Survey-Child during 2013–2017.
HepB birth dose coverage was higher in 2017 (73.6%) than in 2016 (71.1%) (Table 1).
Analysis of trends in HepB birth dose coverage by month and year of birth during January
2012–May 2016 indicated no change in coverage, although an increasing trend was estimated
for more recent births (January 2014–May 2016) (
2
). The percentage of unvaccinated children increased from 0.8% in 2016 to 1.1% in
2017. By annual birth cohort, the percentage of children with no vaccinations by age
2 years increased from 0.9% for children born in 2011 to 1.3% (47,700 children) for
those born in 2015 (Supplementary Figure, https://stacks.cdc.gov/view/cdc/59413),
representing an additional 18,400 unvaccinated children.
Discussion
Overall vaccination coverage among young children remained high and stable in the
United States in 2017. However, the findings from this survey highlight several opportunities
for improvement. Coverage was lower for most vaccines among uninsured and Medicaid-insured
children and among children living outside of MSAs. These disparities were larger
for vaccines that require a booster dose in the second year of life (e.g., DTaP, Hib,
and PCV). Although the number of children who have received no vaccinations by age
24 months has been gradually increasing, most children are still routinely vaccinated.
Continued evaluation of prevalence and reasons for nonvaccination is needed, as are
improvements in access to and delivery of age-appropriate vaccinations to all children.
CDC continues to examine barriers to early childhood vaccination, including assessing
obstacles to and parents’ experiences with accessing vaccination services.
Vaccination coverage differences by insurance status are concerning, given that children
insured by Medicaid and uninsured children are eligible for the VFC program, which
was designed to remove financial barriers by providing free vaccines to program participants.
However, other issues, such as unfamiliarity with the VFC program and how to access
it, transportation, child care, and convenience of clinic hours might also need to
be addressed if the goals of this important element of the immunization safety net
are to be fully realized. Lack of geographic proximity to vaccination providers, including
those who participate in the VFC program, can be a barrier to vaccination. The shortage
of health care providers, especially pediatricians, might partially explain the lower
coverage among children living in rural areas (
4
).
Vaccination coverage could be increased and sociodemographic and geographic disparities
reduced with increased administration of all recommended vaccines during provider
visits. A study of potentially achievable coverage estimated that 90% coverage would
have been attained many years ago for the recommended number of doses of DTaP, PCV,
and Hib for children aged 19–35 months if missed opportunities for administration
of the final doses of these vaccines had been eliminated (
5
). Reducing missed opportunities would promote timely receipt of all recommended vaccine
doses and decrease the amount of time that children remain vulnerable to vaccine-preventable
diseases.
The percentage of children who have received no vaccines has increased, reaching 1.3%
for children born in 2015, compared with 0.3% among those 19–35 months when surveyed
in 2001 (
6
). Some children might be unvaccinated because of choices made by parents, whereas
for others, lack of access to health care or health insurance might be factors. Unvaccinated
children in the 2017 NIS-Child were disproportionately uninsured: 17.2% of unvaccinated
children were uninsured, compared with 2.8% of all children. Evidence-informed strategies
addressing parents’ decisions about vaccinating their children could focus on both
programs and individual patients, such as vaccine delivery through school programs,
strong recommendations by providers to parents to vaccinate their children, and reinforcement
of the importance of community protection through vaccination (
7
).
Variation in coverage by health insurance and MSA status and the increasing percentage
of unvaccinated children raise concerns about possible pockets of susceptibility in
which children are not as well protected as national coverage estimates might indicate.
Measles was declared eliminated from the United States in 2000, yet outbreaks caused
by imported cases continue to occur each year; 118 measles cases were reported in
2017 (https://www.cdc.gov/measles/cases-outbreaks.html) (
8
). The continued occurrence of measles outbreaks in the United States underscores
the need to ensure high MMR coverage among all young children.
The findings in this report are subject to at least two limitations. First, low response
rates and lack of access to phoneless households could result in selection bias, which
might persist even with application of survey weights designed to minimize such bias.
Second, vaccination histories might be incomplete if not all providers were identified
or some of those identified chose not to participate. Bias in vaccination coverage
estimates has been evaluated in a sensitivity analysis accounting for these potential
errors, with results indicating underestimation of actual vaccination coverage by
4 to 5 percentage points (
9
).
Vaccination coverage among young children could be improved through higher participation
by both children and providers in the Vaccines for Children program. Consistent access
to health insurance is another important element of the immunization safety net. Barriers
to participation in the VFC program should be identified and eliminated so that all
eligible children have the opportunity to access recommended vaccines. A number of
evidence-based strategies have also been described that could enhance these efforts
to increase vaccination coverage, such as notifying parents when children are due
for a vaccination, establishing standing orders or policies that allow nonphysician
personnel to administer vaccines, and enhancing computerized immunization information
systems for tracking vaccinations (https://www.thecommunityguide.org/topic/vaccination)
(
10
). Continued vaccination coverage assessment using the NIS-Child can guide efforts
to improve vaccination coverage and protect children from vaccine-preventable diseases
and better understand the low but increasing prevalence of nonvaccination.
Summary
What is already known about this topic?
The Advisory Committee on Immunization Practices recommends routine vaccination by
age 24 months against 14 potentially serious illnesses.
What is added by this report?
In 2017, coverage with most recommended vaccines among children aged 19–35 months
remained stable and high but was lower in more rural areas and among uninsured or
Medicaid-insured children. A small but increasing proportion of children received
no vaccines by age 24 months.
What are the implications for public health practice?
Collaboration with state immunization programs, eliminating missed immunization opportunities,
and minimizing interruptions in insurance coverage are important to understand and
address coverage disparities among children eligible for the Vaccines for Children
program and those in rural areas.
Related collections
Most cited references7
- Record: found
- Abstract: found
- Article: not found
Addressing barriers to vaccine acceptance: an overview.
Noni MacDonald, Robb Butler, Eve Dubé (2017)
- Record: found
- Abstract: found
- Article: found
Measles Outbreak — Minnesota April–May 2017
Victoria Hall, Emily Banerjee, Cynthia Kenyon … (2017)
- Record: found
- Abstract: found
- Article: found
Advisory Committee on Immunization Practices Recommended Immunization Schedule for Children and Adolescents Aged 18 Years or Younger — United States, 2017
Candice L. Robinson, José Romero, Allison Kempe … (2017)