
Introduction
This article is the second of a three-part series about the archeological site at Abu Hureyra, Syria. Part #1 [1] concentrates on shock-fractured quartz as evidence of a local cosmic airburst; Part #2, this contribution, focuses on impact-related high-temperature meltglass, nanodiamonds, micro-spherules, iridium, and platinum; and Part #3 [2] proposes that multiple cosmic airbursts/impacts triggered Younger Dryas climate change that, in turn, initiated the transition from hunting-and-gathering to cultivation.
This study presents a wide range of new evidence supporting the hypothesis that a low-altitude airburst occurred ~12,800 years ago in northern Syria and destroyed the well-known prehistoric village of Abu Hureyra [3–5]. The site contains the world’s oldest known archaeological record that documents the transition from hunting-gathering to hunting-gathering-cultivating in a near-continuous sequence of habitation. In this paper, the term “airburst” refers to a low-altitude atmospheric detonation by a cosmic object, resulting in a high-temperature, hypervelocity jet of ionized gases and debris that reaches Earth’s surface.
The proposed impact event at Abu Hureyra is considered an integral part of the Younger Dryas Impact Hypothesis that proposes multi-continental cosmic airbursts/impacts at >50 locations spanning >100 million km2 across North and South America, Europe, Asia, and Africa [3, 6–31]. The impact stratum has been named the Younger Dryas (YD) boundary layer or YDB, a term used here to denote the YD onset rather than the YD termination [6]. “Younger Dryas” is narrowly used to describe a climatic event that triggered mainly cooling in the Northern Hemisphere at high- to mid-latitudes and mostly warming in high- to mid-latitudes of the Southern Hemisphere [20]. Here, ~12,800 years is used for the YD onset [15].
The YDB impact event is proposed to have destabilized ice sheets in the Northern Hemisphere, collapsed ice dams on proglacial lakes, released massive pulses of meltwater and icebergs, triggered a brief impact winter, and abruptly initiated severe YD climate change related to significant shifts in ocean circulation [6, 17, 18]. These climatic events resulted in cooler and more arid conditions across much of the Middle East, including at Abu Hureyra [32].
Generally, the YDB at most sites contains an assemblage of proposed impact-related proxies, including abundance peaks in a variable mix of nanodiamonds, magnetic and glassy micro-spherules, meltglass, carbon micro-spherules, glass-like carbon, soot, aciform carbon, fullerenes containing helium-3, and platinum-group elements [3, 5–12, 14–26, 33–35]. Individually, all have been observed in impact events, although they may also form in other ways. However, the entire suite of proxies is only known to be associated with cosmic impact events, including airbursts, and not with any other known non-impact mechanism. For example, abundance peaks in most of the same proxies were found in the impact layers for the Libyan Desert event ~29 million years ago, the Australasian tektite field ~680,000 years ago, and the Dakhleh airburst event ~145,000 years ago [3, 5, 6, 8, 20, 24, 36]. All three have no known craters, as proposed for Abu Hureyra.
Even so, some independent studies have disputed the impact origin of this assemblage of proxies at the YD onset. For two extensive independent reviews of the YDB hypothesis, see Sweatman [37, 38] and Powell [39], entitled “Premature Rejection in Science: The Case of the Younger Dryas Impact Hypothesis.” See Wolbach et al. [18] and Pino et al. [20] for reviews of multiple studies of YDB proxies and lists of selected publications opposing the YDB Hypothesis.
A previous investigation at Abu Hureyra [3, 5] (see Supporting Information in Text S1 in ref. [40]) identified the YD layer, reporting the presence of high-temperature, impact-related meltglass, melted mineral inclusions, charcoal, carbon micro-spherules, remanent magnetism, and other proxies. Building on this previous study, we present extensive new evidence of a wide range of potential impact-related proxies found in the YDB layer within the Abu Hureyra village. In addition, this contribution comprehensively investigates whether the proposed low-altitude airburst at Abu Hureyra is coeval with the YDB impact event reported at numerous sites on five continents [3, 6–30]. New evidence in support of this inferred cosmic airburst includes:
high-temperature Fe-rich and Ca-Si-rich micro-spherules;
high-temperature meltglass;
meltglass displaying siliceous plant imprints;
nickel-rich grains embedded in meltglass;
high-temperature pyromorphs of plant material;
meltglass that coats clay construction plaster;
meltglass that coats debitage or waste flakes from human toolmaking;
meltglass that coats vertebrate bone fragments;
partially- to fully-melted bone fragments.
Site setting
Abu Hureyra is a significant prehistoric archaeological site that formed a mound or “tell” in northern Syria adjacent to the Euphrates River floodplain [32] (Figure 1; see Text S2 in ref. [40]). The site, excavated in 1972 and 1973 [32], was located on the southwest bank of a bend in the Euphrates River, where a low terrace was above the flood level of the adjacent floodplain. A dam across the river was completed in 1974, and today, the site is submerged beneath the reservoir’s surface.

Location of Abu Hureyra. (A) Map of the Middle East, showing Abu Hureyra’s location along the Euphrates River in Syria. (B) Photograph of the massive Abu Hureyra tell, showing locations of several excavation trenches. (C) Map of the Abu Hureyra tell, showing locations of excavation trenches labeled A to G. Sediment samples from Trenches D, E, and G (small blue rectangles) contain the YDB layer, identified by peak abundances of impact-related proxies, including nanodiamonds, micro-spherules, meltglass, and platinum. (D) Artist’s depiction of the Abu Hureyra site at the YD onset (~12,800 cal BP), located along the floodplain edge close to a now-abandoned loop of the Euphrates River. Panels ‘B’ through ‘D’ are adapted from Moore et al. [32] and Moore et al. [5], usable under Creative Commons, CC by 4.0 (http://creativecommons.org/licenses/by/4.0/).
In 1972 and 1973, several trenches were excavated through human-deposited sandy Quaternary alluvium to bedrock, consisting predominantly of chalky limestone intercalated with thin beds of fine-grained chert and marls of Middle and Upper Eocene age [32]. Trench E was ~122 m from Trench D and ~110 m from Trench G; Trenches D and G are ~175 m apart [32] (Figure 1C). All trenches contain archaeological strata of anthropogenic origin deposited over bedrock [32].
Above bedrock in Trench E, Moore et al. [32] identified a bed of unconsolidated, brown, limey sand (thickness: ~10 to 50 cm) of Allerød age (range: ~13,380 to 12,800 cal BP). Just above the Allerød bed, they also identified a ~12,800-year-old layer, a thin bed of unconsolidated, dark-brown, charcoal-rich sand (thickness: ~3 to 5 cm at ~405 cm below surface (cmbs)) [32]. Subsequent studies reported that this dark layer is the YDB and contains abundance peaks in nanodiamonds, magnetic micro-spherules, high-temperature meltglass, carbon micro-spherules, platinum, nickel, cobalt, chromium, and other potential impact-related proxies [3, 5, 24]. This YDB stratum was overlain by a gray limey sand layer that varied in thickness from ~15 to 60 cm and ranges in age from ~12,800 to 11,700 cal BP [5, 32]. This bed, in turn, was overlain by several meters of Holocene-age brown limey clay derived from the erosion of successive mudbrick buildings that extend to the ground surface [32].
Excavations conducted by Moore et al. [32] revealed that humans continuously occupied the site from the late Epipaleolithic (~13,400 cal BP) through the early Neolithic (~7,500 cal BP). The archaeologists identified numerous occupational surfaces within all trenches at Abu Hureyra. Many of these surfaces displayed evidence of bioturbation by the villagers and animals, resulting in charcoal, seeds, and other organics being displaced upward and downward in the stratigraphic column, thus making accurate radiocarbon dating difficult. Moore et al. [5] concluded that this bioturbation also stratigraphically redistributed small quantities of impact-related meltglass and micro-spherules throughout the section.
Based on current analyses, Abu Hureyra is the earliest example of a human settlement catastrophically affected by a cosmic impact event. There also are younger impacts proposed to have negatively affected contemporary human populations, including the Holocene Native American culture by Tankersley et al. [41]; the Chiemgau impact event in Bavaria during the Bronze Age/Iron Age (Ernstson et al. [42, 43] Rappengluck et al. [44–50]); at Bronze Age Tall el-Hammam, Jordan (Bunch et al. [51]); in Northern Syria in the Bronze Age (Courty et al. [52–54]); and in western Kouvola, Finland in the Holocene (Ahokas [55]).
Moore et al. [32] reported that multi-room huts at Abu Hureyra before the YD onset were typically curvilinear in form with interconnected rooms (Figures 2 and 3). The huts were typically constructed over and around several shallow pits up to several meters in diameter and up to ~70 cm deep [32]. Numerous holes in the occupational surface indicate that vertical wooden posts formed the outside walls of the huts and, along with a few center posts, supported wooden roof logs [32]. The outer posts were covered with reed mats to form exterior walls, and the roofs were constructed of interwoven branches covered with reeds, grasses, and, possibly, animal skins [32]. Numerous pieces of dried clay with multiple, parallel impressions of reeds suggest that the walls and roofs were finished with clay plaster, characteristic of the wattle-and-daub construction method. Before the YD onset, the Abu Hureyra huts were constructed partially below ground. After the YD onset, the pits were observed filled with non-laminated, unconsolidated sediment containing meltglass, micro-spherules, charcoal, bones, and >5,000 tools, including scrapers, burins, perforators, and querns that were used for grinding grain [32]. New huts were constructed above ground over the filled-in, pre-existing pits.

Depiction of pre-YDB huts at Abu Hureyra. Multi-room thatched huts were constructed around interior pits up to ~2 m wide and 0.5 m deep. A kneeling human figure is shown near the pit house entrance. Numbers represent the approximate locations of samples examined. Sample ES15 came from just outside a pit house, E305 from within a pit house, E326 from a pit, E301 from a work area, and E313 from a work area outside a pit house entrance. Prefix “E” indicates that these samples are from Trench E. Note: sample numbers were assigned by original site excavators [32] and are not consecutively numbered by depth. Dates and numbers for samples and levels are listed in Tables S1–S3 in ref. [40]. Figure adapted from Fig. 5.20 in Moore et al. [32].

Plan view of Trench E. Matches top view of depiction in Figure 2. Pits within huts in Trench E (darker blue) are up to ~0.5 m deep and 2.0 m wide. Steps leading down into the pits are light blue. Red dots and lines represent approximate wall lines. Plant-imprinted AH meltglass was found in high abundances (15.8 g/kg) in the YDB layer in sample E301 (gold circle at lower right). The pithouse contains AH glass at 0.3 g/kg (E305). After the YDB, the pits became filled with debris and were never re-used by the villagers. Bones, charcoal, seeds, and tools are intermixed with meltglass, nanodiamonds, micro-spherules, and other possible impact-related proxies. This drawing is modified from Moore et al., Fig. 5.14 [32].
Radiocarbon ages and stratigraphic framework
The stratigraphic sequence at Abu Hureyra was previously dated by Moore et al. [32], who reported >30 radiocarbon ages from charcoal, organic material, grains, and bones collected from Trench E. Moore et al. [32] excluded all but 18 of those dates as being anomalously too old or too young based on Bayesian analysis. The Combine routine in OxCal combined three radiocarbon dates on the same bone. The calibrated ages are reported in calendar years before the present (BP) with a 68% Confidence Interval (CI), approximately equivalent to a 1-sigma standard deviation of the age uncertainty. Sample E301 from the YDB bed in a work area just outside of the pit house (Figures 2–4) has a Bayesian-modeled calibrated radiocarbon age of 12,800 ± 40 cal BP at 68% CI (Figure 5; see Tables S1 and S2 in ref. [40]). This age falls within the YDB age range of 12,835 to 12,735 cal BP, previously published in Kennett et al. [15] for ~54 widely distributed sites on four continents (North America, South America, Europe, and Asia).

Stratigraphy of Abu Hureyra Trench E. The YDB layer (red lines) dating to the YD onset is shown for all four walls of 7 × 7-meter Trench E, based mainly on biostratigraphy and radiocarbon dating [32]. (A) Facing the north wall of the trench, (B) facing the east wall, (C) facing the south wall, and (D) facing the west wall. Except for the YDB layer, the strata in Trench E are mostly poorly defined horizontal beds displaying subtle changes throughout the vertical sequence. Circled numbers refer to levels from original excavation [32], several of which are identified in Tables S2 and S3 in ref. [40]. Drawing modified from Figs. 5.5 through 5.8 in Moore et al. [32].

Bayesian age-depth model. Using OxCal v4.4.4 [56] with the IntCal20 calibration curve, the Bayesian-modeled calibrated YDB age was determined to be 12,800 ± 40 cal BP at 68% CI. Horizontal red dashed lines mark the proxy-rich sample. Laboratory numbers of 14C dates shown on the left are preceded by level numbers (e.g., ‘E54’) when available. The age-depth model spans ~380 years from 13,050 to 12,670 cal BP in mean calibrated ages over a sedimentary profile of ~1.1 m. Dates falling within the YDB interval are shown in green text. The onset of the YD climatic episode was initially recognized by Moore et al. [32] at the level indicated.
Results and interpretations
YDB proxies examined
For this study, many potential impact-related proxies were analyzed in sediment samples spanning >3000 years from ~13,300 to ~10,200 cal BP with a significant focus on ~380 calendar years duration from 13050 to 12,670 years. The individual data for the proxies are described, interpreted, and discussed in detail in the following sections (see Table S3 in ref. [40]). Although some proxies have previously been identified and discussed [3, 5], we here present data for new proxies and new observations and interpretations for previously discussed proxies.
Nanodiamonds
Our investigation of nanodiamonds employed multiple techniques: (i) concentrating potential nanodiamond-rich residue and then analyzing any residue, if present, using all of the following: (ii) scanning transmission electron microscopy (STEM); (iii) high-resolution transmission electron microscopy (HRTEM); (iv) Fast Fourier Transform (FFT) analyses of the HRTEM images; (v) selected-area electron diffraction (SAD); (vi) energy-dispersive X-ray spectroscopy (EDS); (vii) energy-filtered TEM (EFTEM); (viii) dynamic conical dark-field imaging. Nanodiamond abundance was determined following the protocol presented by Kinzie et al. [24].
All available bulk sediment samples (n=7) were investigated for nanodiamonds (see Table S3 in ref. [40]), which were not detected in the six samples above or below the YDB layer. They were only observed in sample E301, the YDB layer, with a large abundance peak of ~443 parts per billion (ppb) (see Table S3 in ref. [40]), collected from a work area outside a pit house. This nanodiamond-rich layer dates to ~12,800 ± 40 cal BP. Imagery acquired by STEM, HRTEM, and EFTEM indicates that YDB nanodiamonds are spherical, subrounded in shape, and some are polycrystalline. Several diamond allotropes were identified, including cubic diamonds, n-diamonds, i-carbon, and lonsdaleite-like crystals [24] (Figures 6–8). The nanodiamond polytype known as n-diamond displays all lattice d-spacings that are characteristic of cubic diamonds (Figures 6 and 7; see Table S5 in ref. [40]), and therefore, n-diamonds are sometimes considered to be either cubic diamond variants or flawed cubic diamonds [8, 16, 24, 33, 60]. Because of this, the term “n-diamonds” is used here to represent cubic diamonds and n-diamonds [24]. The term “lonsdaleite-like” was suggested previously [24] because the observed characteristics of these crystals closely match lonsdaleite, but these were too rare for definitive identification. Furthermore, it has been proposed that lonsdaleite is not a separate type of diamond but instead represents faulted and twinned cubic diamonds [61]. In any event, nanodiamonds matching the characteristics of lonsdaleite are reported here from the YDB stratum at AH (Figure 8).

STEM and HRTEM analyses of AH nanodiamonds. (A) STEM images of thousands of nanodiamonds. Sizes range from <1 to ~15 nm at an estimated abundance of 443 parts per billion or ppb. No nanodiamonds were observed in strata above or below the YDB layer (sample E301 at 405 cm depth). (B) Manually colorized HRTEM phase map of a cluster of n-diamonds/cubic diamonds (red). Blue denotes a non-crystalline carbon matrix with short-range ordering. The largest ND in view measures ~8 nm in width. EDS indicates the nanodiamond cluster is >98 wt% carbon with <2 wt% oxygen. The group displays twinning, i.e., one nanodiamond crystal often shares a common lattice boundary with an adjacent crystal. Yellow lines correspond to n-diamond crystallography, marking {111}-type lattice planes at 2.06-Å spacing and {200}-type lattice planes at 1.78-Å spacing. (C) The selected area diffraction pattern (SAD) of some nanodiamonds in panel ‘A’ shows four d-spacings characteristic of n-diamond. Reprinted by permission from Kinzie et al. [24] (D) SAD of some nanodiamonds, showing diffraction pattern characteristic of i-carbon. From sample E301, 405 cm depth.

EFTEM images of spherical clusters of polycrystalline nanodiamonds. EFTEM imagery is an elemental mapping technique used to determine whether an object is composed of carbon and, if so, to determine its atomic bonding (sp2 or sp3 , in which each carbon atom bonds to three or four other carbon atoms, respectively). (A) A “zero-loss” image, showing dark, round clusters of objects (selected examples numbered 1–6), was determined by EDS to be carbon and by SAD and FFT to be polycrystalline clusters of nanodiamond crystals. (B) “Jump ratio” image, confirming that white clusters numbered 1 through 6 are composed of carbon. White areas correspond to sp3 bonding, characteristic of diamonds but not of graphite, graphene, graphane or other forms of carbon. The black areas are the TEM grid film composed of amorphous carbon with only sp2 bonding. Nanodiamonds were extracted from sample E301, 405 cm depth, from a work area outside a pit house.

HRTEM, SAD, and dynamic conical dark-field images of nanodiamonds from Abu Hureyra. (A) HRTEM image shows dark clusters on a brighter background (grid film). EDS scans of this area indicate the composition is >98 wt% carbon with >2 wt% oxygen, the same for all images shown here. (B) Same view as in panel ‘A’. Dynamic conical dark-field imaging of objects is used to identify n-diamonds/cubic diamonds (green), i-carbon (blue), and lonsdaleite-like crystals (red). RGB images were merged from separate red, green, and blue images (channels). As is common practice, each figure and each RGB channel was globally adjusted for brightness, contrast, tone balance, color balance, and sharpness. (C) HRTEM close-up of selected objects in panel ‘A’. Lattice spacings indicate that both crystals are n-diamonds/cubic diamonds with {111}-type lattice planes at 2.06-Å spacing and {200}-type lattice planes at 1.78-Å spacing. (D) The SAD pattern of the same group of objects in panel ‘A’ shows multiple d-spacings, three of which are characteristic of different nanodiamond polytypes. A d-spacing of 2.53 Å occurs only in i-carbon (blue) and not in the other polytypes shown; 2.06 Å (green) occurs in n-diamond, cubic diamond, and lonsdaleite but not in i-carbon. A d-spacing of 1.50 Å occurs in lonsdaleite (red) but not the others. The beam blocker was added manually. (E) Spectrum from electron energy loss spectroscopy (TEM-EELS) for Abu Hureyra nanodiamonds, consistent with a mix of diamond polytypes shown in panels ‘A’ and ‘B.’ Dotted reference lines are shown for n-diamonds [57] (n-D), i-carbon [58] (i-C), and lonsdaleite [59] (lon). Vertical scales differ. From sample E301, 405 cm depth.
YDB abundance peaks in silica-rich and iron-rich micro-spherules
The charcoal-rich sandy YDB bed at Abu Hureyra contains abundance peaks in mostly silica-rich (Si-rich) micro-spherules (>95%) but also a few iron-rich types. Although these objects are referred to as “micro-spherules,” in reality, they display a wide range of morphologies, including rounded, sub-rounded, ovate, oblate, elongated, teardrop, dumbbell, clustered, and broken (Figures 9 and 10). They range from optically opaque to translucent, and their colors include black, green, tan, and white. Micro-spherules already broken or sectioned for this study are typically hollow, each containing a single, large central vesicle surrounded by a rim containing numerous smaller vesicles (Figure 9B).

Si-Ca-rich Micro-spherules from Abu Hureyra. (A) SEM image of two joined micro-spherules, one ~1.2 mm wide and the other ~2.4 mm. Si-Ca-rich micro-spherules are the most common type observed, with an abundance of ≥95%. (B) SEM image of sectioned 1.8-mm-wide hollow spherule. (C) Close-up SEM image of ~900-μm-wide spherule. Orange arrows mark some metal-rich nuggets, mainly enriched in Fe and PGEs. Yellow arrows point to flow marks indicative of melting. (D) SEM image of nuggets embedded in 2.9-mm-wide subrounded meltglass. All objects are from sample E301 at a depth of 405 cm.
Abu Hureyra meltglass. (A) Photomicrograph of ~150 fragments of typical AH meltglass and glassy micro-spherules. (B) SEM image of a broken 2.6-mm-long fragment of meltglass showing a highly vesicular interior. (C) SEM image of irregularly shaped 4.0-mm-long meltglass fragment. Vesicles are exposed on the surface. From sample YDB E301, 405 cm depth from a work area outside a pit house.
The micro-spherules at Abu Hureyra were found in an abundance of ~595 micro-spherules/kg (see Table S3 in ref. [40]) within sample E301 of the charcoal-rich YDB sand bed in Trench E at 405 cm depth from a work area outside a pit house. They have a Bayesian-modeled age of 12,800 ± 40 cal BP. Micro-spherules were not detected in other beds in Trench E or other trenches. The average size of the AH micro-spherules is ~1400 μm (range: 20 μm to 1 cm), much larger than the average diameter of 135 μm (mean = 30 μm) reported for other YDB sites [10]. Fe-rich micro-spherules are commonly smaller than ~100 μm and display distinctive dendritic or platy textures (“soccer-ball-like”), whereas the Si-rich micro-spherules have primarily smooth surfaces. Larger Fe-rich micro-spherules typically have rough surfaces.
Fifty-one SEM-EDS analyses show that Abu Hureyra micro-spherules contain variable abundances of primarily three major oxides: SiO2 (average: 55.1 wt%; range: ~3.3 to 91.8 wt%), CaO (average: 10.4 wt%; range: 0 to 32.2 wt%), and FeO (average: 11.6 wt%; range: ~0.6 to 97.4 wt%). The abundances of all other major oxides range from 0 to ~9.4 wt% (see Table S6 in ref. [40]). Approximately 95% of the micro-spherules were enriched in Si, Ca, and O (SiO2 plus CaO at ≥50 wt%), and the remaining ~5% of micro-spherules were Fe-enriched (FeO at ≥50 wt%). NiO abundances in Abu Hureyra micro-spherules average 0.1 wt% compared to no detectable NiO in Abu Hureyra sediment. The compositions of Abu Hureyra micro-spherules closely match those of bulk sediment and clay-silt aggregates collected from the Abu Hureyra village (see Table S6 in ref. [40]).
Meltglass at Abu Hureyra
The analyses of 24 sediment samples across a ~5-m-thick profile in Trench E revealed a large abundance peak in meltglass. This peak occurred within a 3- to 5-cm-thick, dark, charcoal-rich, sandy bed at ~405 cm depth below the surface (sample E301) from a work area at the entrance to a pit house. Glass fragments also were found within unlaminated debris that filled interior pits (sample E326), as well as within demolished pit houses (sample E305) and outside of pit houses (samples ES15 and E313, reworked from the YDB layer) (Figure 2 and 3). Concentrations are at 15.8 g/kg or 1.6 wt% of bulk sediment [3] (see Table S3 in ref. [40]). YDB meltglass in high quantities is closely intermixed with prehistoric tools, debitage from toolmaking, grinding stones, charcoal from campfires, charred grains, and animal bones. Quantitative analysis of 5 samples in younger deposits above the YDB bed in Trench E yielded small quantities of AH meltglass, averaging 0.01 g/kg (range: 0.0 to 0.23 g/kg); two samples contained none (see Table S3 in ref. [40]). These concentrations are ~70× to 780× less than the 15.8 g/kg of meltglass in the YDB bed in Trench E.
In a random survey of ~1,000 fragmented or whole pieces of YDB meltglass from Trench E, the observed sizes ranged from ~200 μm to 1.4 cm, with most in the 0.5 to 1 mm range. Because smaller pieces are challenging to identify, many more uncounted meltglass fragments <200 μm in size may remain in each sample. The fragments of AH meltglass occasionally found above and below the YDB were mainly within the smaller size range of YDB meltglass (0.5 to 1 mm range).
For all trenches, most smaller fragments appear as rough-textured aerodynamic spheroids and ovoids (Figure 10A), whereas most larger glass fragments have irregular shapes (Figure 10A; see Fig. S1 in ref. [40]). Using SEM-EDS, the average composition of AH meltglass was SiO2 = 50.94 wt%; CaO = 16.65 wt%; FeO = 9.83 wt%; and Al2O3 = 9.03 wt% (see Table S7 in ref. [40]). The average NiO concentration in AH meltglass is 0.1 wt% compared to none in AH sediment.
In addition to Trench E, meltglass fragments were found in Trenches D and G, spread across a total area of ~0.67 ha. D and G each have a now-buried sub-soil containing meltglass that was on the surface near the time of the nearby YDB-age settlement in Trench E. In Trench D, about 122 m SW of Trench E (Figure 1C), only two sediment samples (layers 164 and 178; Fig. 8.26 in Moore et al. [32]) were available for analysis across the interval of interest; neither were dated and neither included the YDB layer. One sample from level 164 was available from a clay floor beneath a late-YD mudbrick wall and so, postdates the YDB. This sample contains small amounts of meltglass at concentrations of 0.4 g/kg, similar to concentrations in post-YDB strata in Trench E. Most fragments are 0.5 to 1 mm in diameter, with the largest being 5 mm across. One other available sample from a Holocene-age occupation layer in Trench D contained no detectable glass.
From Trench G (Figure 1C), about 110 m SE of Trench E, two samples (layers 30 and 68; Fig. 8.61 in Moore et al. [32]) were examined from the top of a thin pre-YDB subsoil atop bedrock. Neither were dated, and neither included the YDB layer. The sample from level 68 below the YDB contains meltglass at concentrations of ~0.01 g/kg of sediment, and the other, from a few centimeters above the first sample, contained only trace amounts of meltglass (<0.01g/kg). Two other samples well above the YDB in Trench G contained no detectable meltglass.
In summary, AH meltglass was present in undated non-YDB samples from Trenches D and G; YDB-age samples from the trenches were unavailable. Meltglass fragments in both trenches were small and in low abundances, comparable to levels above and below the YDB levels in Trench E (size range: 0.5 to 1 mm; abundances: 0 to 0.66 g/kg). If those non-YDB values are the same as in the YDB, then the most conservative average amount of AH meltglass in three trenches (D, E, and G) spanning ~0.67 ha is 5.4 g/kg. If this value represents the area, then an estimated amount of meltglass across the vicinity is ~100 tonnes per km2.
Potential sources of meltglass and micro-spherules
To investigate the potential origin of meltglass, we plotted major element concentrations of AH meltglass and micro-spherules against Earth’s average crustal abundances [62] (see Fig. S2a in ref. [40]); particles from Comet Wild [63] (see Fig. S2b in ref. [40]); cosmic micro-spherules from Antarctica [64–66] (see Fig. S2c in ref. [40]); ordinary chondrites [67] (see Fig. S2d in ref. [40]); eucrite meteorites [67] (see Fig. S2e in ref. [40]); and achondrite meteorites [67] (see Fig. S2f in ref. [40]). AH meltglass and micro-spherules are dissimilar to all of them. For example, Na, K, and other low-temperature volatiles are often depleted in meteorites and other cosmic bodies [68]. However, AH glass has higher concentrations of Na and K than extraterrestrial (ET) materials, and both are lower than for crustal abundances.
Concentrations of Na and K in AH micro-spherules and meltglass were also compared to local AH Ca-rich bulk sediment and clay-silt (Figure 11A). Elemental abundances in AH meltglass and micro-spherules are similar to those of local surficial sediments with notable differences. AH meltglass is deficient in the volatile low-temperature elements K (depleted 2.0 to 2.7×) and Na (depleted 1.5 to 2.2×) (Figure 11B). Given that Na2O boils at 1950°C and K2O decomposes at 740°C, these depletions in AH meltglass appear to have resulted from high temperatures that evaporated these volatiles. AH meltglass is also enhanced in some refractory elements, e.g., Mn (enriched 3.2 to 3.7×), Cr (enriched 6.4 to 19.3×), and Ni (enriched >45×), which are typically enriched in meteoritic material.

Depletion and enrichment of elements. (A) AH meltglass values (blue line) represent the average of three sets of values from Bunch et al. [3], Moore et al. [5], and this contribution (see Table S7 in ref. [40]). For AH meltglass, most average concentrations of major elements (in descending wt%) closely match those of AH bulk sediment (green line) and clay-silt (orange line) with notable exceptions: Na and K are depleted below sediment and clay concentrations, and Cr, Ni, and Mn are enriched (blue dotted arrows). Because Ni was below detection in bulk sediment, values of 0.01 wt% were used for plotting on the semi-log scale. (B) “Times different” represents the number of times that significant elemental abundances in AH bulk sediment and clay-silt are depleted (K and Na) or enriched (Mn, Cr, Ni) relative to normalized abundances for AH meltglass. Potential ET elements are enriched, and elements susceptible to volatilization are depleted. Notably, Ni is enriched >45× above sediment and clay concentrations (blue dotted arrow).
Siliceous plant imprints on YDB meltglass
Many fragments of meltglass at Abu Hureyra display one or more patterned imprints, typically appearing as fine-detailed, parallel ridges and grooves (Figures 12 and 13; see Fig. S3 in ref. [40]). The total amount of AH meltglass recovered equals 1.6 wt% of bulk sediment, of which distinctively patterned fragments represent ~40%. AH imprinted glass typically exhibits a three-layered morphology: first, Ca-Al-Si-rich glass on one side, inferred to have been the upper surface; second, silicified plant material; third, a blended transition layer between the glass layer and the plant material. SEM-EDS analyses indicate the chemistry of the plant imprints averages ~80 wt% SiO2 (range: 65–100 wt%) with an average of ~20 wt% carbon (range: 10–35 wt%). The composition of non-imprinted AH meltglass that contacts the imprinted glass is distinctly different, mainly containing a mix of Si, Ca, Fe, Al, and Mg oxides, with only a few weight percent of carbon. Its composition is the same as non-imprinted meltglass. Imprinted glass fragments were found in all YDB samples excavated from non-laminated, monolithic debris that filled pits within demolished huts (sample E326); from sediment inside destroyed huts (sample E305); and from sediment outside pit houses (samples ES15, E301, and E313).

Plant imprints on surfaces of AH meltglass. (A)–(C) Photomicrographs of AH meltglass (AG) with silicified plant imprints (P). (D)–(F) SEM images of siliceous plant imprints (P) on AH meltglass (AG). (G)–(I) Multi-element SEM-EDS maps of the same objects in the images above. From sample E313, 413 cm depth. Panels are from Moore et al. [5], usable under Creative Commons, CC by 4.0 (http://creativecommons.org/licenses/by/4.0/).

Additional plant imprints on AH meltglass. (A) and (B) Composite photograph of living reed leaf on a stem that is ~6 mm wide [69], compared to two photomicrographs of meltglass (AG) with carbon-infused plant fiber imprints (P). Not to exact scale. The upper one, panel ‘A’, matches the curvature and pattern on the reed stem, and the meltglass in panel ‘B’ matches the flat ribbed leaf pattern. (C) The photomicrograph of ~1.6-mm-long meltglass fragment, as in panel ‘B,’ shows meltglass (AG) with plant imprints (P). Dark meltglass in panel ‘C’ contains elevated carbon (C) concentrations, consistent with the combustion of carbon-rich organic material upon contact with molten glass. Lighter-colored AH non-imprinted meltglass matrix contains only a few percent carbon. (D) SEM image of same AH meltglass fragment. From sample E301, 405 cm depth. (E) Photomicrograph of ~1.5-millimeter fragment of AH meltglass superimposed on plant leaf [69]. The lower image is of the opposite side, showing ribbed imprints that match those on the leaf. The upper meltglass image displays a smoother surface, suggesting the glass was molten with very low viscosity when it landed on the leaf. (F) SEM image of the bottom side of AH meltglass in panel ‘E.’ From sample E301, 405 cm depth.
Melted quartz, zircon, and chromite grains in meltglass
To investigate the maximum possible temperatures to which AH meltglass was subjected, Moore et al. [5] used SEM-EDS to search for melted minerals with high melting points on the outer and interior sectioned surfaces of AH meltglass. They reported finding plant-imprinted meltglass embedded with fully-melted minerals, including chromite grains that melted at ~2190°C (Figure 14A), quartz at ~1713°C (Figure 14B), and zircon at ~1687°C (Figure 14C). For comparison, a chromite grain is shown that was experimentally heated to 1700°C (Figure 14D). These results indicate that AH meltglass was exposed to extreme temperatures above the glass’s melting point of ~1100°C and possibly above the melting point of quartz at >1720°C. Similar plant-imprinted meltglass (comprised of C, O, Mg, Al, and Si) has been previously reported by Schultz et al. [70], who conducted heating experiments that showed temperatures above 1500°C were necessary to entrap organics and that lower temperatures resulted only in carbonization without preserving siliceous plant structures.

High-temperature melted minerals in plant-imprinted meltglass. SEM images of (A) two chromite grains that thoroughly melted at ~2190°C, (B) quartz grain that thoroughly melted at ~1713°C, and (C) zircon grain that thoroughly melted at ~1687°C. These grains indicate that the meltglass was exposed to temperatures of >2000°C. (D) At 1700°C in a furnace experiment, a 245-μm-long chromite grain displayed moderate surface melting with limited diffusion into the matrix (cf. Methods). These results indicate that the melted chromite grains in panel ‘A’ were exposed to temperatures greater than 1700°C. Panels are adapted from Moore et al. [5], usable under Creative Commons, CC by 4.0 (http://creativecommons.org/licenses/by/4.0/).
YDB abundance peaks in nickel, cobalt, and chromium
Instrumental neutron activation analysis (INAA) was used to measure elemental abundances in magnetic grain fractions and bulk sediments. The magnetic grain fractions were analyzed in 16 samples with duplicates, ranging in depth from 82 to 446 cmbs (see Table S8 in ref. [40]). The highest Fe, Ni, and Cr enrichments were observed in one magnetic fraction from the YDB layer at 405 cm depth in Trench E (see Table S8 in ref. [40]). The YDB values range from 2× to 10× larger than average non-YDB background levels in magnetic grains. Because Ni is often enriched in cosmic material, we investigated the Ni/Fe ratio. In the YDB magnetic fraction at 405 cm depth, Ni/Fe is >5× larger than average background ratios.
Ni-rich nuggets are often associated with plant-imprinted AH meltglass. SEM-EDS was used to analyze one Ni-rich Abu Hureyra spherule and one AH meltglass fragment with Ni-rich inclusions overlain by siliceous plant imprints (Figure 15A and D). Typically, the Ni enrichments appeared as NiFe inclusions on the surfaces of micro-spherules and AH meltglass or on the inner walls of vesicles. These NiFe inclusions were only observed in the YDB layer and rarely on the meltglass interior surface. These inclusions were only found on meltglass and micro-spherule surfaces, suggesting they did not derive from the bulk sediment.

Meltglass (AG) containing NiFe-rich inclusions. (A) Photomicrograph of the outer surface of thin, 1.4-mm-long AH meltglass fragment with plant fiber imprints (P). Red patches contain NiFe (Ni = 0.5 wt%; Fe = 70.0 wt%), consistent with Ni-enriched melted Fe2O3 (hematite). The fragment also contains 3–6 wt% carbon infused into the AH meltglass. (B) Close-up photomicrograph of the same object in panel ‘A’. (C) SEM image of the object in panel ‘A’ shows bright, melted, non-crystalline NiFe that flowed together with AH meltglass that was, in turn, covered in places with plant fiber imprints (P). Concentrations of Ni ranged from 23.5–38.1 wt%. From sample E301, 405 cm depth. (D) SEM close-up of the bright area at the lower right of panels ‘A’ and ‘C’ shows inclusions on the outer surface of AH meltglass (AG). Bright-colored NiFe nuggets are composed of suessite (Fe3Si). Smooth Ca-rich AH meltglass (AG) is medium-gray, and Si-rich plant imprints (P) are darker due to greater SiO2 content. Circled NiFe micro-spherules (diameter range: 1 to 5 μm) are embedded in AH meltglass. Panel ‘C’ is from Moore et al. [5], usable under Creative Commons, CC by 4.0 (http://creativecommons.org/licenses/by/4.0/).
YDB glassy plant pyromorphs
Some glassy objects found in the YDB layer are similar to plant-imprinted AH meltglass, but they also display circumferential impressions resembling wood grain (Figure 16). Most pyromorphs range in size from ~1 mm to ~1 cm and represent about 5 to 10% of all meltglass. They typically have globules of smooth, non-imprinted AH meltglass fused onto their surfaces. Some of these objects were recovered from a work area just outside an occupied hut (Figure 16A, B, and F), and others were recovered from a pit located within one of the huts (Figure 16C and D). Similar pyromorphs have been recovered from known cosmic impact sites (Figure 17).

Pyromorphs composed of AH meltglass. (A) Photomicrograph of 1.4-mm-long twig-like pyromorph, textured with coarse silicified plant fibers. Py = pyromorphs and AG = AH meltglass. (B) SEM image of the object in panel ‘A’. The enlarged inset reveals a coarse, wood-like texture. (C) Photomicrograph of 3.6-mm-wide plant pyromorph, possibly a silicified attachment node for a bud or leaf. The darker color indicates the presence of carbon infused into the AH meltglass. (D) SEM image of the same object in panel ‘C.’ (E) Photomicrographs of 3.8-mm-long twig-like pyromorph and (F) SEM image of similar 960-μm-long pyromorph. AH pyromorphs in panels ‘A’, ‘B,’ and ‘F’ are from sample E301, 405 cm depth; meltglass in panel ‘E’ is from sample E313, 413 cm depth; and the meltglass in panels ‘C’ and ‘D’ is from sample E326, 446 cm depth, inside debris that filled a large pit within a demolished pit house.

Similar pyromorphs and plant imprints on meltglass from known cosmic impact sites. Plant imprints on outer surfaces of the meltglass: (A) from Dakhleh Oasis, Egypt, with leaf-like imprints (P) that are ~7 cm long; (B) from La Paloma, Uruguay with plant carbon incorporated into the glass; (C) from Chapadmalal, Argentina with leaf-like imprints; and (D) from Chasico, Argentina, a pyromorph with apparent growth rings transformed to glass. Samples provided by Norm Lehrman, www.tektitesource.com.
To better understand how AH pyromorphs formed, laboratory experiments were conducted on short sections of wood (~6-cm-long, narrow sections of oak, pine, and reed) that were exposed to the direct flame of an oxygen/propylene torch for ~30 seconds at temperatures ranging from ~1500°C to 2600°C, as measured by infrared optical pyrometry (see Fig. S4 in ref. [40]). Application of heat to one end of the reed or wood samples caused rapid combustion and charring, as water and other volatiles evaporated, revealing the white color of unmelted siliceous cell structures. The siliceous plant parts melted and fused upon continued heat application, forming a pyromorph that retained some visible cellular structure. Upon application of additional heat, the siliceous material completely melted and coalesced into white-to-clear droplets that eventually became airborne micro-spherules due to the gas pressure (see Fig. S5 in ref. [40]). Minimum temperatures of ~1200° to 1300°C were required to initiate melting, and heating continued until the pyromorphs and micro-spherules attained maximum temperatures of >2200°C. After cooling, they retained their characteristic plant-imprinted morphologies. SEM images of the resulting torch-melted reed reveal melted siliceous plant parts nearly identical to pyromorphs, plant-imprinted meltglass, and glassy micro-spherules excavated at Abu Hureyra.
Evidence for massive burning of the village at YD boundary
Twenty-one samples, spanning ~900 years from ~13,300 to 12,400 cal BP, exhibit highly variable concentrations of charred organic material. Concentration values were determined by submerging sediment samples in water, collecting the floating material, and separating charred organic material [32]. These samples include submicron- to cm-sized wood fragments, leaves, charcoal, carbon micro-spherules, and soot collectively called total organic carbon (TOC).
Total organic carbon
A large TOC peak marks the YDB at 405 cm depth (sample E301), containing 245 mL per liter of bulk sediment (24.5 wt%) (Figure 18; see Table S3 in ref. [40]). Below the YDB layer, TOC concentrations averaged ~0.9 mL per liter and then, after the YD onset, declined by more than half to ~0.4 mL per liter. Using a different procedure (chemothermal oxidation; see Methods), YDB sample E301 was found to contain ~9%TOC, while there was <1%TOC in samples above the YDB (ES14) and below it (ES15).

Charred organic material at Abu Hureyra. Concentrations before the YD onset average 0.9 mL per liter, rising to 245 mL per liter at the YDB and then decreasing to an average of 0.4 mL per liter following the YD onset. The histogram bar for sample E301 extends far to the right side of the figure. Data from Moore et al. [32].
Carbon micro-spherules
The YDB layer in Trench E is also marked by an abundance peak in carbon micro-spherules, which are black-to-gray, ovoid-to-spherical carbon-rich objects produced during biomass burning (Figure 19A and C). They range in diameter from ~20 μm to 1.8 mm, averaging ~270 μm, reaching an abundance peak of ~152/kg in sample E301, the YDB layer, at 405 cm depth (see Table S3 in ref. [40]). There were 20 micro-spherules/kg just below the YDB, but no other carbon micro-spherules were detected above or below the YDB. SEM imaging shows the carbon micro-spherules to have cracked and rough-textured surfaces, a thin rind, and honeycombed (spongy) interiors. SEM-EDS analyses show that the micro-spherules are dominantly carbon (typically >75 wt% up to 100 wt%), with minor surface contaminants.

Carbon proxies. (A) The SEM image of a 1.0-mm-diameter broken carbon spherule shows a thin rind and vesicular interior. “aC” indicates amorphous carbon. (B) Photomicrograph of whole carbon spherule. (C) Close-up SEM of the vesicular inner surface. (D) Topographical SEM image shows a carbon bleb (aC) embedded in a meltglass surface (AG). (E) SEM elemental map confirms an elevated carbon content of the particle in panel ‘D.’ Thin strands of carbon suggest that carbon bleb may have been rotating as it collided with the meltglass. (F) SEM image showing high-temperature mixing of granular carbon (gC) with meltglass. (G) Photomicrograph from reflectance study of carbon embedded in AH meltglass. All proxies were found in E301, extracted from a work area outside the pit house. Panel ‘G’ is from Moore et al. [5], usable under Creative Commons, CC by 4.0 (http://creativecommons.org/licenses/by/4.0/).
Carbon in meltglass
Using SEM-EDS, charred carbon was also found embedded in YDB meltglass. Approximately 40% of meltglass fragments examined contained carbon that was (i) infused into the glass as part of plant imprints (Figures 12 and 13), (ii) embedded onto meltglass surfaces (Figure 19D and E), and (iii) encapsulated within sectioned AH meltglass (Figure 19F and G).
Soot and aciniform carbon
Three AH sediment samples were examined for soot (black carbon or BC), the highly condensed carbonaceous product of the combustion of organic matter [71, 72]. The YDB layer in sample E301 contains a large concentration peak of soot at ~6 wt% of total sediment (60 mg/g of dry weight (mg/gdw)) (see Table S3 and S11 in ref. [40]) that comprises ~64 wt% of TOC and ~6.4% of bulk sediment. In comparison, low soot concentrations at ~0.3 wt% were found in levels 402–406 above the YDB and at ~0.2 wt% in sample ES15 just below the YDB. Measurements for stable carbon isotopic ratios of YDB soot showed values of −24.47 ± 0.04‱ for δ13Csoot and −25.32 ± 0.20‱ for δ13TOC. YDB soot ratios are isotopically distinct from the non-soot δ13TOC (−26.83‱), having a difference of +2.36‱. We searched for but did not observe aciniform carbon, a subset of soot found in the YDB layer but not above or below it at about half of the other YDB sites investigated [18].
Effects on village materials
Meltglass partially coated on clay construction plaster
YDB strata at Abu Hureyra contain thousands per kg of indurated clay plaster fragments, about 30% of which display impressions of reeds, plant leaves, and stems (Figure 20). These impressions appear to be from material identical to dried fibers found in AH sediment that the villagers used as a substrate for clay plaster (see Fig. S6 in ref. [40]). Several YDB-age fragments of clay plaster were found embedded into the surfaces of AH meltglass (Figure 20A), melted at high temperatures (Figure 20B), or partially coated with AH meltglass (Figure 20D–F). Unaltered clay plaster (Figure 20C) was common in, above, and below the YDB, but glass-coated clay was found only in strata marking the YDB event, making its presence highly anomalous.

Images of meltglass-coated clay plaster. Building plaster is from YDB sample E301, 405 cm, found in a work area just outside a pit house. (A) SEM image of ~3.9-mm clay plaster fragment embedded into the surface of AH meltglass (AG). (B) SEM image of 2.5-mm clay plaster fragment. Green arrows mark parallel depressions (P) formed by reeds or grass stems that formed the substrate for the plaster. (C) A 1.0-mm fragment of typical raw clay plaster with parallel depressions formed by plants. (D) Photomicrograph of 1.5-mm clay plaster fragment with reed or grass imprints and partially coated with AH meltglass (AG). (E) SEM image of the same fragment with superimposed photos of modern green reeds. (F) Manually constructed EDS-based phase map showing a close-up of clay plaster with an AH meltglass coating (green). From sample E301, 405 cm depth.
Meltglass on chert debitage from toolmaking area
From within the village, some fragments of meltglass have thin chert flakes embedded into their surfaces and often display meltglass partially coated onto the chert’s surfaces (Figure 21). All were recovered from the toolmaking area located outside the entrance to a pit house (Figure 2 and 3). Samples E301 and E313 contain ~700 debitage flakes/kg with most being ~1–10 mm wide and 1–1.5 mm thick. Of that total, glass-coated chert flakes comprised ~8% (n = 3 of 39 randomly selected). One embedded flake displays multiple conchoidal fractures covering one entire surface, and several others display single fractures. In some samples, the AH meltglass bubbled up around the embedded chert (Figure 21A–C) or partially coated the surface (Figure 21D–E, G–I). In one case, the molten glass either melted into the surface of the chert flake or flowed into a cavity (Figure 21F).

Meltglass partially coated on chert flakes (debitage). SEM images of chert flakes embedded in and partially coated with AH meltglass. (A) A 1.4-mm thin chert flake shows multiple conchoidal fractures typical of debitage from toolmaking. (B) Multi-element EDS map of same flake, showing chert is dominantly SiO2 (blue), while meltglass is a mixture of Fe, Mg, and Ca; legend at bottom left. (C) SEM image showing high-temperature melt zone at boundary between chert flake (Ch) and AH meltglass (AG). (D) SEM image of 1.3-mm thin chert flake embedded in and partially coated with meltglass (I at arrow). (E) Multi-element EDS map of same flake tilted. The upper arrows point to the meltglass coating on chert. The lower arrow indicates the high-temperature melt zone along the chert/glass boundary detailed in the following image. (F) SEM close-up image of high-temperature melt zone at chert boundary (dashed line). EDS analyses indicate the mixing of molten meltglass with the chert. (G) SEM image of 780-μm thin chert flake embedded in AH meltglass. Note embedded chromite grain (red arrow) that partially melted at ~2000°C [5]. (H) Multi-element EDS map of same flake. Arrow points to meltglass partially coated on chert. (I) SEM close-up image of meltglass splatter on chert. Arrows point to three parallel, ripple-like features indicating high-temperature (>1200°C) alteration of chert flake by partially coated meltglass.
Meltglass partially coated onto bone fragments
Our investigations also identified meltglass partially coated onto and burned into bone fragments from YDB-age debris-filled sediment found within demolished pit houses (sample E305) and from a work area outside a pit house (samples E301 and E313; Figures 22 and 23). The bones are from unknown species but may be from Persian gazelle, the most common meat source during the occupation of Abu Hureyra [32]. Gazelle bones comprised ~80% of all bones found at AH and were common in Trench E [32]. More than 600 bones were found in the YDB layer and adjacent sediments for an average of nearly 18 per m2. These glass-coated bones are almost always white, whereas uncoated bones typically are tan to brown. The glass-coated bones were intermixed with uncoated bones in the same work area near a pit house. SEM-EDS analyses confirm that these fragments contain hydroxyapatite (Ca5(PO4)3(OH)), a characteristic constituent of bone (see Tables S12 and S13 in ref. [40]).

Vertebrate bone partially coated with AH meltglass from YDB strata. All images are of a 10.3-mm-wide bone. (A) Multi-element EDS map of bone. Ca = blue, representing bone; Al = yellow, representing melted sediment; Si = red, representing lechatelierite; and sulfur (S) = dark blue, representing post-depositional sulfate. Approximately 20% of this bone fragment is covered with melted glass (orange color, representing an aluminosilicate). Note well-rounded edges. (B) SEM image of the boxed area in panel ‘A’. Yellow arrows mark 650-μm-wide Si-rich melted droplet (Le) fused to the bone and partially coated with AH meltglass (AG). (C) Colorized SEM image of a shallow 95-μm-wide depression in bone (blue), partially coated with a thin veneer of AH meltglass (brown; labeled “Burned area”) and scattered with Fe crystals (yellow) that crystallized from the AH meltglass. From sample E301, 405 cm depth.

Meltglass fused to bone. SEM images of (A) meltglass fused to >600-μm-long bone fragment; (B) meltglass fused to ~590-μm-long bone fragment; (C) close-up of meltglass in panel ‘B.’ Note the melt line where the molten glass was hot enough to burn into the bone. It is unclear whether the bones are animal or human. The bones are from the YDB layer, sample E301, 405 cm depth.
Approximately 11% of bones (n = 9 of 83 randomly selected out of ~1400 bones/kg in sample E301, the YDB layer) display splatters of Ca-Si-rich AH meltglass conformably draped across bone ridges (Figure 22; see Figs. S9 and S10 in ref. [40]) or burned into the bone surfaces (Figure 23). Droplets of 100 wt% SiO2 as lechatelierite are present on some of these bone fragments (Figure 22B; see Fig. S7 and S8 in ref. [40]). SEM-EDS elemental maps confirm that one spheroid of pure SiO2 is fused to a 10.3-mm-long bone fragment. In turn, the lechatelierite was partially covered by Ca-Al-Si glass, which closely matches the composition of the sand of the YDB bed. The bones also display indentations up to ~15-μm deep (Figure 22C) as orange marks on the whitened bone (see Figs. S9 and S10 in ref. [40] and Table S13 in ref. [40]). These marks were observed on an average of ~20% of the bones examined and were typically present on all sides of a bone rather than on a single surface.
Some bone fragments are fused into once-molten AH meltglass (Figure 24). One contains chlorapatite (Ca5(PO4)3Cl) (Figure 24A and B), a precursor to hydroxyapatite (melting point of ~1670°C), the main inorganic constituent of tooth enamel and bone, with a melting point of ~1530°C. The chlorapatite grain is fully melted with no recognizable crystalline structure and has been almost entirely assimilated by the Ca-Si glass. It is unclear whether the chlorapatite represents thermally degraded biological hydroxyapatite or is non-biological in origin. Regardless of origin, it melted at high temperatures and fused into the AH meltglass.

SEM images of bone and related minerals in AH meltglass. (A) Melted chlorapatite on the outer surface of AH meltglass (AG). Melting point ~1530°C. (B) Manually constructed EDS-based phase map of panel ‘A’, showing the remains of melted chlorapatite (blue), surrounded by progressively diffused chlorapatite (green to purple) that mixed with AH meltglass matrix (red). (C) Fragment of unmelted ~240-μm-long bone (Bo) fused into AH meltglass. From sample E313, 413 cm depth.
Partially melted bone fragments
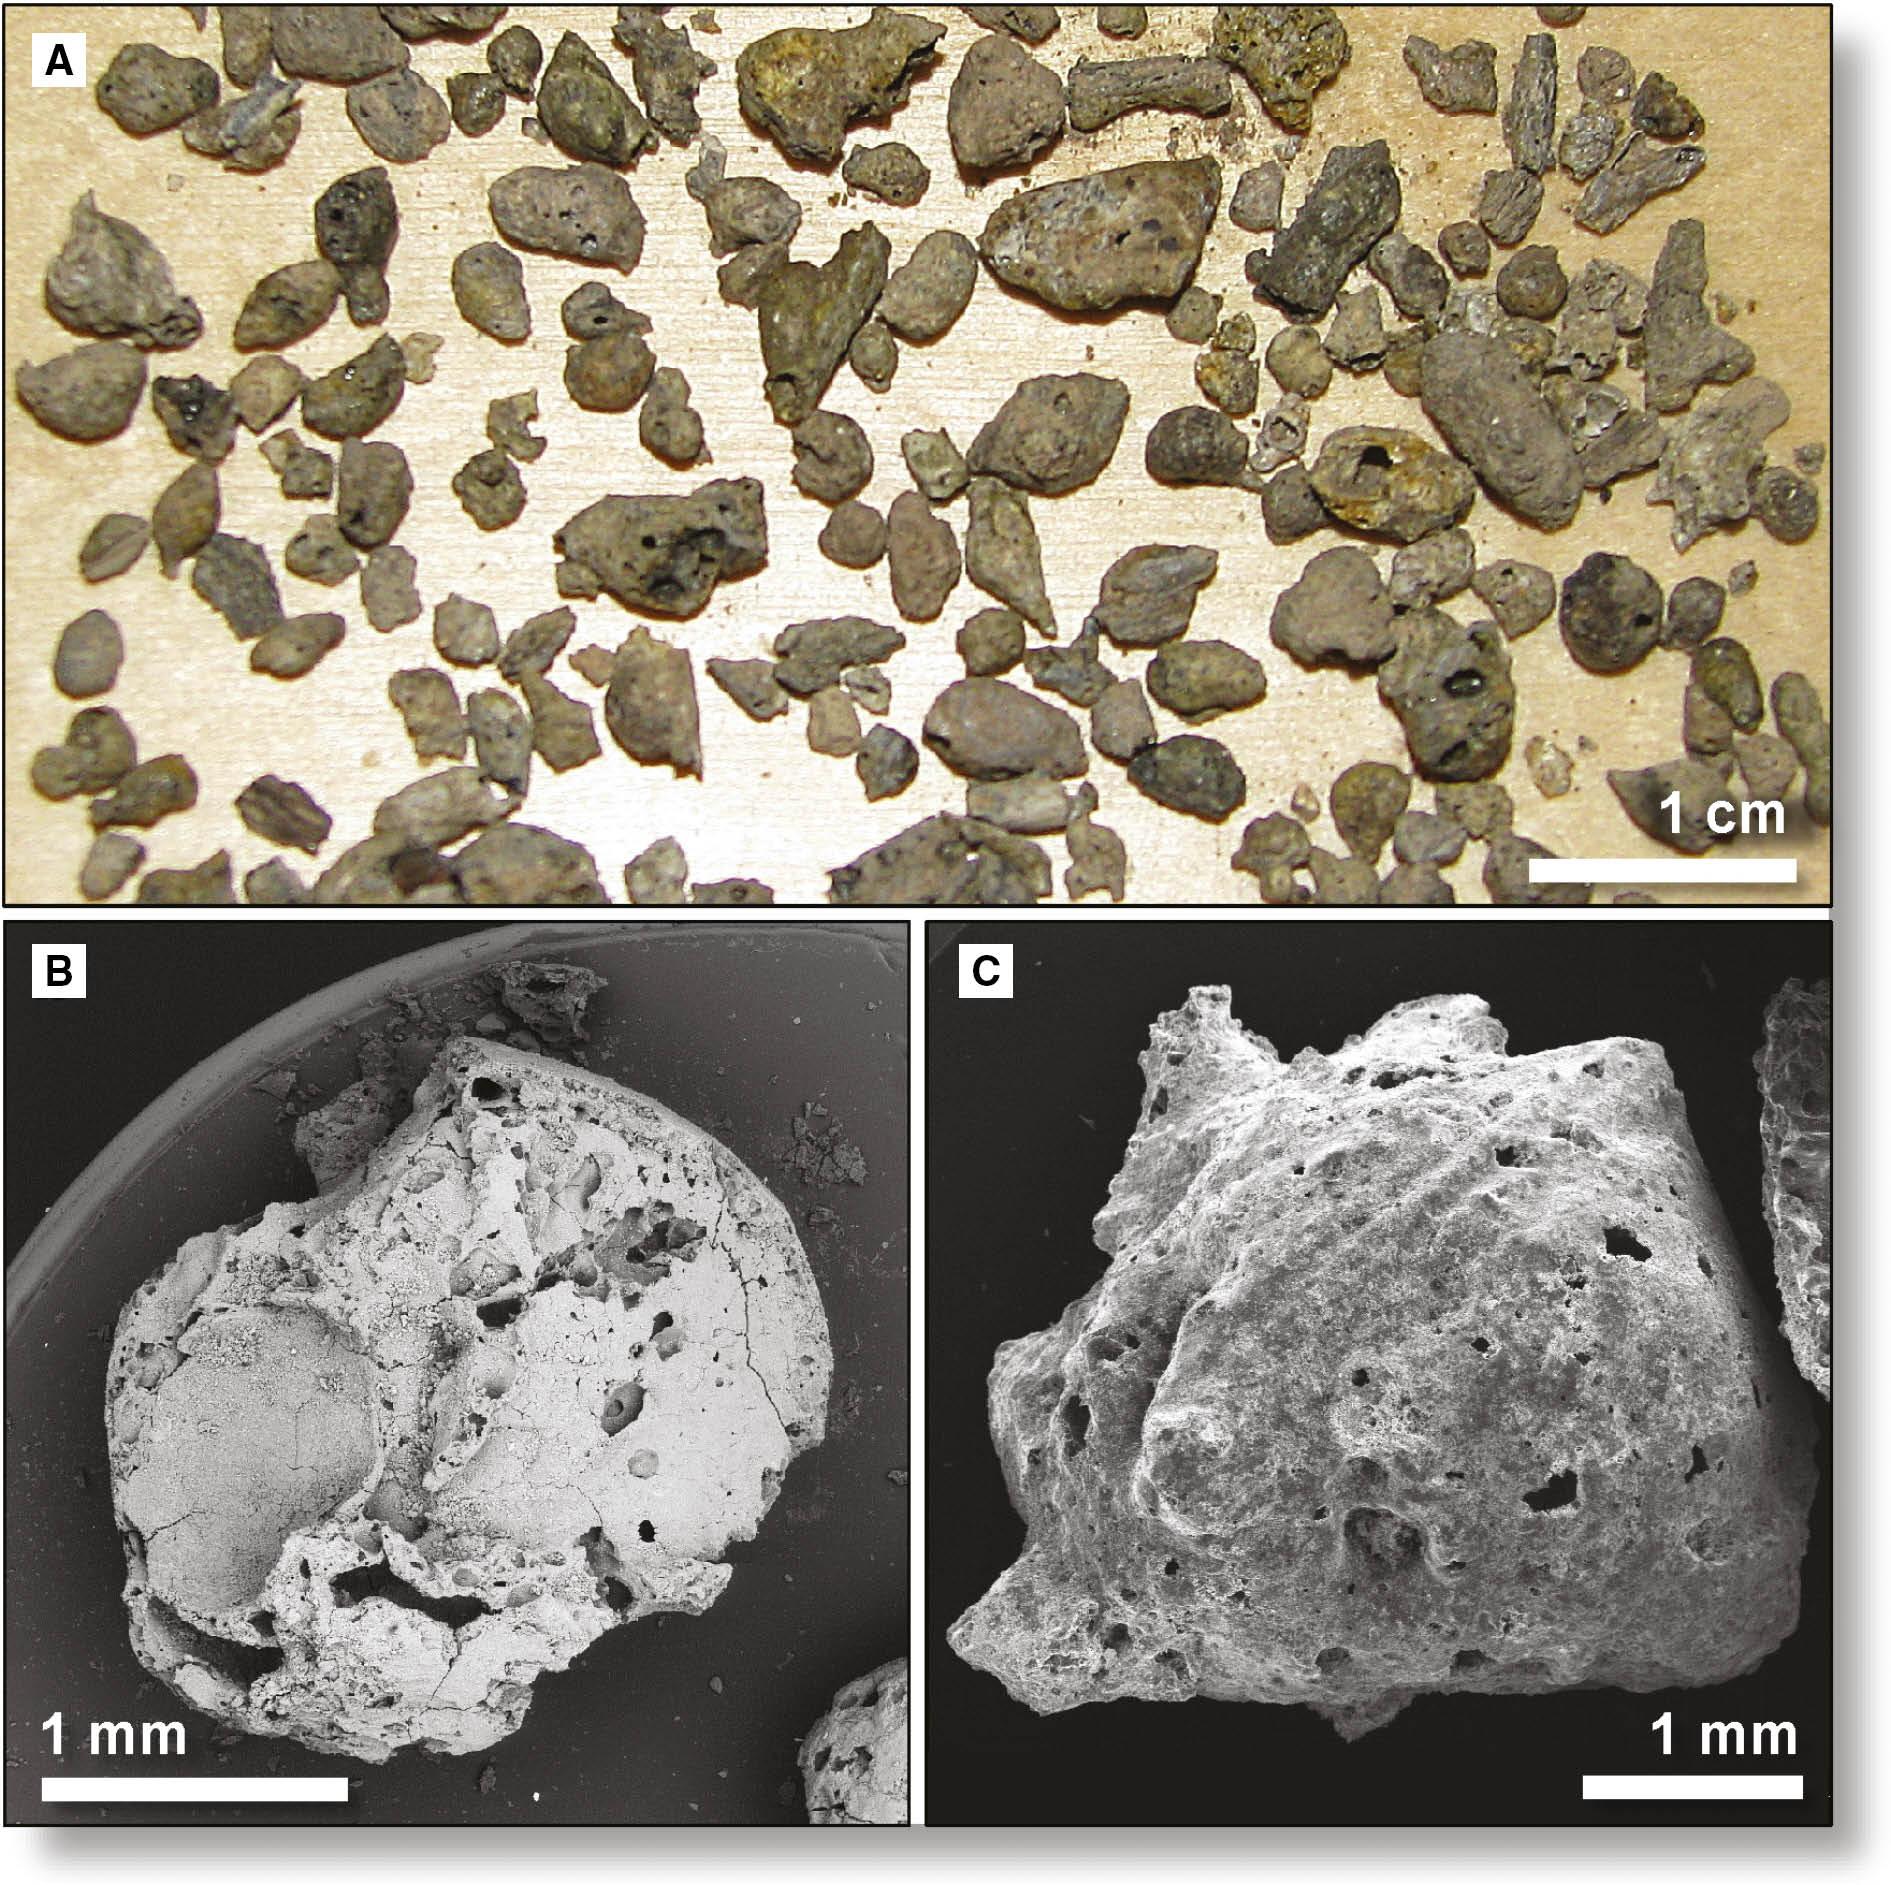
The YDB stratum at Abu Hureyra also contains bone fragments that appear to have been partially melted and deformed (~6%; n = 5 melted of 83 random fragments) (Figure 25). The bones are small and from unknown species and were found near a debris-filled pit inside a demolished hut and in the work area outside of a hut. SEM-EDS analyses confirm that all bone fragments contain hydroxyapatite (Ca5(PO4)3(OH)), the main inorganic constituent of bone.

Partially- to fully-melted bones. (A)–(B) SEM images of partially melted Abu Hureyra bones (5.6 mm and 5.9 mm, respectively). (C) SEM image of the top-right rim of bone in panel ‘A’ and showing the fusion of vesicular AH meltglass (AG) to the outer surface of the bone. Vesicles (V) appear to have been produced by outgassing during rapid high-temperature heating. (D) and (E) Photomicrographs of two partially melted bones (4.3 mm and 4.2 mm, respectively). (F) Photomicrograph of modern chicken bone melted at 1300°C and fused to torch-produced meltglass only at >1500°C, demonstrating the temperature necessary to replicate the meltglass on bone shown in panel ‘C.’ Panels ‘A’ through ‘E’ are from sample E305, 412 cm depth, next to a pit inside a demolished pit house; panel ‘F’ is a modern chicken bone.
Summary of high-temperature melted proxies
This study and Moore et al. [5] have presented evidence from AH sediment of 36 high-temperature, melted elements and minerals, ranging from ilmenite melted at 1050°C to osmium melted at 3053°C. The list includes materials typically associated with cosmic impact events, such as iron silicide (FeSi; 1410°C); nickel-iron (NiFe; 1430°C); native Fe (1538°C); baddeleyite (dissociated zircon (ZrSiO4=>ZrO2; 1676°C); platinum (1768°C); and iridium (2466°C).
Effects on village lifestyle
The evidence presented above and in the previous contributions [3, 5] supports the hypothesis that a cosmic impact occurred at Abu Hureyra at the YD onset. These data further indicate that the impact was near the village. Next, we explore the potential effects of this impact event on the village and its lifestyle, culture, and history.
Changes in building construction
Pit infill at AH contains YDB peak abundances of plant-imprinted meltglass, glass-splattered debitage and animal bones, charcoal, soot, platinum, iridium, and nickel. Later, villagers leveled the debris and built a different style of hut that lacked interior pits, meaning that the old-style pit houses were never reconstructed [32] (Figure 26). This sudden transition to huts without pits represents a significant, highly unusual departure from the previous 600-year-old pit-style architectural tradition [32].

Photographs of occupational surfaces across YDB. (A) Colorized photo of pre-YD excavation shows occupational surface, Bayesian-dated to ~12,800 ± 40 cal BP. Wattle-and-daub huts typically enclosed multiple small, hand-dug rounded pits (gold arrows) shown inside the curved, dashed gold line that represents the approximate wall line of the hut. Each pit is up to a few meters in diameter. The exterior work area outside the entrance of a hut (gap in gold line) is near the purple arrow. Sample numbers and their approximate locations are shown. All proxies mentioned in this paper were observed in this trench. (B) Colorized photo of post-YDB interior occupational surface (inside gold dashed line with blue arrow). Original buildings were destroyed at the YD onset, and the in-house pits were filled with meltglass and debris. Replacement structures had roughly flat floors but lacked interior pits. Orange dotted lines along trench walls indicate approximate YDB-aged strata. For sidewall stratigraphy, see Figure 4. Panels adapted from Figs. 5.12 and 5.22 in Moore et al. [32].
Concentrations of proxies
Various AH materials have been discussed above and in the Moore et al. [40]. All show the highest peak abundances in the YDB layer dated 12,800 ± 40 cal BP [15] (Figure 27).

Compilation of peak concentrations of various proxies from the YDB layer. (A) Ca-Si-rich and Fe-rich micro-spherules; (B) nanodiamonds; (C) high-temperature meltglass; (D) carbon micro-spherules from biomass burning; (E) black carbon or soot in sediment; and (F) total organic carbon, floated from sediment. The green horizontal bar represents sample E301, the YDB bed with a Bayesian-model age of 12,800 ± 40 cal BP. All YDB elemental abundance peaks are substantially larger than background concentrations and crustal abundances.

Discussion
Nanodiamonds
Kinzie et al. [24] reported the presence of YDB nanodiamonds at 23 sites in 10 countries on three continents (~50 million km2), including at Abu Hureyra in Syria. Kinzie et al. [24] also conducted experiments that produced laboratory nanodiamonds identical to those in the YDB layer. Their production required the presence of at least two of three factors: high temperatures, anoxia, or high pressure [24]. Such combinations do not occur naturally at the Earth’s surface (e.g., through wildfires, volcanism, or building fires). Instead, those conditions are associated with impact events such as at the K-Pg boundary that produced nanodiamonds and the Miocene-age Ries Crater impact in Germany that created microdiamonds (Kinzie et al. [24] and references therein).
The reported presence of nanodiamonds in YDB-age sediments has been a controversial subject. Daulton et al. [73] claimed that YDB nanodiamonds have been misidentified and, instead, are either copper or graphene particles and that there are no discrete abundance peaks of nanodiamonds in YDB strata at any site. In contradiction, Tian et al. [74] independently confirmed a discrete abundance peak in cubic nanodiamonds in YDB-age sediment in Belgium and found none above or below the YDB. Similarly, Bement et al. [75] identified an abundance peak in YDB nanodiamonds at a site in Oklahoma.
The present study confirms the presence of nanodiamonds in Abu Hureyra sediment, as previously reported [24]. This contribution demonstrates that YDB nanodiamonds have the correct diffraction patterns and d-spacings (Figures 6C, 6D, and 8D); have the correct atomic bonding, sp3 (Figure 7), thus eliminating graphene and graphane; and are composed of carbon and no other elements, such as copper (Figure 7). In summary, the results of this study are consistent with earlier nanodiamond identifications in the YDB layer at Abu Hureyra and many other sites [16, 24, 33, 57, 74, 75]. The evidence supports the previous conclusion that YDB nanodiamonds at Abu Hureyra resulted from high-temperature, high-pressure, impact-related biomass burning that transformed terrestrial carbon into nanodiamonds [24], as was proposed for nanodiamonds found at the K-Pg boundary [76].
Micro-spherules
Bunch et al. [3] and Moore et al. [5] suggested that micro-spherules at Abu Hureyra formed at extremely high temperatures, as indicated by the presence of melted inclusions in quartz (~1713°C); zircon (~1775°C); chromferide (~1900°C); and monazite (~2072°C). Our investigation further suggests that the micro-spherules were exposed to a steep gradient of temperatures, in which exteriors of micro-spherules were exposed to temperatures >1713°C, as indicated by the melted high-temperature grains in Table 1. However, the interiors were exposed to temperatures of 1250°><1713°C, as indicated by unmelted quartz grains. A temperature of ~1250°C is the solidus temperature of local Ca-Al-Si-rich sediment [3, 10]. This evidence is consistent with the exposure of melted surficial sediments to high temperatures in an impact plume of sufficiently short duration to limit heat penetration into the interiors. This phenomenon was observed with micro-spherules produced during the Trinity atomic detonation [3].
High-temperature minerals.
| Phase | Formula | ~Equilib Melt T (°C) | Phase | Formula | ~Equilib Melt T (°C) |
|---|---|---|---|---|---|
| Ilmenite | FeTiO3 | 1050 | Titanomagnetite | TiFe2O4 | 1625 |
| Iron phosphide | Fe2P, Fe3P | 1100 | Calcium phosphate | Ca3(PO4)2 | 1670 |
| Iron sulfide | FeS, Fe2S, Fe3S | 1200 | Zircon, dissociation | ZrSiO4=> ZrO2 | 1676 |
| Sediment | Si-Ca-rich | 1250 | Quartz | SiO2 | 1713 |
| Spherules, Si-rich | Si, Ca, Al, Fe oxides | 1250 | Chert | SiO2 | 1720 |
| Titanium phosphide | TiP | 1400 | Platinum (PGE) | Pt | 1768 |
| Iron silicide | FeSi | 1410 | Zircon | ZrSiO4 | 1775 |
| Silicon, native | Si | 1414 | Titanium sulfide | TiS | 1780 |
| Spherules, Fe-rich | Fe + Fe oxides | 1420 | Chromferide | Fe1.5Cr0.2 | 1900 |
| Nickel iron | NiFe | 1430 | Manganese oxide | MnO | 1945 |
| Nickel | Ni | 1455 | Rhodium (PGE) | Rh | 1964 |
| Chlorapatite | Ca5(PO4)3Cl | 1530 | Monazite | (Ce, La, Nd, Th)PO4 | 2072 |
| Hematite | Fe2O3 | 1538 | Calcium silicate | CaSiO3 | 2130 |
| Iron, native | Fe | 1538 | Chromite | (Fe)Cr2O4 | 2190 |
| Wollastonite- | CaSiO3 | 1540 | Ruthenium (PGE) | Ru | 2334 |
| Palladium (PGE) | Pd | 1555 | Iridium (PGE) | Ir | 2466 |
| Magnetite | Fe3O4 | 1590 | Calcium oxide | CaO | 2572 |
| Calcium phosphide | Ca3P2 | 1600 | Osmium (PGE) | Os | 3053 |
All minerals were observed on the outer surfaces of AH meltglass or inner walls of vesicles. Minerals are listed in order of ascending temperature.
Meteorites and micrometeorites are not comparable to AH micro-spherules and meltglass because most cosmic material contains deficient concentrations of volatiles such as Na and K compared to the upper continental crust. In some meteorites, the Na concentration is 0.50 wt% [77] compared to a crustal abundance for Na of 2.5 wt% and 1.1 wt% in AH meltglass. K in meteorites is 0.06 wt% [77] compared to 2.6 wt% in Earth’s crust and 1.7 wt% in AH meltglass. In meteorites, these volatiles become even more depleted due to atmospheric ablation. We propose that the depletion in AH meltglass is due to the high-temperature melting of local sediment in the ejecta cloud rather than atmospheric ablation.
In addition, AH micro-spherules are not typical meteoritic ablation material because stony cosmic micrometeorites, which account for 96% of all meteoritic material, nearly always have MgO concentrations of >10 wt% [3, 10, 20, 78]. In one study of such micro-spherules, Genge et al. [78] reported that 71 Antarctic ablation micro-spherules averaged 23.3 wt% MgO (range: 13.7 to 32.6 wt%), compared to AH micro-spherules with average MgO concentrations of 4.9 wt% with some having no detectable MgO. Thus, there is no evidence that AH micro-spherules are from meteoritic ablation.
Using spherule morphologies and ternary diagrams of chemical compositions, Bunch et al. [3] concluded that Abu Hureyra micro-spherules could not have been produced by volcanism, anthropogenesis, lightning, wildfires, the regular influx of cosmic material, or any other natural terrestrial process. In addition, Moore et al. [5] used a superconducting magnetometer to measure magnetic remanence in 6 representative Fe-rich micro-spherules extracted from AH sediment. None of the Abu Hureyra Fe-rich micro-spherules examined contained elevated remanent magnetism values, indicating that they did not form during lightning discharges.
On the other hand, some low-temperature Ca- and Si-rich micro-spherules may have formed from the combustion of thatch when the settlement burned. Similar calcic micro-spherules are reported to be associated with the combustion of thatch roofing materials at Tell Leilan, a younger Middle Eastern site [79]. In addition, glassy micro-spherules have been reported in archaeological midden mounds, “haystack” fires, and underground peat fires at estimated temperatures of ~1100–1300°C [80, 81]. However, these temperatures are too low to melt magnetite, quartz, zircon, chromferide, and monazite, which are embedded in AH micro-spherules and meltglass.
Micro-spherules nearly identical to those found at Abu Hureyra have been documented in previous investigations of ~54 other YDB sites (for references, see Appendix in Wolbach et al. [17, 18]). The abundance of micro-spherules at Abu Hureyra (595 micro-spherules/kg) is similar to the average abundances reported by Firestone et al. [6] for 14 YDB sites averaging 389 micro-spherules/kg; LeCompte for three sites averaging 632 micro-spherules/kg; Wittke et al. [10] for 18 YDB sites averaging 955 micro-spherules/kg. Notably, the spherule concentration at Abu Hureyra is equal to or greater than 23 of the 34 sites examined in those three studies.
Meltglass
Similar high-temperature meltglass was reported in studies of the Atacama Desert in Chile [82–84] from a proposed cosmic airburst approximately 12,300 to 11,500 years ago. The meltglass is now strewn across a ~75-km-long, narrow band of the desert. Another study [85] countered that hypothesis, claiming the Atacama glass formed during natural wetland fires at <1300°C. Subsequently, several studies of the Chilean meltglass [84, 86–88] contradicted a terrestrial origin after finding meteoritic debris trapped in the Atacama meltglass, including baddeleyite dissociated from high-temperature melted zircon (1676°C) and Ni-rich minerals that mobilized out of the melt at >2000°C. This evidence in the Atacama Desert offers an independent example of meltglass embedded with high-temperature ET materials, similar to that found at Abu Hureyra.
In a previous study of Abu Hureyra, Thy et al. [81] described meltglass samples from the site and four nearby archaeological sites in northern Syria, some of which display aerodynamically shaped meltglass with plant imprints (Figs. 3b, 3f, and 3h in Thy et al. [81]). They argue against the high-temperature formation reported here and in Bunch et al. [3], instead proposing that AH meltglass formed during thatched hut fires at no more than ~1175°C [81]. This lower-temperature claim was countered by Moore et al. [5], who concluded that although AH meltglass could have melted at temperatures of <1300°C, the melting of incorporated high-temperature minerals indicates that the maximum exposure temperature for AH meltglass was ~2200°C, thus precluding formation during hut fires. The collective evidence indicates that AH meltglass is not anthropogenic in origin. If it were, meltglass would be found in high concentrations throughout the sedimentary column, especially in the youngest strata, where human populations were the largest. Instead, AH meltglass is only occasionally found in minor quantities above the YDB, and most strata contained no meltglass. Meltglass inside hut pits is found within unstratified, monolithic deposits that do not appear to have been deposited anthropogenically but rather are inferred to have been rapidly deposited as the huts were destroyed by the blast wave from the near-surface airburst.
The comparison of abundances of major elements demonstrates that AH meltglass and micro-spherules are dissimilar to typical crustal abundances and to meteoritic materials (see Fig. S2 in ref. [40]; values were normalized to CI chondrites [89]). For example, chondrites, which comprise 96% of all meteoritic material, nearly always have MgO concentrations of >10 wt% [3, 10, 20, 78], much higher than AH meltglass, micro-spherules, or sediment. This evidence indicates that AH meltglass and micro-spherules are not meteoritic ablation.
On the other hand, AH meltglass is a close match for local Ca-rich bulk sediment and clayey silt, suggesting that meltglass formed from the melting of local sediment. The composition of AH meltglass is consistent with the hypothesis of high-temperature melting of local sediment accompanied by vaporization of K and Na (Na2O boils at 1950°C). In addition, elemental enrichments in Ni, Mn, and Cr are consistent with the addition of small amounts of meteoritic material, in which concentrations of these elements are elevated above crustal abundances.
Low water contents for meltglass fragments can indicate formation at high temperatures because outgassing reduces water concentrations [90]. Moore et al. [5] reported deficient H2O concentrations in AH meltglass from sample ES15 with water content ranging from 222 to 460 ppm (0.02–0.05%; n = 19 measurements) (see Table S14 in ref. [40]) [5]. These data suggest that AH meltglass was subjected to very high temperatures. Low meltglass water content (0.02–0.05% H2O) is a defining characteristic of tektites and meltglass from known cosmic impacts and is inconsistent with glass derived from volcanic and anthropogenic sources [5].
Based on melted minerals embedded in meltglass, we propose that AH meltglass was exposed to temperatures far above the melting point of local sediment (solidus temperature of ~1200°C). The evidence suggests that ambient temperatures around the meltglass rose to >2200°C, chromite’s melting point and quartz’s boiling point [5]. That temperature evaporated volatiles such as K and Na. As temperatures fell, the meltglass eventually solidified at ~1200°C, thus giving the incorrect impression that this was the maximum formation temperature when it was only the solidus temperature.
Plant-imprinted-meltglass
The patterns observed on AH meltglass closely correspond to the ribbed patterns of plant stems and leaves, e.g., from common reeds (Phragmites australis) (Figure 13) that have grown in the valley of the Euphrates for more than 13,000 years [32]. To investigate these patterns, we incinerated common reeds in the laboratory with an oxygen/propylene torch to temperatures >1720°C, the melting point of quartz, as measured by an infrared optical pyrometer. SEM-EDS indicates that the composition of the reeds tested is ~98 wt% water and ~2 wt% ash, of which ~91.7 wt% was SiO2, a concentration closely comparable to that of silicified cell imprints on AH meltglass (93.1 wt% SiO2). The balance is comprised of minor amounts of oxides, e.g., FeO, Al2O3, and CaO. Oak and pine twigs had less SiO2 (46 wt%) and more Al, Fe, and Mg oxides.
This study also considered alternate natural, non-impact explanations for the imprinted meltglass. A natural material called ‘woodstone’ can be produced by wood combustion at ~400–815°C, followed by fusion with sediment to form a glass-like carbonate stone that can contain plant imprints [91]. However, the elevated potassium content of woodstone [91] is unlike that of AH meltglass. In another natural example, Baker and Gaskin [92] reported glass-like material associated with forest fires, during which hollow tree trunks created intense updrafts, similar to a blast furnace, that melted sediment within the trunks at estimated temperatures of ≤1000°C.
Coarse plant imprints, similar to those at Abu Hureyra, also have been reported as vesicular, vitreous “biomass glass” in soils known to form in archaeological midden mounds and so-called “haystack” fires at estimated temperatures of 1155–1290°C [80]. This glass forms when subsurface combustion partially fuses phytoliths and other siliceous plant parts. Thy et al. [81] estimated the formation temperatures for biomass glass to range from 1100–1200°C. These temperatures are similar to the results reported by Moore et al. [5], who conducted laboratory heating experiments [5] showing that phytolith-imprinted AH meltglass begins to melt at ~1100°C, and by ~1200°C, most visible plant imprints were destroyed. However, the results for Abu Hureyra are only the minimum temperatures at which AH meltglass transitions from its liquid phase to a solid, and they do not represent the maximum temperatures to which the meltglass may have been exposed. All such reported temperatures are far too low to melt the high-temperature minerals observed fused to the surfaces of AH meltglass fragments.
To further investigate how high temperatures affect plant imprints, AH sediment was melted in the laboratory with an oxygen/propylene torch to temperatures >1720°C, the melting point of quartz. Once the sediment was molten, fresh and dried reeds (Phragmites australis) were mechanically pressed into the melt. The reeds incinerated instantly, and the molten glass cooled rapidly, leaving plant impressions lined with fused silicified plant cells (see Figs. S6 and S7 in ref. [40]). The morphologies of these laboratory-produced silicified plant cells are indistinguishable from those found in excavated fragments of AH meltglass. Both sets of plant imprints display impressions of elongated silicified plant fibers, plant phytoliths, parenchyma cells (primarily responsible for plant metabolism), stomata, plant trichome cavities, and vascular bundles (see also Figs. S6 and S7 in ref. [40]). Modern reeds have similar morphologies to dried YDB-aged Abu Hureyra plants and leaves used for walls and roofs of pit houses (see Fig. S6 in ref. [40]). Our experiments demonstrate that plant imprints can persist on meltglass as temperatures fall from >1720°C to solidus temperatures of ~1100°C.
Regarding the formation of plant-imprinted meltglass, we propose the following. As the airburst ejected the molten glass, temperatures fell from >2200°C to less than ~1720°C but greater than 1200°C. Airborne molten projectiles of AH meltglass collided with or fell onto local reeds and plants or possibly struck reeds used in hut construction. These collisions vaporized and drove off the water and other volatile constituents from the plants, encapsulated some of the organic carbon, and produced impressions lined with siliceous plant parts. When glass temperatures fell below ~1200°C, the molten AH meltglass solidified and preserved existing imprints but permitted no new imprints to form.
Pyromorphs
These plant-imprinted objects are similar to impact-related meltglass from Argentina that was found in at least seven glass-bearing strata that range in age from 6,000 cal BP to 9.21 Ma [93], along with similar non-YD-aged impact-related meltglass from Dakhleh Oasis, Egypt and La Paloma, Uruguay (Figure 17; see Text S3 in ref. [40]).
Morphologically, these objects resemble small twigs and other plant parts that are proposed to have been transformed into “pyromorphs” that resemble the original organic plant material. The smooth surface on some meltglass attached to pyromorphs is interpreted as having occurred when airborne meltglass collided with the pyromorphs. Based on the morphological and geochemical similarity, they formed when the thermal pulse from the near-surface airburst incinerated plants before the arrival of the blast wave, evaporated the volatiles, and partially fused the remaining siliceous material, roughly preserving the appearance of the original plant.
Meltglass on plaster
These numerous clayey objects appear to be fragments of clay-based plaster used in wattle-and-daub construction that involved applying a thin plaster layer as weatherproofing over a substrate of grasses and reeds. The molten glass formed by the nearby airburst at ~12,800 ± 40 cal BP may have been deposited onto fragments of clay plaster lying on the ground. Alternately, the blast possibly demolished inhabited huts and deposited glass at high velocity onto some of the broken plaster.
Meltglass on chert flakes
Most lithics used for toolmaking were produced from chert nodules common in local chalk beds exposed above the Euphrates River floodplain. Tool-making waste flakes are common throughout all layers at Abu Hureyra, with more than 7000 flakes found in the 12,800-year-old stratum and adjacent layers in Trench E [32]. The glass-coated chert flakes are interpreted as debitage (waste flakes) because they were found in the toolmaking area and because many display conchoidal fracturing typical of percussion toolmaking. This evidence indicates that airborne molten glass fell onto pieces of debitage in the village toolmaking area.
Meltglass on bone
This evidence suggests that airborne molten glass partially coated the bones at a minimum temperature of ~1250°C. The lechatelierite coating the bones may be from melted quartz grains or melted silicious plant material. These SiO2 droplets drape conformably across ridges of the bone, indicating that when they landed, their viscosities were very low, implying temperatures above 1720°C, the melting point of quartz [3, 5].
The shallow orange-colored Fe-rich indentations (Figure 22) are inferred to have resulted from the impact of molten glass globules that scorched the bone and later detached, leaving the orange-colored depressions. To test this hypothesis, we removed several silica droplets attached to the bone, revealing shallow indentations under them that are identical to the orange-colored marks with no glass. The glass partially coated on all sides of bone fragments suggests that the bones were airborne or moving when the glass was deposited. If so, airborne, high-velocity, high-temperature molten glass traveled throughout the village, possibly causing lethal burns on exposed villagers.
Most glass-coated bones displayed sharp edges, but some displayed rounded edges and surface erosion (Figure 22A; see Figs. S9 and S10 in ref. [40]) over which pristine glass is draped. According to Moore et al. [32], this bone morphology is typical of bones partially digested by scavengers and domesticated dogs, which were present in the village at the YD onset [32]. Alternatively, humans may have cooked and consumed some small bone fragments. Either way, an unusual possibility arises: some bones may have been eaten by people and animals, excreted, and later partially coated with airborne molten glass from the impact event.
Melted bone
We heated a modern chicken bone with an oxygen/propylene torch to investigate the conditions needed to melt bone. When the bone was exposed to the torch flame at ~1000°C for longer than ~30 seconds, the bone charred but did not melt. However, when the bone was heated rapidly, it first became plastic and then melted at >1200°C, after which it could be fused to torch-melted AH sediment at temperatures >1500°C (Figure 25F). These temperatures are too high to have been achieved by AH villagers who occupied the site during the YD interval.
The discovery of melted bone is extremely rare and has never been reported in anthropogenic campfires, where bones commonly char when burned. Instead, melting bones requires very high temperatures of short duration and often under anoxic conditions. Similar bones have been documented at a ~4000-year-old cosmic impact site in France by Courty et al. [53], who reported melted bone fragments exhibiting inclusions of metal-rich impact glass. These melted bones at Abu Hureyra are consistent with the hypothesis of a nearby, short-duration, high-temperature impact event under reducing conditions.
Incineration of the village
Typical non-impact sedimentary concentrations of soot range from 0.001 to 3 mg/gdw sediment in the open ocean to 0.1 to 2.2 mg/gdw sediment in coastal areas [94]. By comparison, the YDB at Abu Hureyra displays elevated soot concentrations at 6 wt%, consistent with the combustion of large quantities of biomass. YDB δ13Csoot shows a difference of 2.36‱ between non-soot δ13TOC, suggesting that the soot and non-soot TOC have different combustion sources. These data are consistent with the results of Maiorana-Boutilier et al. [95], who investigated the soot content of 15 YDB sites in six countries (Belgium, Mexico, Spain, Syria, the UK, and the USA), including Abu Hureyra. The δ13Csoot values for most of the black mat samples were similar globally, averaging −22.26 ± 2.5‱, with seven sites averaging −24.28 ± 0.0‱, nearly identical to the −24.47‱ value for Abu Hureyra. In contrast, δ13Csoot values for non-YDB samples averaged −18.52 ± 2.19‱, a difference of +3.7‱. One possible explanation for this difference is that some portion of the total YDB soot at Abu Hureyra resulted from the atmospheric mixing of global carbon, where a portion of local YDB soot was mixed with non-local soot. This large concentration of YDB soot at Abu Hureyra, as well as its isotopic signature, supports the hypothesis that the multi-continental YDB cosmic impact triggered widespread, high-temperature biomass burning, followed by a near-global fallout of charcoal and soot [17, 18].
Laboratory experiments indicate that carbon micro-spherules form when airborne droplets of burning plant resin cool and solidify [8], as can occur in any wildfire. Similar carbon micro-spherules have been previously identified in strata at the YDB at multiple sites [6] and from other impact events, such as at the K-Pg boundary [6]. Because carbon micro-spherules are uncommon at Abu Hureyra, are primarily restricted to the YDB, and are absent in the 4000-year record following the YDB, they cannot have been produced by cooking fires throughout the stratigraphic sequence [32]. This evidence suggests they formed during an unusual biomass-burning event. However, because carbon micro-spherules have been recovered after modern forest fires [8], they do not represent direct evidence of an impact event. However, their presence suggests that intense biomass burning coincides with the deposition of proposed high-temperature, impact-related proxies.
Previously, Wolbach et al. [17, 18] investigated the biomass-burning record in 125 lakes and reported a multi-continental collective charcoal/soot abundance peak at the YDB. Four lakes are in the Middle East, and three displayed large biomass-burning abundance peaks in charcoal/soot within the YDB age span of 12,835 to 12,735 cal BP [15]. These records are again consistent with the hypothesis that the YDB impact event triggered a synchronous, near-global biomass-burning episode that included the Middle East near Syria [17, 18].
In summary, the stratigraphic data from AH show that sediments of YDB age exhibit major abundance peaks in charcoal, charred seeds, charred fruits, carbon micro-spherules, soot, and carbon-infused meltglass. The amount of charred material in YDB age sediments is by far the highest concentration observed in the AH stratigraphic record and represents the largest biomass-burning episode for the entire 3100-year sedimentary record, ranging from ~13,300 cal BP to 10,200 cal BP. The large accumulation of burned carbon of YDB age suggests incineration of wood, reeds, and grasses used for village hut construction but may also include the influx of nearby burned plant material from the Euphrates floodplain. This collective evidence is consistent with the hypothesis that the village was incinerated and destroyed ~12,800 years ago.
Building styles
Numerous radiocarbon dates from the archaeological sequences suggest near-continuity of occupation, but uncertainties in radiocarbon dating mean there could be gaps in occupation. Huts in the village may have been rebuilt immediately, or because of the limits of radiocarbon dating, up to several decades could have passed before people returned and rebuilt the village. Either way, they utilized a different building style that did not include pits. On the other hand, the people who rebuilt the village used the same styles of flint artifacts and bone tools, suggesting a close relation to the village’s previous occupants. Based on archaeological and sedimentary evidence, it is proposed that powerful impact-related winds demolished the existing pit houses (Figure 26A) and filled the interior pits with non-laminated, unconsolidated layers of sediment (Figure 26B). When rebuilding occurred, the old building style was abandoned.
Formation mechanism
The type and size of the proposed impactor are unknown. We propose that it was a “touchdown event,” similar to the near-surface airburst over Antarctica identified by van Ginneken et al. [66]. For our model, the bolide is proposed to have been a fragment of a comet or possibly a chondrite, which is thought to form the nucleus of a comet. No known crater near Abu Hureyra exists, but the impact hypothesis does not require one. Most of the same high-temperature evidence observed at AH has been found at accepted impact events with no known confirmed craters, including the Dakhleh Oasis in Egypt [96], the Australasian tektite field in SE Asia [3], and the Atacama Desert [84]. Alternately, a small-diameter crater could be concealed in the Euphrates floodplain, where sediment deposition and wind-water erosion could have buried any such crater long ago. If so, the reservoir that flooded the AH site now obscures any possible evidence.
The large size of some AH micro-spherules and meltglass (≥1 cm in diameter) indicates that whether the bolide at Abu Hureyra created an airburst or crater, ground zero may have been close to the village because such large fragments are unlikely to have traveled far. The evidence suggests that meltglass remained molten long enough to coat and burn into bones, debitage, and clay plaster within the village. Because melted proxies are more abundant at AH than at Tunguska, the AH bolide’s energy is estimated to be greater than ~30 Mt, which is much larger than estimated for Tunguska (~5 to 15 Mt).
Global impact scenario that includes Abu Hureyra
It is proposed that numerous fragments of a giant comet collided with one hemisphere of the Earth ~12,800 years ago, causing numerous airbursts/impacts spanning several hours [97] (see Text S4 in ref. [40]). We posit that multiple airbursts/impacts by fragments of this comet collectively ignited wildfires on a hemispheric or global scale [98]. If there were larger, crater-forming impactors, they may have impacted the world’s oceans, produced transient craters, or formed craters that are as yet undiscovered. For the hemisphere exposed to the incoming comet, the mean distance of any point from a multi-megaton impact by such a body would have been a few tens of kilometers, meaning that a large percentage of the surface of one hemisphere would have been directly affected by thousands of these airbursts/impacts. At the same time, there would have been an influx of millions of tons of cometary dust in the form of carbon-rich aerosols and water vapor over the few hours of the encounter (compared to typically 50 tons/day), along with soot from the extensive wildfires. Together, these particulates triggered climatic instability, inducing long-term cooling (impact winter, followed by the onset of the Younger Dryas episode) enhanced by creating high-altitude, insolation-blocking ice crystals [98, 99].
Conclusions
The hypothesis of a cosmic airburst near Abu Hureyra ~12,800 years ago by a small cometary fragment is physically and statistically possible. This scenario accounts for all the evidence, including peak concentrations in high-temperature micro-spherules, meltglass, nanodiamonds, cobalt, nickel, chromium, and other proposed impact-related proxies distributed across the Abu Hureyra village.
We propose that the high-temperature, plant-imprinted meltglass found throughout the village of Abu Hureyra represents the oldest known evidence of a probable cosmic airburst that directly affected a human settlement. Also, this is the first known report of impact-related meltglass partially coated onto bones in faunal archaeological assemblages, debitage from toolmaking, and human building materials. No similar material was observed in thousands of years of anthropogenically deposited sediment above the YDB layer.
Methods
Figures
As is common practice, the non-essential borders of most figure panels were cropped to fit the space available. For some resized images, the bottom legends were cropped because they were no longer legible and were replaced by new scale bars; scale uncertainties are approximately ±10%. In some cases, scale bars were illegible and were replaced with legible ones. Sometimes, figures were rotated to fit the available space. As is common practice, most figures were adjusted globally for brightness, contrast, tone balance, color balance, color temperature, and sharpness.
Radiocarbon dating
Eighteen radiocarbon dates were acquired by Moore et al. [5, 32] from the Oxford Radiocarbon Accelerator Unit; the British Museum Radiocarbon Laboratory; and the W. M. Keck Carbon Cycle Accelerator Mass Spectrometry Laboratory at the University of California, Irvine, using measured values of 13C to correct for sample isotope fractionation. Age calculations used 0 14C years BP as being equivalent to AD 1950. For this study, the P_Sequence routine in OxCal v4.4.4 [56] was used with the IntCal20 calibration curve to create an age-depth model from the radiocarbon dates with results similar to that of Kennett et al. [15] and Moore et al. [5] The OxCal Bayesian code is shown in the see Methods in ref. [40].
Furnace heating experiments
To determine the melting point of Abu Hureyra sediment, we heated typical sediment samples from a pithouse in Trench E in either alumina or graphite crucibles in steps of approximately 100°C beginning at 1000°C. Typically, ~1 g of each sample (Abu Hureyra bulk sediment or plant-imprinted glass) was placed in an alumina crucible (99.8 wt% Al2O3, CoorsTek) and inserted into a box furnace preheated to near the temperature of interest. Temperatures were monitored using a type B thermocouple inside the furnace chamber. After 10 minutes following hot insertion, the crucible was removed and placed on an insulating surface, where it cooled rapidly. J.P.K. and M.W.G. performed the analyses.
Optical microscopy
To investigate micro-spherules and meltglass, we processed and analyzed sediment samples using a previously published protocol [3, 6, 8, 9]. After size-sorting with multiple screens (American Society for Testing and Materials) ranging from 4.75 mm to 53 μm, micro-spherules and meltglass were examined using optical and electron microscopy. Analyses were performed by A.M.T.M., J.P.K., M.A.L., C.R.M., and A.W.
Magnetic micro-spherules, carbon micro-spherules, glass-like carbon, and meltglass
To investigate reproducibility, six coauthors (A.M.T.M., J.P.K., M.A.L., C.R.M., T.E.B., and A.W.) independently processed samples using a previously published protocol [3, 6, 8, 9]. After size-sorting using multiple screens ranging from 4.75 mm to 53 μm (certified by the American Society for Testing and Materials), cross-sectioned and whole micro-spherules and meltglass were examined using SEM-EDS by seven coauthors (J.P.K., T.E.B., J.H.W., J.C.W., M.A.L., A.W., and A.V.A.). Results by various coauthors were statistically the same. Standard techniques were followed for all analytical methods.
Nanodiamonds
Extractions were performed using a standard protocol presented by Kinzie et al. [24] Analyses were performed with an FEI Titan 80–300 kV field-emission gun electron microscope operated at 300 kV. It was fitted with a Super Twin objective lens, a spherical-aberration-image corrector, a high-angle annular dark-field (HAADF) detector, an EDAX energy-dispersive spectrometer, and a Tridiem Gatan imaging filter. The TEM detectors were calibrated using commercial standards (Ted Pella #646). Fast Fourier Transform (FFT) of the HRTEM images and the EELS data were analyzed using Gatan Digital Micrograph software. Analyses were performed and interpreted by J.J.R. and A.W.
Neutron activation analysis
Sediment samples were analyzed for elemental abundances using INAA by ActLabs, Canada. Analyses were performed for 56 elements, loss-on-ignition (LOI), and salinity. Bulk sediment samples of ~50 g each and magnetic fractions of ~1 g were analyzed using INAA, fire assay, and inductively coupled plasma mass spectrometry (ICP-MS). Detection limits per element are in see Table S4 in ref. [40]. The accuracy of the laboratory results was verified with blanks and known standards.
SEM-EDS analyses
Compositions of meltglass and micro-spherules were determined using electron microscopy. SEM-EDS analyses were conducted in low-vacuum mode using a JEOL-6000 SEM system and a ThermoFisher Apreo 2. Analyses were performed and interpreted by M.A.L., A.V.A., T.E.B., J.C.W., G.K., J.H.W., K.L., C.R.M., W.S.W., T.W., A.W., and Jake Lowenstern.
Soot analyses
Soot carbon was isolated following a chemothermal oxidation procedure (CTO-375) [100]. Samples were demineralized sequentially at 0.2, 2, and 6N HCl until effervescence ceased and then dried. Dried samples were manually ground in a mortar and pestle to fine dust and then thermally oxidized in a muffle furnace. The furnace was set to a 24-hour cycle, with 6 hours to ramp the temperature up to 375°C, where it was held for twelve hours, followed by a six-hour cool-down period. The isolated residue is operationally defined as soot. Soot samples were ground using a mortar and pestle, then gravimetrically placed in small tin capsules sent to the UC Davis Stable Isotope Facility to quantify carbon abundance and its stable isotopic signature. Experiments were conducted and interpreted by S.M., A.M.-B., and W.S.W.
Aciniform carbon analyses
These analyses followed the procedure described by Kinzie et al. [24] Sediment samples underwent pulverization, demineralization with HCl and HF, oxidation with sodium dichromate, and investigation by SEM. W.S.W. conducted analyses; no identifiable aciniform carbon was observed.