
Significance Statement: Blood pressure, heart rate and ratios of blood pressure to heart rate in the tilted position during the simplistic tilt test had predictive value with regard to the presence, pattern, and stage of syncope during the head-up tilt test. Ratios of blood pressure to heart rate derived from ambulatory blood pressure monitoring (ABPM) may be better predictors of the presence and pattern of vasovagal syncope (VVS), while ABPM-derived blood pressure should be used to predict the time when syncope will happen. There were significant correlations in blood pressure to heart rate ratios between ABPM and the simplistic tilt test, and different VVS patterns had different correlative features. Parameters from both ABPM and the simplistic tilt test may be promising alternatives to the head-up tilt test in VVS evaluation.
Introduction
Vasovagal syncope (VVS) is the commonest cause of syncope, accounting for approximately 68.5% of syncope presentations in specialized clinical settings [1]. The head-up tilt test (HUTT) has been established as a useful tool for the evaluation of patients with suspected VVS. However, the HUTT is somewhat time-consuming in busy clinical settings and expensive for diagnosis. Additionally, no confirmed evidence supports a single measurement or a combination of measurements able to predict the HUTT result with precision [2]. Therefore, novel diagnostic tools rather than the HUTT are being explored to evaluate VVS.
Growing evidence suggests that blood pressure (BP), heart rate (HR), or their ratio may be predictive of HUTT results in advance. To date, few studies have demonstrated the role of BP, HR, BP/HR ratios from ambulatory BP monitoring (ABPM) and the simplistic tilt test (STT) which was defined as the period from the beginning to positional change during the HUTT at the basic stage, in the appearance of syncope, syncope patterns, and when syncope occurs during the HUTT in VVS patients. In a previous study [3], we observed that many VVS patients had positive responses at the time of a change from supine position to tilted position with or without isoproterenol infusion during the HUTT. Therefore, the present study aims to explore syncopal characteristics in a Chinese subpopulation, clarify predictive roles of BP, HR, and BP/HR ratios derived from ABPM and the STT with regard to the presence, pattern, and stage of syncope during the HUTT.
Methods
Study Population and Data Collection
The study consecutively enrolled 360 patients aged 15–70 years who were admitted to the Department of Cardiology of Sun Yat-sen Memorial Hospital between January 2007 and December 2017 for unexplained syncope. VVS had been diagnosed in these patients by detailed medical history, physical examination, the HUTT, and other ancillary tests. In the present study, all admitted patients aged from 15 to 70 years, received the HUTT and diagnosed as VVS on discharge for their unexplained syncope within the research period were included. Patients with histories of congestive heart failure, severe coronary heart disease, severe arrhythmia, severe structural heart disease including congenital heart disease, rheumatic heart disease and cardiomyopathy, and pulmonary hypertension that might be related to cardiac syncope were excluded from the study. Patients with clinical manifestations of cerebral infarction, cerebral hemorrhage, and traumatic brain injury that could cause neurological syncope or epilepsy, as well as clinical manifestations of orthostatic hypotension, carotid sinus syndrome, and carotid sinus syndrome were excluded from the study. Patients with significant abnormalities in examinations by electrocardiogram, dynamic electrocardiogram, echocardiography, coronary artery angiogram, invasive electrophysiological study, electroencephalogram, and magnetic resonance imaging that indicated that syncope from another cause had not been completely excluded were also excluded from the study. Finally, those with severe diseased states, including severe hepatic dysfunction and renal insufficiency, and current infectious disease and thus could not complete the HUTT and those with any medical condition that could cause syncope and who had taken any drug that could have influenced BP and HR were also excluded from the study. Individuals were assessed, investigated, and treated according to the usual institutional practice. The data collection included demographic data, medical history, body measurements, laboratory tests, electrocardiogram, dynamic electrocardiogram, ABPM, echocardiogram, computed tomography, magnetic resonance imaging, and electroencephalogram. The HUTT, coronary artery angiogram, and an invasive electrophysiological study were performed for patients who provided written informed consent. Investigations were in accordance with the Declaration of Helsinki. The present study was approved by the Ethics Committee of Sun Yat-sen Memorial Hospital of Sun Yat-sen University (SYSEC-KY-KS-2020-175), and all medical records were studied by anonymous means.
Head-Up Tilt Test
The HUTT protocol was performed and syncopal responses, syncope patterns, and syncope stages were defined as in our previous study [3]. In the present study, the HUTT was performed after other causes of syncope had been excluded. Any vasoactive drug influencing BP and HR should be withheld for at least five half-lives before the HUTT. The modified HUTT was performed for all patients in a comfortable and slightly darkened room equipped for cardiopulmonary resuscitation. The test was performed on an electrically adjustable tilt table (Siemens HUT-821, Juchi Medical, Beijing). The right antecubital intravenous line was used for isoproterenol infusion. HR was monitored throughout the test and cuff BPs were obtained every 5 min or when symptoms occurred. After the patient had initially rested for 10 min in the supine position, the table was smoothly tilted to 70°, which was defined as the STT. Subsequently, in the absence of syncope or presyncope, after 10 min in the tilted position, the table was returned to the supine position and increasing dosages of isoproterenol (1, 3, and 5 μg/min) were gradually infused in three successive stages. Each stage consisted of 10 min in the tilted position and 5 min in the supine position between stages.
Positive response was defined as the development of syncope or presyncope associated with bradycardia (marked bradycardia less than 50 beats per minute or 20% or greater decrease in HR) or hypotension (systolic BP [SBP] of 80 mmHg or less, diastolic BP [DBP] of 50 mmHg less, or 25% or greater decrease in mean arterial pressure), or both. Negative response was defined as the completion of the protocol without symptoms. Positive response was further classified into three syncope patterns: cardioinhibitory when isolated marked bradycardia occurred, vasodepressor when isolated hypotension occurred, and mixed when mild bradycardia accompanied by hypotension was observed at the time of syncope or presyncope. Positive response was further divided into four syncope stages according to the time when syncope occurred during the HUTT: basic stage (without isoproterenol infusion), low-dosage isoproterenol stage (1 μg/min), medium-dosage isoproterenol stage (3 μg/min), and high-dosage isoproterenol stage (5 μg/min). HR and BP as well as their differences and ratios in the STT stage were used to predict syncopal response, syncope patterns, and syncope stages.
Twenty-Four-Hour Ambulatory Blood Pressure Monitoring
ABPM was performed with a model 90217 device (Spacelabs Healthcare, USA). Vasoactive drugs that may influence BPs and HR were withheld for at least five half-lives before ABPM. The reliability of BPs measured with the device was checked against simultaneous measurements with a mercury sphygmomanometer before the monitoring started. Measurements were made every 30 min during daytime (6:00 to 22:00) and every 60 min during nighttime (22:00 to 6:00). BP was measured by the cuff-oscillometric method. Each SBP, DBP, and HR measurement was recorded by the device and evaluated by the software of the same system. The mean SBP, mean DBP, mean HR, and mean BP/HR ratios during a whole day (24 hours), in the daytime, at nighttime, and at each hour were evaluated.
Statistical Analysis
Continuous variables were presented as the mean ± standard deviation and were compared by the t test or one-way ANOVA with the least significant difference post hoc test within subgroups. Categorical variables were presented as the number and proportion and tested for statistical significance with the χ 2 test. General line model repeated measures were used to evaluate the distributions of parameters during ABPM. Two-tailed P values less than 0.05 were considered significant. All statistical analyses were performed with the software package SPSS for Windows version 16.0.
Results
Demographic and Clinical Characteristics of Participants
There were 360 patients, with a mean age of 42 years, enrolled in the study, including 189 males and 171 females. Because 13 patients did not complete the HUTT, 347 patients were included for further evaluation. Although coronary artery angiogram, computed tomography or magnetic resonance imaging was performed, only a few patients were found to have significant stenoses in coronary arteries or mild stroke (Table 1). Both coronary artery disease and stroke did not differ significantly between positive and negative patients. Positive patients had a higher prevalence of electrocardiogram abnormalities and a significantly lower HR at admission when compared with negative patients.
Baseline Demographics and Clinical Characteristics of the Study Population.
| Characteristic | Overall (n = 347) | Negative (n = 18) | Positive (n = 329) | P |
|---|---|---|---|---|
| Male | 189 (54.5%) | 11 (61.1%) | 178 (54.1%) | 0.633 |
| Age (years) | 42 ± 14 | 39 ± 18 | 42 ± 14 | 0.397 |
| Coronary heart disease | 21 (6.0%) | 2 (11.1%) | 19 (5.8%) | 0.298 |
| Cardiac arrhythmia | 36 (10.4%) | 1 (5.6%) | 35 (10.6%) | 0.706 |
| Hypertension | 46 (13.2%) | 1 (5.6%) | 45 (13.7%) | 0.486 |
| Diabetes mellitus | 12 (3.4%) | 1 (5.6%) | 11 (3.3%) | 0.478 |
| Stroke | 12 (3.4%) | 0 (0%) | 12 (3.6%) | 0.410 |
| Coronary angiogram | 177 (51.0%) | 9 (50%) | 168 (51.1%) | 0.930 |
| Electrophysiological study | 201 (57.9%) | 9 (50%) | 192 (58.4%) | 0.484 |
| Echocardiography abnormalities | 24 (6.9%) | 0 (0%) | 24 (7.3%) | 0.624 |
| Electrocardiogram abnormalities | 80 (23.0%) | 0 (0%) | 80 (24.3%) | 0.017 |
| Electroencephalogram | 102 (29.4%) | 9 (50%) | 93 (28.3%) | 0.049 |
| Brain CT or MRI | 188 (54.2%) | 12 (66.7%) | 176 (53.5%) | 0.275 |
| Admission heart rate (beats/min) | 74 ± 11 | 79 ± 8 | 73 ± 11 | 0.036 |
| Admission systolic blood pressure (mmHg) | 120 ± 18 | 116 ± 18 | 120 ± 18 | 0.437 |
| Admission diastolic blood pressure (mmHg) | 75 ± 10 | 73 ± 10 | 75 ± 10 | 0.358 |
| Blood hemoglobin (g/L) | 135 ± 16 | 135 ± 15 | 135 ± 16 | 0.848 |
Data are presented as the mean ± standard deviation or the number and percentage. P values are based on t tests or χ 2 tests.
CT, computed tomography; MRI, magnetic resonance imaging.
Syncopal Characteristics of the Population
A mixed pattern was the predominant subtype of VVS, which accounted for 52.0% of syncope presentations overall (Table 2). No significance was observed in the presence of prodrome, triggers, syncope duration, and syncope episodes between positive and negative groups and among syncope patterns. The cardioinhibitory group had the highest prevalence of sinus arrest when syncope happened, but long R-R intervals were rarely observed, while junctional escape rhythm occurred commonly. Overall, there was a significant difference between syncope stages and syncope patterns (Figure 1). A larger number of positive episodes occurred at the medium-dosage stage overall and among different syncope patterns. More vasodepressor patients had a positive response at an earlier stage, especially when compared with cardioinhibitory patients.
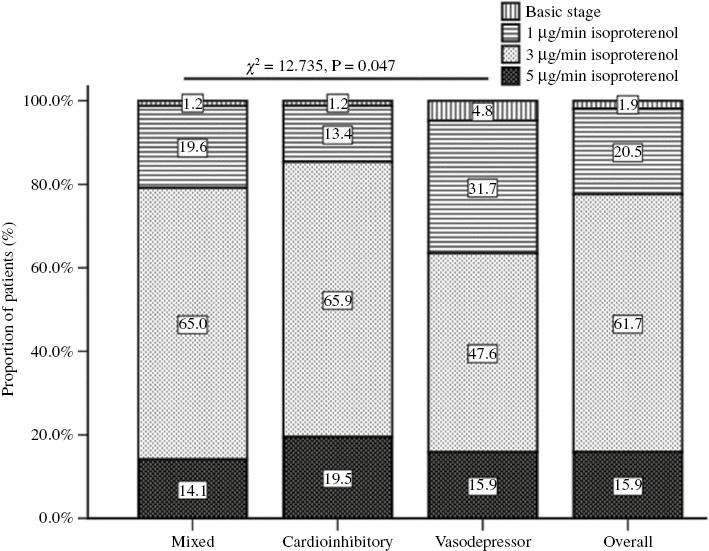
Proportion of Patients with Different Syncope Patterns at Different Stages.
P=0.021 for groups receiving isoproterenol at 1, 3, or 5 μg/min, P=0.322 for mixed versus cardioinhibitory, P=0.070 for mixed versus vasodepressor, and P=0.019 for cardioinhibitory versus vasodepressor.
Syncope Characteristics According to Tilt-Test Results.
| Characteristic | Negative | Positive | P | ||
|---|---|---|---|---|---|
| Mixed | Cardioinhibitory | Vasodepressor | |||
| Number of patients | 18 | 171 | 89 | 69 | |
| Presence of prodrome | 13 (72.2%) | 135 (78.9%) | 65 (73.0%) | 50 (72.5%) | 0.778 |
| Presence of triggers* | 15 (83.3%) | 128 (74.8%) | 68 (76.4%) | 49 (71.0%) | 0.578 |
| Syncope duration (n=16, n=142, n=80, and n=60, respectively) | 0.642 | ||||
| ≤1 min | 8 (50%) | 67 (47.2%) | 44 (55%) | 23 (38.3%) | |
| 1–10 min | 5 (31.2%) | 60 (42.2%) | 27 (33.8%) | 27 (45%) | |
| ≥10 min | 3 (18.8%) | 15 (10.6%) | 9 (11.2%) | 10 (16.7%) | |
| Syncope episodes | 0.291 | ||||
| ≤2 times | 11 (61.1%) | 78 (45.6%) | 51 (57.3%) | 30 (43.4%) | |
| ≥3 times | 7 (38.9%) | 93 (54.4%) | 38 (42.7%) | 39 (56.6%) | |
| Heart rhythm† (n=18, n=163, n=81, and n=63, respectively) | 0.004 | ||||
| Sinus rhythm | 18 (100%) | 88 (54.0%)‡ | 41 (50.6%)‡ | 60 (95.2%)§,|| | |
| Junctional escape rhythm | 0 (0%) | 63 (38.6%)‡ | 39 (48.1%)‡ | 0 (0%)§,|| | |
| Accelerated rhythm | 0 (0%) | 12 (7.4%)‡ | 1 (1.2%)‡ | 3 (4.8%)§,|| | |
Data are presented as the number and percentage. P values are based on χ 2 tests.
*Including pain, after exercise, positional change of prolonged standing, after micturition or defecation, during or after a meal, alcohol use, emotional stress, crowded or hot places, etc.
†P<0.05 for positive group, ‡P<0.05 versus negative, §P<0.05 versus mixed, ||P<0.05 versus cardioinhibitory.
Predictive Roles of BP, HR, and BP/HR Ratios Derived from the STT
Positive patients had lower HRs in both the supine position and the tilted position, which were significantly lower than in negative patients (Table 3). Significantly lower BP/HR ratios in the tilted position but not the supine position were found in positive group when compared with the negative group. Both mixed and cardioinhibitory patients had significantly lower HRs than negative patients, while no significance of HR was revealed between negative patients and vasodepressor patients. Both mixed and cardioinhibitory patients had significantly higher BP/HR ratios than negative patients in both the supine position and the tilted position and than vasodepressor patients in the tilted position. However, no significance of BP/HR ratios was found between vasodepressor and negative patients. The vasodepressor group had the largest HR difference from the supine position to the tilted position during the STT. The smaller the HR difference, the higher the isoproterenol dosage needed to induced a positive response (Table 4). SBPs in the tilted position and the SBP difference for the STT were significantly higher in the medium-dosage and high-dosage stages than in the low-dosage stage. Furthermore, patients with higher BP/HR ratios in the tilted position needed a higher dosage of isoproterenol to induce syncope.
Heart Rate and Blood Pressure Derived from the Simplistic Tilt Test According to Head-up Tilt Test Results.
| Characteristic | Negative | Positive | P | ||
|---|---|---|---|---|---|
| Mixed | Cardioinhibitory | Vasodepressor | |||
| Number of patients | 16 | 149 | 79 | 56 | |
| HR in supine position (Sp) | 76 ± 12 | 67 ± 11† | 68 ± 10† | 70 ± 13 | 0.006 |
| HR in 70° position (Tp)* | 86 ± 15 | 75 ± 13† | 77 ± 13† | 82 ± 17‡,§ | 0.010 |
| HR difference (Tp−Sp)* | 11 ± 11 | 9 ± 10 | 9 ± 10 | 12 ± 10‡,§ | 0.595 |
| SBP in supine position | 115 ± 18 | 116 ± 16 | 118 ± 17 | 115 ± 16 | 0.671 |
| DBP in supine position | 75 ± 11 | 74 ± 10 | 75 ± 13 | 73 ± 10 | 0.683 |
| SBP in 70° position | 117 ± 20 | 118 ± 15 | 120 ± 18 | 115 ± 17 | 0.814 |
| DBP in 70° position | 82 ± 18 | 78 ± 10 | 79 ± 14 | 76 ± 12 | 0.171 |
| SBP/HR ratio in supine position | 1.53 ± 0.25 | 1.77 ± 0.34† | 1.77 ± 0.34† | 1.69 ± 0.30 | 0.305 |
| DBP/HR ratio in supine position | 1.00 ± 0.15 | 1.12 ± 0.20† | 1.11 ± 0.22† | 1.08 ± 0.19 | 0.395 |
| SBP/HR ratio in 70° position | 0.96 ± 0.18 | 1.07 ± 0.20† | 1.05 ± 0.27† | 0.97 ± 0.22‡,§ | 0.015 |
| DBP/HR ratio in 70° position | 1.37 ± 0.21 | 1.62 ± 0.33† | 1.62 ± 0.39† | 1.46 ± 0.33‡,§ | 0.009 |
| SBP difference (Tp−Sp) | 2.6 ± 13.1 | 2.2 ± 8.2 | 2.0 ± 8.7 | −0.29 ± 10 | 0.739 |
| DBP difference (Tp−Sp) | 7.4 ± 14.8 | 4.9 ± 6.0 | 4.0 ± 9.6 | 3.2 ± 7.4 | 0.142 |
Data are presented as the mean ± standard deviation or the number. One-way ANOVA with the least significant difference post hoc test was used for positive subgroups, and the t test was used for comparison between positive group along with each subgroup and negative group.
DBP, diastolic blood pressure; HR, heart rate; SBP, systolic blood pressure.
*P<0.05 within positive group, ‡ †P<0.05 versus negative, ‡P<0.05 versus mixed, §P<0.05 versus cardioinhibitory.
Heart Rate and Blood Pressure Derived from the Simplistic Tilt Test According to Syncope Stages.
| Characteristic | Isoproterenol | P | ||
|---|---|---|---|---|
| 1 μg/min | 3 μg/min | 5 μg/min | ||
| Number of patients | 39 | 189 | 50 | |
| HR in supine position (Sp) | 68 ± 13 | 67 ± 10 | 70 ± 13 | 0.354 |
| HR in tilt 70° position (Tp) | 81 ± 17 | 77 ± 13 | 76 ± 14 | 0.094 |
| HR difference (Tp−Sp) | 13 ± 12 | 10 ± 10 | 6 ± 8*,† | 0.011 |
| SBP in supine position | 113 ± 15 | 116 ± 16 | 119 ± 16 | 0.306 |
| DBP in supine position | 72 ± 12 | 74 ± 11 | 76 ± 12 | 0.184 |
| SBP in 70° position | 110 ± 15 | 119 ± 16* | 121 ± 15* | 0.010 |
| DBP in 70° position | 73 ± 11 | 79 ± 11 | 80 ± 11 | 0.061 |
| SBP/HR ratio in supine position | 1.69 ± 0.38 | 1.77 ± 0.32 | 1.76 ± 0.33 | 0.447 |
| DBP/HR ratio in supine position | 1.06 ± 0.22 | 1.12 ± 0.20 | 1.12 ± 0.22 | 0.331 |
| SBP/HR ratio in 70° position | 1.44 ± 0.40 | 1.60 ± 0.34* | 1.67 ± 0.34* | 0.008 |
| DBP/HR ratio in 70° position | 0.96 ± 0.25 | 1.05 ± 0.21* | 1.11 ± 0.24* | 0.009 |
| SBP difference (Tp−Sp) | −2.3 ± 9.3 | 2.5 ± 8.5* | 2.1 ± 8.3* | 0.010 |
| DBP difference (Tp−Sp) | 1.6 ± 10.0 | 5.0 ± 6.8 | 4.1 ± 6.8 | 0.260 |
Data are presented as the mean ± standard deviation or the number. P values are based on one-way ANOVA with the least significant difference post hoc test within subgroups.
DBP, diastolic blood pressure; HR, heart rate; SBP, systolic blood pressure.
*P<0.05 versus isoproterenol at 1 μg/min, †P<0.05 versus isoproterenol at 3 μg/min.
Predictive Roles of BP, HR, and BP/HR Ratios Derived from ABPM
With the exception of the mean DBP/HR ratio during the whole day (P=0.057), the other BP/HR ratios derived from ABPM were significantly higher in the positive group than in the negative group (Table 5). Furthermore, BP/HR ratios were significantly higher in the cardioinhibitory group than in the negative group in the daytime, at nighttime, and during the whole day, while significances were observed only at nighttime between negative and mixed response patients. No significance was demonstrated in BP/HR ratios between negative and vasodepressor patients. The higher the mean SBP or DBP, the higher the isoproterenol dosage needed to induce a positive response in the daytime, at nighttime, or during the whole day (Table 6). However, there were no significant differences in the mean BP/HR ratios among syncope stages. Similarly, mean BP/HR ratios were higher in the positive group than in the negative group at each time point, although the difference was not significant (Figure 2A1–A3). Mean BP/HR ratios to predict syncope patterns were also observed at each hour (Figure 2B1–B3), while significant differences in BP were also found at each time point among syncope stages (Figure 2C1–C3). Almost no significance of ABPM-derived mean HR was found between positive and negative groups, among syncope subtypes, and among syncope stages. However, the distribution of HR at each time point had a significant difference between positive and negative groups, among syncope patterns, and among syncope stages.

The Trend of Parameters from Ambulatory Blood Pressure (BP) Monitoring According to Head-up Tilt Test Results at Each Hour.
(A1) Mean systolic BP (SBP) and diastolic BP (DBP) according to positive and negative response. (A2) Mean heart rate according to positive and negative response. (A3) Mean ratios of SBP and DBP to heart rate according to positive and negative response. (B1) Mean SBP and DBP according to syncope patterns. (B2) Mean heart rates according to syncope patterns (P=0.670 for mixed vs. cardioinhibitory, P=0.032 for mixed vs. vasodepressor, and P=0.040 for cardioinhibitory vs. vasodepressor). (B3) Mean ratios of SBP to heart rate (P=0.116 for mixed vs. cardioinhibitory, P=0.013 for mixed vs. vasodepressor, and P=0.001 for cardioinhibitory vs. vasodepressor, and mean ratios of DBP to heart rate (P=0.176 for mixed vs. cardioinhibitory, P=0.018 for mixed vs. vasodepressor, and P=0.003 for cardioinhibitory vs. vasodepressor) according to syncope patterns. (C1) Mean SBP (P=0.241 for medium-dosage isoproterenol [L-IP] vs. medium-dosage isoproterenol (M-IP), P=0.001 for L-IP vs. high-dosage isoproterenol (H-IP), and P=0.005 for M-IP vs. H-IP) and mean DBP (P=0.355 for L-IP vs. M-IP, P=0.000 for L-IP vs. H-IP, and P=0.001 for M-IP vs. H-IP) according to syncope stages. (C2) Mean heart rates according to syncope stages. (C3) Mean ratios of SBP and DBP to heart rate according to syncope stages. C, cardioinhibitory; M, mixed; V, vasodepressor.
Mean Blood Pressure, Mean Heart Rate, and their Ratios Derived from Ambulatory Blood Pressure Monitoring According to Tilt-Test Results.
| Characteristic | Negative | Positive | P | ||
|---|---|---|---|---|---|
| Mixed | Cardioinhibitory | Vasodepressor | |||
| Number of patients | 3 | 29 | 12 | 15 | |
| SBP in daytime | 118 ± 15 | 118 ± 13 | 123 ± 17 | 112 ± 16 | 0.996 |
| DBP in daytime | 72 ± 4 | 75 ± 8 | 78 ± 12 | 72 ± 11 | 0.606 |
| HR in daytime | 84 ± 9 | 75 ± 7 | 72 ± 10 | 80 ± 14§ | 0.098 |
| SBP/HR ratio in daytime* | 1.40 ± 0.01 | 1.60 ± 0.21 | 1.75 ± 0.29† | 1.42 ± 0.20‡,§ | <0.001 |
| DBP/HR ratio in daytime* | 0.83 ± 0.06 | 1.01 ± 0.14 | 1.11 ± 0.17† | 0.93 ± 0.11§ | 0.040 |
| SBP at nighttime | 100 ± 9 | 109 ± 13 | 112 ± 16 | 104 ± 16 | 0.305 |
| DBP at nighttime | 59 ± 6 | 69 ± 9 | 68 ± 12 | 66 ± 11 | 0.116 |
| HR at nighttime | 74 ± 12 | 62 ± 7 | 62 ± 10 | 67 ± 10 | 0.232 |
| SBP/HR ratio at nighttime* | 1.37 ± 0.06 | 1.77 ± 0.23† | 1.85 ± 0.38† | 1.58 ± 0.30‡,§ | 0.024 |
| DBP/HR ratio at nighttime | 0.80 ± 0.10 | 1.11 ± 0.17† | 1.13 ± 0.20† | 0.98 ± 0.16 | 0.007 |
| SBP all day | 114 ± 13 | 116 ± 12 | 119 ± 17 | 110 ± 15 | 0.859 |
| DBP all day | 69 ± 4 | 73 ± 8 | 75 ± 12 | 71 ± 11 | 0.487 |
| HR all day | 80 ± 9 | 70 ± 7 | 68 ± 10 | 75 ± 12 | 0.148 |
| SBP/HR ratio all day* | 1.43 ± 0.06 | 1.65 ± 0.22 | 1.80 ± 0.33† | 1.49 ± 0.24§ | 0.001 |
| DBP/HR ratio all day* | 0.87 ± 0.06 | 1.04 ± 0.15 | 1.12 ± 0.18† | 0.96 ± 0.13§ | 0.057 |
Data are presented as the mean ± standard deviation or the number. One-way ANOVA with the least significant difference post hoc test was used for the positive group with subgroups; the t test was used for comparison with the negative group.
DBP, diastolic blood pressure; HR, heart rate; SBP, systolic blood pressure.
*P<0.05 within positive group, †P<0.05 versus negative group, ‡P<0.05 versus mixed, §P<0.05 versus cardioinhibitory.
Mean Blood Pressure, Mean Heart Rate and their Ratios Derived from Ambulatory Blood Pressure Monitoring According to Syncope Stages.
| Characteristic | Isoproterenol | P | ||
|---|---|---|---|---|
| 1 μg/min | 3 μg/min | 5 μg/min | ||
| Number of patients | 14 | 31 | 6 | |
| SBP in daytime | 111 ± 15 | 117 ± 13 | 136 ± 14*,† | 0.002 |
| DBP in daytime | 70 ± 9 | 75 ± 10 | 86 ± 8*,† | 0.002 |
| HR in daytime | 73 ± 9 | 74 ± 8 | 82 ± 15*,† | 0.100 |
| SBP/HR ratio in daytime | 1.56 ± 0.35 | 1.61 ± 0.20 | 1.68 ± 0.23 | 0.585 |
| DBP/HR ratio in daytime | 0.99 ± 0.20 | 1.03 ± 0.13 | 1.08 ± 0.12 | 0.418 |
| SBP at nighttime | 107 ± 15 | 106 ± 13 | 124 ± 12*,† | 0.027 |
| DBP at nighttime | 66 ± 9 | 66 ± 9 | 81 ± 8*,† | 0.003 |
| HR at nighttime | 62 ± 9 | 62 ± 8 | 66 ± 13 | 0.506 |
| SBP/HR ratio at nighttime | 1.76 ± 0.35 | 1.74 ± 0.28 | 1.90 ± 0.22 | 0.474 |
| DBP/HR ratio at nighttime | 1.08 ± 0.22 | 1.08 ± 0.17 | 1.25 ± 0.10 | 0.098 |
| SBP all day | 110 ± 14 | 114 ± 12 | 132 ± 13*,† | 0.002 |
| DBP all day | 69 ± 8 | 72 ± 9 | 86 ± 7*,† | 0.001 |
| HR all day | 69 ± 9 | 69 ± 8 | 76 ± 14 | 0.206 |
| SBP/HR ratio all day | 1.62 ± 0.35 | 1.66 ± 0.22 | 1.77 ± 0.26 | 0.552 |
| DBP/HR ratio all day | 1.02 ± 0.22 | 1.04 ± 0.14 | 1.15 ± 0.10 | 0.258 |
Data are presented as the means ± standard deviation or the number. P values are based on one-way ANOVA with the least significant difference post hoc test within subgroups or χ 2 tests.
DBP, diastolic blood pressure; HR, heart rate; SBP, systolic blood pressure.
*P<0.05 versus isoproterenol at 1 μg/min, †P<0.05 versus isoproterenol at 3 μg/min.
Correlation of BP/HR Ratios between ABPM and the STT
Overall, there were significant differences in SBP/HR ratios between the STT in the supine position and ABPM in the daytime, at nighttime, and during the whole day, while for syncope subtypes, significant differences were found between the STT in the supine position and ABPM in the daytime, at nighttime, and during the whole day in mixed and vasodepressor patients but not cardioinhibitory patients (Table 7). There were significant differences in SBP/HR ratios between the STT in the tilted position and ABPM in the daytime, at nighttime, and during the whole day but not in any syncope pattern. For DBP/HR ratios, significant differences were also demonstrated overall and in mixed and vasodepressor groups but not in the cardioinhibitory group between the STT in the supine position and ABPM in the daytime, at nighttime, and during the whole day (Table 8). Furthermore, significant correlations of the DBP/HR ratio were found overall and in the cardioinhibitory group between the STT in the tilted position and ABPM in the daytime, at nighttime, and during the whole day.
Correlation of Ratios of Systolic Blood Pressure to Heart Rate Between the Simplistic Tilt Test and Ambulatory Blood Pressure Monitoring.
| Period | SBP/HR ratio in supine position | SBP/HR ratio in tilt position | ||||||
|---|---|---|---|---|---|---|---|---|
| Overall | Mixed | Cardioinhibitory | Vasodepressor | Overall | Mixed | Cardioinhibitory | Vasodepressor | |
| Daytime | 0.615‡ | 0.463* | 0.540 (NS) | 0.710† | 0.548‡ | 0.334 (NS) | 0.488 (NS) | 0.403 (NS) |
| Nighttime | 0.625‡ | 0.568† | 0.436 (NS) | 0.644* | 0.500‡ | 0.382 (NS) | 0.379 (NS) | 0.423 (NS) |
| All day | 0.649‡ | 0.539† | 0.535 (NS) | 0.732† | 0.548‡ | 0.354 (NS) | 0.509 (NS) | 0.445 (NS) |
Data are presented as correlation coefficients. P values are based on the Pearson correlation test.
HR, heart rate; NS, not significant; SBP, systolic blood pressure.
*P<0.05, ††P<0.01, ‡P<0.001.
Correlation of Ratios of Diastolic Blood Pressure to Heart Rate Ratios Between the Simplistic Tilt Test and Ambulatory Blood Pressure Monitoring.
| Period | DBP/HR ratio in supine position | DBP/HR ratio in tilt position | ||||||
|---|---|---|---|---|---|---|---|---|
| Overall | Mixed | Cardioinhibitory | Vasodepressor | Overall | Mixed | Cardioinhibitory | Vasodepressor | |
| Daytime | 0.577‡ | 0.500* | 0.564 (NS) | 0.596* | 0.504‡ | 0.461* | 0.774† | 0.293 (NS) |
| Nighttime | 0.581‡ | 0.517† | 0.447 (NS) | 0.690† | 0.607‡ | 0.356 (NS) | 0.617* | 0.402 (NS) |
| All day | 0.612‡ | 0.529† | 0.573 (NS) | 0.689† | 0.622‡ | 0.422* | 0.786† | 0.399 (NS) |
Dates are presented as correlation coefficients. P values are based on the Pearson correlation test.
DBP, diastolic blood pressure; HR, heart rate; NS, not significant.
*P<0.05, †P<0.01, ‡P<0.001.
Discussion
The detailed medical history, physical examination, including supine and standing BP measurements, and electrocardiogram are usually used for diagnosis of VVS. However, additional tests may be performed for specific features that need further evaluation. Echocardiogram, angiogram, electrophysiological study as well as electroencephalogram, computed tomography and magnetic resonance imaging of the brain are not recommended for causal diagnosis of syncope, unless patients have specific features that need further evaluation [4, 5]. Our findings further demonstrated that the aforementioned tests have low diagnostic yield and very high cost for diagnosis. Therefore, it is meaningful to avoid costly or invasive tests in patients without a complete evaluation with simple methods.
The HUTT is widely accepted as a useful tool to demonstrate the susceptibility of a vasovagal response to a change from the supine position to the tilted position. If the diagnosis is unclear after initial evaluation, the HUTT can be useful for patients with suspected VVS [5]. The HUTT for the diagnosis of VVS is useful and should not be abolished [6]. There was a positive response in 94.8% of our selected patients, and more than half of positive reactions occurred with a isoproterenol infusion dosage of 3 μg/min. Overall, mixed vasovagal response is the commonest syncope pattern. The prevalence of syncope pattern is inconsistent with another study [7], and difference in age and population selection might partly account for the phenomenon. However, the HUTT is somewhat time-consuming and expensive for diagnosis in busy clinical settings, and thus the STT and ABPM explored in the present study may be used as alternative tools in the clinical diagnosis of VVS.
Syncope during the HUTT seemed to be preceded by increased sympathetic activity manifested by an increase in HR as well as by a decreased parasympathetic tone before the episode [8]. A prediction algorithm using simultaneous analysis of HR and SBP during the HUTT has been found to be a clinically relevant tool and could have applications, including providing a patient alarm, shortening the tilt-test time, and triggering pacing intervention in implantable devices [9, 10]. Other studies also demonstrated that HR and BP are useful parameters for the prediction of VVS subtypes during the HUTT [9, 11]. As for other findings [2], the present study revealed that patients with a positive test result had significantly lower HR during the STT. Significantly lower HRs mainly account for mixed and cardioinhibitory patterns rather than negative and vasodepressor patients. The changes in BP from the STT are different from those in pediatric VVS patients [12], suggesting different mechanisms account for different age groups. Consistent with other findings [13], changes in HR during the STT tended to be larger in vasodepressor patients than in mixed and cardioinhibitory patients, with the largest HR difference occurring in vasodepressor patients. Resting SBP was higher in cardioinhibitory patients than in vasodepressor patients during the STT, which is consistent with other findings [13]. Our findings demonstrated that BP/HR ratios in the tilted position could predict a positive response and when syncope would happen. The higher the BP/HR ratio in the tilted position, the greater possibility of a cardioinhibitory pattern and the higher the isoproterenol dosage needed to induce an episode. The larger the HR difference during the STT, the shorter the time to the occurrence of syncope. BP/HR ratios in the 70° position during the STT may be used as good predictors of a positive response, especially to indicate the cardioinhibitory pattern, as well as to predict the time when syncope will occur. In contrast, HR difference and SBP difference during the STT may predict syncope stages but not syncope patterns. These findings suggest that a prediction algorithm using simultaneous analysis of HR and BP from the STT may be favored for use in a busy clinical practice and free patients from experiencing syncope during the HUTT, even as an alternative to the expensive and time-consuming HUTT.
Although ABPM is generally not diagnostically helpful in patients who experience syncope, it does play a role in the monitoring of hypotension as well as therapeutic interventions [4, 14]. ABPM may help identify larger patients at high risk of syncope episodes and whether BP is low during syncope episodes [4, 15], and be used as a noninvasive tool for exclusion of postural hypotension that is more sensitive than the HUTT [16]. However, little is known about ABPM-derived BP, HR, and BP/HR ratios for predicting HUTT results in VVS patients. Our present study demonstrates that mean BP/HR ratios differed between positive and negative groups in the daytime, at nighttime, during the whole day, and at each time point. Furthermore, our study also demonstrates that BP/HR ratios were significantly higher in cardioinhibitory patients but not vasodepressor patients in comparison with the negative group in the daytime, at nighttime, and during the whole day. The mean SBP in the daytime was indistinguishable between the positive and negative groups, but was significantly lower than in the control group in another study [17]. The derivative of the ratio between R-R interval and SBP was also demonstrated to be able to predict the occurrence of syncope in all three patterns of VVS in advance during the HUTT [18]. Predicting the occurrence of syncope in advance during the HUTT could be useful to prevent complications associated with the procedure, particularly in patients without any prodrome. Our findings demonstrate that the lower the ABPM-derived BP, the earlier the time of occurrence of syncope. Additionally, patients with higher BPs at each time point usually have a positive response with the need for high-dosage isoproterenol. It is anticipated that BP/HR ratios may be better predictors of the presence and pattern of VVS, while BP should be used to predict the time when syncope will happen during the HUTT.
Our findings further demonstrate that there are significant correlations of BP/HR ratios between ABPM and the STT. For syncope patterns, our findings firstly demonstrated that the correlation of SBP/HR and DBP/HR ratios in the supine position and ABPM may indicate a vasodepressor pattern, while the correlation of DBP/HR ratio in the tilted position and ABPM may suggest a cardioinhibitory subtype. Furthermore, the mixed pattern shares features of correlations of both vasodepressor and cardioinhibitory patterns between ABPM and the STT. It is obvious that different syncope patterns share different BP/HR ratios and different correlative patterns between ABPM and the STT. These findings suggest that BP/HR ratios derived from ABPM may be used in combination with the STT to provide valuable information in the diagnosis of VVS, especially in the discrimination of cardioinhibitory patients from vasodepressor patients. However, a larger population with control groups is needed to explore diagnostic cut-points of these parameters from ABPM and the STT for management of VVS.
For extra information, please see the supplementary Figures S1–S3 online and also the supplementary information for Tables 3–6.
Limitations
The cross-sectional and single-center nature is an important limitation of the present study. Additionally, that fewer patients in the negative group and not all patients had ABPM are other limitations of the present study. Attention should also be paid to the gap between the minimum and the maximum ages in the present study because age can sometimes affect the mechanisms and patterns of syncope. Finally, the cut-points for the diagnosis of VVS from both ABPM and the STT could not be provided because of the small population.
Conclusion
In summary, the STT providing diagnostic parameters, such as BP, HR, and BP/HR ratios, should be used as an alternative to the HUTT in busy clinical settings. BP/HR ratios derived from ABPM may be better predictors of the presence and pattern of VVS, while ABPM-derived BP should be used to predict the time when syncope will happen. It is believed that ABPM should be a cost-effective and noninvasive diagnostic method in combination with the STT for VVS evaluation and management, especially in patients refusing to have the HUTT and in busy clinical settings.