29
views
0
recommends
+1 Recommend
0 collections
    0
    shares
      • Record: found
      • Abstract: found
      • Article: found
      Is Open Access

      Tools for Address Georeferencing – Limitations and Opportunities Every Public Health Professional Should Be Aware Of

      research-article

      Read this article at

      Bookmark
          There is no author summary for this article yet. Authors can add summaries to their articles on ScienceOpen to make them more accessible to a non-specialist audience.

          Abstract

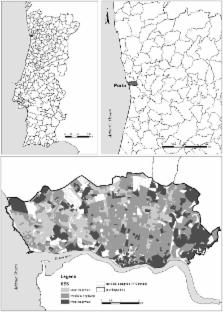
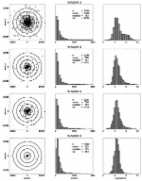
          Various address georeferencing (AG) tools are currently available. But little is known about the quality of each tool. Using data from the EPIPorto cohort we compared the most commonly used AG tools in terms of positional error (PE) and subjects' misclassification according to census tract socioeconomic status (SES), a widely used variable in epidemiologic studies. Participants of the EPIPorto cohort (n = 2427) were georeferenced using Geographical Information Systems (GIS) and Google Earth (GE). One hundred were randomly selected and georeferenced using three additional tools: 1) cadastral maps (gold-standard); 2) Global Positioning Systems (GPS) and 3) Google Earth, single and in a batch. Mean PE and the proportion of misclassified individuals were compared. Google Earth showed lower PE than GIS, but 10% of the addresses were imprecisely positioned. Thirty-eight, 27, 16 and 14% of the participants were located in the wrong census tract by GIS, GPS, GE (batch) and GE (single), respectively (p<0.001). Misclassification according to SES was less frequent but still non-negligible −14.4, 8.1, 4.2 and 2% (p<0.001). The quality of georeferencing differed substantially between AG tools. GE seems to be the best tool, but only if prudently used. Epidemiologic studies using spatial data should start including information on the quality and accuracy of their georeferencing tools and spatial datasets.

          Related collections

          Most cited references17

          • Record: found
          • Abstract: found
          • Article: not found

          On the wrong side of the tracts? Evaluating the accuracy of geocoding in public health research.

          This study sought to determine the accuracy of geocoding for public health databases. A test file of 70 addresses, 50 of which involved errors, was generated, and the file was geocoded to the census tract and block group levels by 4 commercial geocoding firms. Also, the "real world" accuracy of the best-performing firm was evaluated. Accuracy rates in regard to geocoding of the test file ranged from 44% (95% confidence interval [CI] = 32%, 56%) to 84% (95% CI = 73%, 92%). The geocoding firm identified as having the best accuracy rate correctly geocoded 96% of the addresses obtained from the public health databases. Public health studies involving geocoded databases should evaluate and report on methods used to verify accuracy.
            Bookmark
            • Record: found
            • Abstract: found
            • Article: found
            Is Open Access

            Accuracy of commercial geocoding: assessment and implications

            Background Published studies of geocoding accuracy often focus on a single geographic area, address source or vendor, do not adjust accuracy measures for address characteristics, and do not examine effects of inaccuracy on exposure measures. We addressed these issues in a Women's Health Initiative ancillary study, the Environmental Epidemiology of Arrhythmogenesis in WHI. Results Addresses in 49 U.S. states (n = 3,615) with established coordinates were geocoded by four vendors (A-D). There were important differences among vendors in address match rate (98%; 82%; 81%; 30%), concordance between established and vendor-assigned census tracts (85%; 88%; 87%; 98%) and distance between established and vendor-assigned coordinates (mean ρ [meters]: 1809; 748; 704; 228). Mean ρ was lowest among street-matched, complete, zip-coded, unedited and urban addresses, and addresses with North American Datum of 1983 or World Geodetic System of 1984 coordinates. In mixed models restricted to vendors with minimally acceptable match rates (A-C) and adjusted for address characteristics, within-address correlation, and among-vendor heteroscedasticity of ρ , differences in mean ρ were small for street-type matches (280; 268; 275), i.e. likely to bias results relying on them about equally for most applications. In contrast, differences between centroid-type matches were substantial in some vendor contrasts, but not others (5497; 4303; 4210) pinteraction < 10-4, i.e. more likely to bias results differently in many applications. The adjusted odds of an address match was higher for vendor A versus C (odds ratio = 66, 95% confidence interval: 47, 93), but not B versus C (OR = 1.1, 95% CI: 0.9, 1.3). That of census tract concordance was no higher for vendor A versus C (OR = 1.0, 95% CI: 0.9, 1.2) or B versus C (OR = 1.1, 95% CI: 0.9, 1.3). Misclassification of a related exposure measure – distance to the nearest highway – increased with mean ρ and in the absence of confounding, non-differential misclassification of this distance biased its hypothetical association with coronary heart disease mortality toward the null. Conclusion Geocoding error depends on measures used to evaluate it, address characteristics and vendor. Vendor selection presents a trade-off between potential for missing data and error in estimating spatially defined attributes. Informed selection is needed to control the trade-off and adjust analyses for its effects.
              Bookmark
              • Record: found
              • Abstract: found
              • Article: found
              Is Open Access

              Geographic bias related to geocoding in epidemiologic studies

              Background This article describes geographic bias in GIS analyses with unrepresentative data owing to missing geocodes, using as an example a spatial analysis of prostate cancer incidence among whites and African Americans in Virginia, 1990–1999. Statistical tests for clustering were performed and such clusters mapped. The patterns of missing census tract identifiers for the cases were examined by generalized linear regression models. Results The county of residency for all cases was known, and 26,338 (74%) of these cases were geocoded successfully to census tracts. Cluster maps showed patterns that appeared markedly different, depending upon whether one used all cases or those geocoded to the census tract. Multivariate regression analysis showed that, in the most rural counties (where the missing data were concentrated), the percent of a county's population over age 64 and with less than a high school education were both independently associated with a higher percent of missing geocodes. Conclusion We found statistically significant pattern differences resulting from spatially non-random differences in geocoding completeness across Virginia. Appropriate interpretation of maps, therefore, requires an understanding of this phenomenon, which we call "cartographic confounding."
                Bookmark

                Author and article information

                Contributors
                Role: Editor
                Journal
                PLoS One
                PLoS ONE
                plos
                plosone
                PLoS ONE
                Public Library of Science (San Francisco, USA )
                1932-6203
                2014
                3 December 2014
                : 9
                : 12
                : e114130
                Affiliations
                [1 ]Instituto de Engenharia Biomédica - INEB, Universidade do Porto, Porto, Portugal
                [2 ]Departamento de Epidemiologia Clínica, Medicina Preditiva e Saúde Pública, Faculdade de Medicina do Porto, Universidade do Porto, Porto, Portugal
                [3 ]Instituto de Saúde Pública da Universidade do Porto - ISPUP, Porto, Portugal
                Kenya Medical Research Institute - Wellcome Trust Research Programme, Kenya
                Author notes

                Competing Interests: The authors have declared that no competing interests exist.

                Conceived and designed the experiments: AIR MFP. Performed the experiments: AIR AO HT AM MFP. Analyzed the data: AIR. Contributed reagents/materials/analysis tools: AIR AO HT AM MFP. Wrote the paper: AIR.

                Article
                PONE-D-14-21498
                10.1371/journal.pone.0114130
                4254921
                25469514
                0415e079-3868-41e8-bf8d-ea95223c34d9
                Copyright @ 2014

                This is an open-access article distributed under the terms of the Creative Commons Attribution License, which permits unrestricted use, distribution, and reproduction in any medium, provided the original author and source are credited.

                History
                : 16 May 2014
                : 3 November 2014
                Page count
                Pages: 13
                Funding
                This work was financed by FCT – Fundação para a Ciência e a Tecnologia ( http://www.fct.pt/) in the framework of the project PTDC/SAU-EPI/113424/2009 and SFRH/BD/82529/2011 fellowship. The funders had no role in study design, data collection and analysis, decision to publish, or preparation of the manuscript.
                Categories
                Research Article
                Computer and Information Sciences
                Geoinformatics
                Geographic Information Systems
                Spatial Analysis
                Earth Sciences
                Geography
                Human Geography
                Neighborhoods
                Medicine and Health Sciences
                Epidemiology
                Environmental Epidemiology
                Epidemiological Methods and Statistics
                Spatial Epidemiology
                Public and Occupational Health
                Behavioral and Social Aspects of Health
                Disease Ecology
                Custom metadata
                The authors confirm that, for approved reasons, some access restrictions apply to the data underlying the findings. Data used in this study came from the EPIPorto Project. The EPIPorto study protocol was approved by the Hospital São João Ethics Committee, in 1996, and it is under the responsibility of Professor Henrique Barros, director of the Institute of Public Health and of the Department of Epidemiology, University of Porto Medical School. In the present study the authors used individual-level information - exact address location, health-related behaviors and anthropometric measures - which cannot be disseminated due to confidentiality issues. The EPIPorto study protocol is in accordance with the Helsinki Declaration principles, which means ‘Every precaution must be taken to protect the privacy of research subjects and the confidentiality of their personal information.' Nevertheless, a formal request to the person responsible for the study (Professor Henrique Barros) can be made by anyone interested in developing scientific research based on data collected within the EPIPorto study. Further information can be found at the Institute of Public Health website: http://www.ispup.up.pt/index.php?cid=Coortes&lang=en.

                Uncategorized
                Uncategorized

                Comments

                Comment on this article