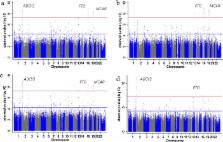
Introduction The accumulation of abnormal amounts of intra-abdominal fat (central adiposity) is associated with serious adverse metabolic and cardiovascular outcomes, including type 2 diabetes (T2D) and atherosclerotic heart disease [1]. Indeed, because the medical consequences of increasing fat mass are disproportionately attributable to the extent of central adiposity, measures of overall adiposity, such as body mass index (BMI), fail to capture all of this risk [2],[3]. Measures of central and overall adiposity are highly correlated (BMI has r2∼0.9 with waist circumference [WC] and ∼0.6 with waist-hip ratio [WHR], Table S1). WC and WHR are correlated with more precise measures of intra-abdominal fat measured by MRI in obese women (r2∼0.6 and 0.5, respectively) [4]. Several lines of evidence indicate that individual variability in patterns of fat distribution involves local, depot-specific processes, which are independent of the predominantly neuronal mechanisms that control overall energy balance. First, anthropometric measures of central adiposity are highly heritable [5] and, after correcting for BMI, heritability estimates remain high (∼60% for WC and ∼45% for WHR) [6]. Second, there are substantial gender-specific differences in fat distribution, and these appear to reflect genetic influences [7]. Third, uncommon monogenic syndromes (the partial lipodystrophies) demonstrate that DNA variants can have dramatic effects on the development and/or maintenance of specific regional fat-depots [8]. Efforts to identify common and rare variants influencing BMI and risk of obesity have emphasized the key role of neuronal (hypothalamic) regulation of overall adiposity [9]–[17] but provided few clues to processes that are specifically responsible for individual variation in central obesity and fat distribution. Definition of the mechanisms involved in the regulation of fat distribution in general, and visceral fat mass in particular, is therefore key to understanding obesity and its accompanying morbidity and mortality. Given the challenges associated with the pharmacological manipulation of hypothalamic processes, the identification of pathways influencing abdominal fat accumulation would also present novel opportunities for therapeutic development. With this in mind, we set out to identify genetic loci influencing anthropometric measures of central obesity and fat distribution, namely, WC and WHR. Our meta-analysis of 16 genome wide association studies (GWAS), followed by large-scale replication testing, generating a combined sample of up to 118,691 individuals of European origin, has identified three loci associated with these critical biomedical traits. Results/Discussion Our strategy for identifying common variants influencing central adiposity is summarized in Figure 1. The study was based on an initial (“stage 1”) meta-analysis of GWAS data to identify SNPs strongly-associated with measures of central adiposity (see Table S2). We then focused our “stage 2” follow-up efforts on the subset of those signals for which the strength of the evidence of association for measures of central adiposity (WC and WHR) appeared to be substantially stronger than that observed for overall adiposity and/or height. We reasoned that this subset of signals would be enriched for variants with preferential influences on central fat accumulation. 10.1371/journal.pgen.1000508.g001 Figure 1 Project outline. We started out with a meta-analysis of GWAS data from 16 cohorts comprising 38,580 individuals informative for WC and 37,670 for WHR. We selected 23 SNPs of our top signals based on the following criteria (Table S2): preliminary stage 1 meta-analysis P-value≤10−5, BMI P-value>0.01 and height P-value>5×10⁻³. We supplemented these 23 independent loci (r2 0.8) with markers that represent two of the strongest signals for overall adiposity (Table S10) [9]–[10], [12]–[14], [16]–[17],[20]. 10.1371/journal.pgen.1000508.g002 Figure 2 Genome-wide association results for GIANT (Stage 1). A. Manhattan plots showing significance of association of all SNPs in the Stage 1 GIANT meta-analysis with central obesity phenotypes. SNPs are plotted on the x-axis according to their position on each chromosome against association with central obesity measure (WC or WHR) on the y-axis (shown as −log10 P-value). SNPs that have been previously reported to show association with BMI is shown in blue [10],[14],[16] and the two regions showing strong associations in the overall, non-gender-stratified analyses are shown in green. Other SNPs taken forward into stage 2 follow-up are indicated in red. B. Quantile-quantile (QQ) plots of SNPs; after Stage 1 GIANT meta-analysis (black) and after removing any SNPs surrounding the recently reported BMI loci [10], [14], [16]–[17] (blue). The grey areas in the QQ plots represent the 95% confidence intervals around the test statistics and after excluding the recently reported BMI loci [10], [14], [16]–[17], there is no indication of excess of signal. In Silico and De Novo Follow-Up From this initial set of 76 WC- and/or WHR- associated signals, we sought to enrich for variants with specific impacts on central adiposity, by identifying a subset of 23 SNPs for which there was greatest evidence for a disproportionate effect on central adiposity, as opposed to overall adiposity or height. These 23 variants all had strong (i.e. P≤10−5) associations with WC and/or WHR while displaying only weak evidence of an association with overall adiposity (BMI, P>0.01) or adult height (P≥0.005) in the stage 1 GWAS meta-analysis data (Table S2). We also included three variants for reasons of biological candidacy, even though they did not precisely meet all P-value threshold criteria (see Table S2). Given the stage 1 sample size of 38,580, the follow-up P-value threshold of 10−5 provides 80% power to detect a per-allele beta of 0.045 (equivalent, for example, to a per-allele effect on WC of approximately 0.5 cm), given an additive model and MAF of 20%. For these 26 SNPs, we obtained in silico follow-up data from another 8 studies with GWAS data (Stage 2a: maximum N = 13,830 individuals, all European-ancestry), and performed de novo genotyping in subjects from 20 additional studies (Stage 2b: maximum N = 56,859, all European-ancestry) (Table S3). Follow-up analyses were restricted to the precise phenotype(s) (WC and/or WHR) for which the SNP had been selected in stage 1 making a total of 30 SNP-phenotype combinations (Tables S2 and S6). After combining gender- and study-specific measures of association across all studies (maximum possible N = 109,269: Tables S2 and S3), we identified three signals reaching genome-wide levels of significance in the joint analysis of stage 1 and stage 2 data (P 50% imputation accuracy cannot be achieved for this SNP. On the other hand, knowledge of the haplotype does provide useful information about the SNP, and the rsq_hat statistic takes a value of about 0.44 in this setting. There are examples of association between imputed SNPs with similar rsq_hat statistics and complex traits that have been confirmed in follow-up genotyping (e.g. the association between CETP and HDL cholesterol) [16]. The studies analysed with IMPUTE typically used an additional filter to exclude imputed genotypes with a posterior probability 0.2 with that SNP, then proceeding to the next strongly associated SNP remaining. Seventy-six independent loci each represented by one main SNP met these criteria in our preliminary analysis. Previous experience with genome-wide association studies of anthropometric traits such as BMI [10], [14], [16]–[17],[20] and height [43]–[46] suggested that large numbers of additional samples would be required to establish association at levels of genome-wide significance. We focused our attention on 23 SNPs that showed strong association with at least one of the waist phenotypes, but with less significant evidence of association with BMI (p>0.01) and height (p>0.005), from previous analyses performed of stage 1 GWAS data within the GIANT consortia. These 23 SNPs thus had significantly stronger evidence of association with the waist phenotypes in our initial genome wide meta-analysis data than with BMI or height in previous meta-analyses involving comparable numbers of subjects. We also added three SNPs that, despite not meeting all the P-value selection criteria, were near the borderline (Table S2) and for which biological credentials warranted selection: rs7970350, which maps very near the HMGA2 (12q15) gene. In addition to being a strong biological candidate for height, HMGA2 is a strong biological candidate for obesity; rare mutations in this gene have previously been shown to alter body size in mice and humans. Hmga2−/− mice have a deficiency in fat tissue and resist diet-induced obesity [47]. Furthermore, the expression of a truncated HMGA2 gene induces gigantism associated with lipomatosis [48]. This marker is in perfect linkage disequilibrium (LD) (r2 = 1) with a previously described locus for height (rs1042725) [43],[45],[46]. Given the low correlation between waist-circumference and height, as well as the obvious candidacy for both height and obesity, we hypothesized that this loci might affect body shape (i.e. with independent effects on height and obesity). rs11970116, which maps ∼90 kb upstream of the hypocretin (orexin) receptor 2 gene, HCRTR2 (6p11-q11). Orexins and their receptors are good candidate genes for adiposity as the orexin pathway has been implicated in the control of energy homeostasis as well as in narcolepsy and sleep patterns (ref 21). It has also been reported that hypothalamic orexin promotes appetite and that HCRTR2 signaling confers resistance to diet-induced features of the metabolic syndrome through negative energy homeostasis and improved leptin sensitivity [49]–[51]. rs987237, which maps to intron 3 of the TFAP2B (6p12) gene to add a second SNP in the vicinity of this locus in addition to rs4715215 that was already selected as one of our 23 SNPs for follow-up (pair wise r2 = 0.236; D′ = 1). While rs4715215 is located ∼145 kb downstream of TFAP2B, rs987237 is located within the gene transcript (Figure 2). Thus, including both the 23 SNPs meeting our filtering criteria and the three additional variants, we targeted a total of 26 independent SNPs for replication in additional samples. As there were some SNPs for which the stage 1 association met the selection criteria for more than one of the waist phenotypes, there were 30 analyses to be performed (see Tables S2 and S6). Follow-Up in Independent GIANT Consortium Samples (GIANT Stage 2) Studies and phenotypes For our own Stage 2 analysis, we sought follow-up samples from two independent routes: we included studies with pre-existing GWAS in-silico data (stage 2a) as well as de novo genotyping (stage 2b) comprising 27 cohorts for WC and 21 cohorts for WHR. Among these stage 2 studies, 18 studies were also able to provide data on BMI, weight, and height. All individuals included in stage 2 studies were of European ancestry and provided informed consent. All studies were approved by the local ethics committees. Study-specific information on study design and participants, phenotype means, and experimental detail for all stage 2 studies are included in Tables S3, S4, S5. Additional phenotypes In addition to data on the waist phenotypes (WC and WHR) and other relevant anthropometric traits (BMI, weight, and height), we also had some cohorts from both stage 1 and stage 2 which were able to provide bioimpedance data (BIA) and/or Dual energy X-ray absorptiometry (DXA). In stage 1, three studies were informative for BIA (maximum N = 9,852), and two (maximum N = 2,308) had data on DXA. In stage 2, a total of seven cohorts had BIA (maximum N = 20,934) and six had DXA data (maximum N = 12,954). Thus, the total sample size for BIA and DXA was 30,786 or 15,262, respectively. Genotypes Genotypes were obtained from stage 2a studies, in which each SNP was either directly genotyped or imputed from genome-wide data using the CEU HapMap reference panel, and from stage 2b using de novo genotyping undertaken using a variety of platforms including Biotrove, Centaurus, KASPar, Sequenom, Sequenom iPLEX, and TaqMan-based assays. Genotyping platforms, calling algorithms, quality control before imputation, imputation methods, and analysis software used were all study-specific (see Table S5 for detailed information on each study). The explicit number of follow-up SNPs genotyped in each study and whether a proxy SNP was used is summarized in Table S6. Study-specific stage 2 association analyses To analyze the two waist phenotypes in the stage 2 studies, we used the same analysis model as in stage 1 (inverse-normal transformed WC or WHR adjusted for age and age2 analyzed in a linear regression, all performed separately in men and women). Additional analyses were performed - all separately in men and women and all using an additive genetic effect model - to obtain: waist phenotype association independent from overall obesity (using inverse-normal transformed WC or WHR adjusted for age, age2 and BMI) raw estimates of effect sizes for WC and WHR (using untransformed WC or WHR, adjusted for age and age2) raw estimates of BMI effect sizes (using untransformed BMI adjusted for age and age2) association estimates in studies with % fat phenotypes (using untransformed % total fat BIA, % total fat DXA, % central fat DXA adjusted for age and age2). GIANT Stage 2 meta-analyses We performed a meta-analysis for the phenotypes of primary interest (WC and WHR) of all stage 2 studies using the same methods as in stage 1 (pooled P-values using the weighted Z-score method; pooled β- and SE estimates using the fixed effect method; as well as heterogeneity statistics). Meta-analysis of all GIANT data (stage 1+stage 2) We combined GIANT stage 1 and stage 2 samples to derive a combined meta-analysis of all studies, performed in the same manner as in stage 1 and stage 2 analyses. Results from stage 1 and stage 2 studies were combined into one N-way meta-analysis. Five of the 26 loci that were selected for follow up show nominal evidence of association with both WC and WHR (TFAP2B (rs987237) was one of these). However, for none of these loci did the association with WHR reach genome-wide significance in the overall, combined analysis (Table S2). GIANT Gender-specific meta-analysis (stage 1, stage 2, and stage 1+2) The waist phenotypes exhibit strong gender-differences and evidence for some genetic effects on fat distribution [7], so we performed additional meta-analyses of our stage 1 GWAS in which men and women were analyzed separately. We also tested whether the effect estimate resulting from the gender-specific fixed effect meta-analysis differed significantly between men and women by applying a t-test comparing β-effect and SE estimates in men with the β-effect and SE estimates in women. The gender-specific meta-analyses were performed on stage 1, stage 2, and combined stage 1+2 data. Additional Replication through Further Follow-Up Using In Silico Results from the CHARGE Consortium Further, our genome wide signals for WC identified after stage 2 were confirmed using data from the “Cohorts for Heart and Aging Research in Genomic Epidemiology” (CHARGE) consortium, which members had performed a GWAS meta-analysis of 31,375 samples for WC (Table 1). Studies, phenotypes, and genotypes The CHARGE consortium consisted of 31,375 individuals from 8 studies informative for WC, though two studies overlapped with our stage 2a studies (the Erasmus Rucphen Family Study (ERF) and the Rotterdam Study (ERGO), (up to 6,702 individuals) which were included in both CHARGE and stage 2 data, but which are counted only once in the overall meta-analysis. Meta-analysis of stage 1+2 results with CHARGE data We combined the association results for WC from the GIANT and CHARGE samples to derive a combined meta-analysis of all studies (Figure 1). This analysis was performed using the METAL software for pooling of the P-values based on the weighted Z-score method, using the P-values calculated in our stage 1+2 meta-analysis (excluding ERF and ERGO) along with the P-values from CHARGE. For a more detailed description of the CHARGE consortium studies and their analysis methods, ([Fox et al. submitted to PLOS Genetics (2008)] and [http://web.chargeconsortium.com/]). For the MSRA locus, genotypes for rs7826222 were only available for a subset of the CHARGE samples (N = 8,097). This is due to the fact that this SNP has been renamed to rs545854 in NCBI build 36 and was consequently one of the SNPs omitted from HapMap release 22 and therefore is not present in build 36 imputations based on that release of HapMap. Nonetheless, the effect of rs7826222 in CHARGE was directionally-consistent (P = 0.28), and CHARGE data available in larger sample size (N = 31,372) for two moderately-good proxies (rs1876511 and rs613080, both r2 = 0.76 with rs7826222/rs545854) and both show some support (both had directionally-consistent effect-sizes and P = 0.078) with the other findings. Supporting Information Table S1 Phenotypic correlation between anthropometric values in men and women. (0.02 MB XLS) Click here for additional data file. Table S2 The loci that were followed up in GIANT Stage 2. (0.04 MB XLS) Click here for additional data file. Table S3 Description of samples included in the GWA meta-analysis (Stage 1) and follow-up studies (stage 2). (0.03 MB XLS) Click here for additional data file. Table S4 Descriptive characteristics of genome-wide association study cohorts (Stage 1) and follow-up study cohorts (Stage 2). (0.04 MB XLS) Click here for additional data file. Table S5 Information on genotyping methods, quality control of SNPs, imputation, and statistical analysis for Stage 1 and 2 study cohorts. (0.04 MB XLS) Click here for additional data file. Table S6 Lead markers and proxies used in stage 2 replication. (0.03 MB XLS) Click here for additional data file. Table S7 Association analysis of fat phenotypes using raw estimates for the significant loci. (0.02 MB XLS) Click here for additional data file. Table S8 The effect of the genome wide significant adiposity loci on lipids within ENGAGE cohorts. (0.02 MB XLS) Click here for additional data file. Table S9 The effect of the genome wide significant adiposity loci on type 2 diabetes risk. (0.02 MB XLS) Click here for additional data file. Table S10 The association results for waist-circumference and waist-hip-ratio to the recently reported 17 BMI loci. (0.03 MB XLS) Click here for additional data file. Text S1 Supporting text and acknowledgments. (0.16 MB DOC) Click here for additional data file.