4
views
0
recommends
+1 Recommend
2 collections
    0
    shares
      • Record: found
      • Abstract: found
      • Article: not found

      Measuring differences between phenomenological growth models applied to epidemiology

      research-article

      Read this article at

      ScienceOpenPublisherPMC
      Bookmark
          There is no author summary for this article yet. Authors can add summaries to their articles on ScienceOpen to make them more accessible to a non-specialist audience.

          Abstract

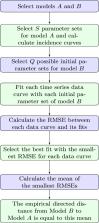
          Phenomenological growth models (PGMs) provide a framework for characterizing epidemic trajectories, estimating key transmission parameters, gaining insight into the contribution of various transmission pathways, and providing long-term and short-term forecasts. Such models only require a small number of parameters to describe epidemic growth patterns. They can be expressed by an ordinary differential equation (ODE) of the type C ( t ) = f ( t , C ; Θ ) for t > 0 , C ( 0 ) = C 0 , where  t is time, C ( t )  is the total size of the epidemic (the cumulative number of cases) at time  t , C 0  is the initial number of cases, f  is a model-specific incidence function, and Θ  is a vector of parameters. The current COVID-19 pandemic is a scenario for which such models are of obvious importance. In Bürger et al. (2019) it is demonstrated that some PGMs are better at fitting data of specific epidemic outbreaks than others even when the models have the same number of parameters. This situation motivates the need to measure differences in the dynamics that two different models are capable of generating. The present work contributes to a systematic study of differences between PGMs and how these may explain the ability of certain models to provide a better fit to data than others. To this end a so-called empirical directed distance (EDD) is defined to describe the differences in the dynamics between different dynamic models. The EDD of one PGM from another one quantifies how well the former fits data generated by the latter. The concept of EDD is, however, not symmetric in the usual sense of metric spaces. The procedure of calculating EDDs is applied to synthetic data and real data from influenza, Ebola, and COVID-19 outbreaks.

          Related collections

          Most cited references61

          • Record: found
          • Abstract: not found
          • Article: not found

          A Flexible Growth Function for Empirical Use

            Bookmark
            • Record: found
            • Abstract: found
            • Article: found
            Is Open Access

            Real-time forecasts of the COVID-19 epidemic in China from February 5th to February 24th, 2020

            The initial cluster of severe pneumonia cases that triggered the COVID-19 epidemic was identified in Wuhan, China in December 2019. While early cases of the disease were linked to a wet market, human-to-human transmission has driven the rapid spread of the virus throughout China. The Chinese government has implemented containment strategies of city-wide lockdowns, screening at airports and train stations, and isolation of suspected patients; however, the cumulative case count keeps growing every day. The ongoing outbreak presents a challenge for modelers, as limited data are available on the early growth trajectory, and the epidemiological characteristics of the novel coronavirus are yet to be fully elucidated. We use phenomenological models that have been validated during previous outbreaks to generate and assess short-term forecasts of the cumulative number of confirmed reported cases in Hubei province, the epicenter of the epidemic, and for the overall trajectory in China, excluding the province of Hubei. We collect daily reported cumulative confirmed cases for the 2019-nCoV outbreak for each Chinese province from the National Health Commission of China. Here, we provide 5, 10, and 15 day forecasts for five consecutive days, February 5th through February 9th, with quantified uncertainty based on a generalized logistic growth model, the Richards growth model, and a sub-epidemic wave model. Our most recent forecasts reported here, based on data up until February 9, 2020, largely agree across the three models presented and suggest an average range of 7409–7496 additional confirmed cases in Hubei and 1128–1929 additional cases in other provinces within the next five days. Models also predict an average total cumulative case count between 37,415 and 38,028 in Hubei and 11,588–13,499 in other provinces by February 24, 2020. Mean estimates and uncertainty bounds for both Hubei and other provinces have remained relatively stable in the last three reporting dates (February 7th – 9th). We also observe that each of the models predicts that the epidemic has reached saturation in both Hubei and other provinces. Our findings suggest that the containment strategies implemented in China are successfully reducing transmission and that the epidemic growth has slowed in recent days.
              Bookmark
              • Record: found
              • Abstract: not found
              • Article: not found

              On the Nature of the Function Expressive of the Law of Human Mortality, and on a New Mode of Determining the Value of Life Contingencies

                Bookmark

                Author and article information

                Journal
                Math Biosci
                Math Biosci
                Mathematical Biosciences
                Elsevier Inc.
                0025-5564
                1879-3134
                8 February 2021
                April 2021
                8 February 2021
                : 334
                : 108558
                Affiliations
                [a ]CI 2MA and Departamento de Ingeniería Matemática, Facultad de Ciencias Físicas y Matemáticas, Universidad de Concepción, Casilla 160-C, Concepción, Chile
                [b ]School of Public Health, Georgia State University, Atlanta, GA, USA
                [c ]Simon A. Levin Mathematical and Computational Modeling Sciences Center, School of Human Evolution and Social Change, Arizona State University, Tempe, AZ 85287, USA
                [d ]Division of International Epidemiology and Population Studies, Fogarty International Center, National Institutes of Health, Bethesda, MD 20892, USA
                Author notes
                [* ]Corresponding author.
                Article
                S0025-5564(21)00016-X 108558
                10.1016/j.mbs.2021.108558
                8054577
                33571534
                623e3c6d-b80c-45d2-9fe9-d36f17c82366
                © 2021 Elsevier Inc. All rights reserved.

                Since January 2020 Elsevier has created a COVID-19 resource centre with free information in English and Mandarin on the novel coronavirus COVID-19. The COVID-19 resource centre is hosted on Elsevier Connect, the company's public news and information website. Elsevier hereby grants permission to make all its COVID-19-related research that is available on the COVID-19 resource centre - including this research content - immediately available in PubMed Central and other publicly funded repositories, such as the WHO COVID database with rights for unrestricted research re-use and analyses in any form or by any means with acknowledgement of the original source. These permissions are granted for free by Elsevier for as long as the COVID-19 resource centre remains active.

                History
                : 27 November 2020
                : 26 January 2021
                : 31 January 2021
                Categories
                Original Research Article

                Quantitative & Systems biology
                phenomenological growth model,logistic model,richards model,gompertz model,distance,simulated annealing

                Comments

                Comment on this article