- Record: found
- Abstract: found
- Article: found
Vaccination Coverage with Selected Vaccines and Exemption Rates Among Children in Kindergarten — United States, 2018–19 School Year
research-article

Ranee Seither , MPH
1
,
,
Caitlin Loretan , MPH
1
,
2 ,
Kendra Driver , MSc
1
,
3 ,
Jenelle L. Mellerson , MPH
1
,
4 ,
Cynthia L. Knighton
1 ,
Carla L. Black , PhD
1
18 October 2019
Read this article at
There is no author summary for this article yet. Authors can add summaries to their articles on ScienceOpen to make them more accessible to a non-specialist audience.
Abstract
State and local school vaccination requirements exist to ensure that students are
protected against vaccine-preventable diseases (
1
). This report summarizes data collected by state and local immunization programs*
on vaccination coverage among children in kindergarten in 49 states, exemptions for
kindergartners in 50 states, and provisional enrollment and grace period status for
kindergartners in 30 states. Nationally, vaccination coverage
†
was 94.9% for the state-required number of doses of diphtheria and tetanus toxoids,
and acellular pertussis vaccine (DTaP); 94.7% for 2 doses of measles, mumps, and rubella
vaccine (MMR); and 94.8% for the state-required doses of varicella vaccine. Whereas
2.5% of kindergartners had an exemption from at least one vaccine,
§
2.8% of kindergartners were not up to date for MMR and did not have a vaccine exemption.
Nearly all states could achieve the recommended ≥95% MMR coverage if all nonexempt
kindergartners were vaccinated in accordance with local and state vaccination policies.
In accordance with state and local school entry requirements, parents and guardians
submit children’s vaccination records or exemption forms to schools, or schools obtain
records from state immunization information systems. Federally funded immunization
programs collaborate with departments of education, school nurses, and other school
personnel to assess vaccination coverage and exemption status of children enrolled
in public and private kindergartens and to report unweighted counts, aggregated by
school type, to CDC via a web-based questionnaire in the Secure Access Management
System.
¶
CDC uses these counts to produce state-level and national-level estimates of vaccination
coverage. During the 2018–19 school year, 49 states reported coverage for all state-required
vaccines among public school kindergartners; 48 states reported on private school
kindergartners.** All 50 states reported exemption data among public school kindergartners;
49 states reported on private school kindergartners. Overall national and median vaccination
coverage for the state-required number of doses of DTaP, MMR, and varicella vaccine
are reported. Coverage with hepatitis B and poliovirus vaccines, which are required
in most states but not included in this report, are available at SchoolVaxView (
2
). Thirty states reported data on kindergartners who, at the time of assessment, attended
school under a grace period (attendance without proof of complete vaccination or exemption
during a set interval) or provisional enrollment (school attendance while completing
a catch-up vaccination schedule). Coverage and exemptions from the U.S. territories
and affiliated jurisdictions are included in this report; however, national estimates,
medians, and summary measures include only U.S. states.
Vaccination coverage and exemption estimates were adjusted according to survey type
and response rates.
††
For the 2018–19 school year, CDC is reporting national-level estimates alongside the
state-level median estimates. The national estimates complement the medians by addressing
the limitation that the median estimates weight every state equally regardless of
population size. Reported estimates for the 2018–19 school year are based on 3,634,896
kindergartners surveyed for vaccination coverage, 3,643,598 for exemptions, and 2,813,482
for grace period and provisional enrollment among the 4,001,404 children reported
as enrolled in kindergarten by the 50 state immunization programs.
§§
Potentially achievable coverage with MMR, defined as the sum of the percentage of
children up to date with 2 doses of MMR and those with no documented vaccination exemption
but not up date, was calculated for each state. Nonexempt students include those provisionally
enrolled, in a grace period, or otherwise without documentation of vaccination. SAS
(version 9.4; SAS Institute) was used for all analyses.
Vaccination assessments varied by immunization program because of differences in states’
required vaccines and doses, vaccines assessed, methods, and data reported (Supplementary
Table 1, https://stacks.cdc.gov/view/cdc/81811). Most states reported kindergartners
as up to date for a given vaccine if they had received all doses of that vaccine required
for school entry,
¶¶
except seven states*** that reported kindergartners as up to date for any given vaccine
only if they had received all doses of all vaccines required for school entry.
Nationally, 2-dose MMR coverage was 94.7% (range = 87.4% [Colorado] to ≥99.2% [Mississippi]).
Coverage of ≥95% was reported by 20 states and coverage of <90% by two (Table). DTaP
coverage was 94.9% (range = 88.8% [Idaho] to ≥99.2% [Mississippi]). Coverage of ≥95%
was reported by 21 states, and coverage of <90% by one. Varicella vaccine coverage
was 94.8% (range=86.5% [Colorado] to ≥99.2% [Mississippi]), with 20 states reporting
coverage ≥95%, and four reporting <90% coverage.
TABLE
Estimated* vaccination coverage
†
for measles, mumps, and rubella vaccine (MMR), diphtheria and tetanus toxoids and
acellular pertussis vaccine (DTaP), and varicella vaccine, grace period or provisional
enrollment,
§
and any exemption
¶
among children enrolled in kindergarten, by immunization program — United States,
territories, and associated states, 2018–19 school year
Immunization program
Kindergarten population**
No. (%) surveyed††
MMR,
2 doses (%)§§
DTaP,
5 doses (%)¶¶
Varicella, 2 doses (%)***
Grace period or provisional enrollment (%)
Any exemption (%)
Percentage point change in any exemption from 2017 to 2018
National estimate†††
4,001,404
3,634,896
94.7
94.9
94.8
2.0
2.5
0.2
Median†††
Not applicable
Not applicable
94.2
94.6
94.3
1.8
2.6
0.4
State
Alabama§§§,¶¶¶
77,739
77,739 (100.0)
≥90.6
≥90.6
≥90.6
NP
0.8
−0.1
Alaska¶¶¶,****
10,316
8,702 (84.4)
NR
NR
NR
NR
7.1
0.1
Arizona§§§,††††
79,981
79,981 (100.0)
92.9
92.7
95.6
NR
6.0
0.2
Arkansas§§§§
39,257
37,466 (95.4)
94.2
93.4
93.8
4.5
1.8
0.1
California¶¶¶,††††,§§§§
568,947
555,735 (97.7)
96.5
96.0
97.9
1.7
0.6
−0.1
Colorado§§§,¶¶¶¶
64,191
64,191 (100.0)
87.4
90.3
86.5
0.6
4.9
0.2
Connecticut§§§,¶¶¶
38,230
38,230 (100.0)
95.9
96.1
95.7
NP
2.7
0.4
Delaware¶¶¶
10,798
1,021 (9.5)
97.8
97.8
97.6
NR
1.2
−0.2
District of Columbia****
NA
NA
NR
NR
NR
NR
NR
NA
Florida§§§,¶¶¶,*****
224,641
224,641 (100.0)
≥93.8
≥93.8
≥93.8
2.9
3.2
0.3
Georgia§§§,¶¶¶
131,275
131,275 (100.0)
≥93.6
≥93.6
≥93.6
0.2
2.5
−0.2
Hawaii¶¶¶
16,051
1,081 (6.6)
91.5
92.4
94.0
1.3
4.4
1.3
Idaho
22,995
22,769 (99.0)
89.5
88.8
88.3
2.2
7.7
0.6
Illinois§§§,¶¶¶¶
143,876
143,876 (100.0)
94.7
94.7
94.4
1.1
1.8
0.2
Indiana¶¶¶
82,324
79,350 (96.4)
91.2
94.4
93.5
NR
1.3
0.4
Iowa§§§,¶¶¶
40,624
40,624 (100.0)
≥93.3
≥93.3
≥93.3
3.0
2.4
0.4
Kansas¶¶¶,§§§§,†††††
37,838
8,744 (23.1)
90.8
91.0
89.2
NR
2.1
0.4
Kentucky¶¶¶,§§§§,*****
55,587
55,024 (99.0)
93.4
94.1
92.8
NR
1.4
0.0
Louisiana§§§
56,203
56,203 (100.0)
95.5
97.7
95.4
NA
1.2
0.1
Maine
13,419
12,875 (95.9)
93.8
94.5
95.9
NR
6.2
0.9
Maryland¶¶¶,§§§§
71,431
71,423 (100.0)
97.4
97.7
97.1
NR
1.5
0.1
Massachusetts§§§,¶¶¶,§§§§
65,279
65,279 (100.0)
96.9
97.1
96.5
NP
1.4
0.1
Michigan§§§
118,632
118,632 (100.0)
94.6
94.8
94.3
0.6
4.5
0.3
Minnesota¶¶¶¶,*****
70,085
68,779 (98.1)
92.6
92.5
92.0
NR
3.7
0.2
Mississippi§§§,¶¶¶,††††
37,775
37,775 (100.0)
≥99.2
≥99.2
≥99.2
0.6
0.1
0.0
Missouri§§§,¶¶¶¶
72,687
72,687 (100.0)
94.8
94.8
94.5
NR
2.7
0.4
Montana§§§,¶¶¶
12,480
12,480 (100.0)
93.3
93.0
92.9
1.9
4.5
0.2
Nebraska¶¶¶,§§§§,
26,925
26,548 (98.6)
96.9
97.4
96.3
1.3
2.1
−0.1
Nevada¶¶¶
37,971
1,811 (4.8)
95.1
95.0
94.7
1.0
3.3
0.1
New Hampshire¶¶¶
12,421
12,421 (100.0)
≥91.8
≥91.8
≥91.8
4.9
3.3
0.4
New Jersey§§§,¶¶¶
109,161
109,161 (100.0)
≥95.0
≥95.0
≥95.0
1.1
2.5
0.3
New Mexico¶¶¶
25,269
25,170 (99.6)
96.1
96.0
95.7
1.9
1.5
−0.2
New York (including New York City)§§§,¶¶¶
220,495
220,495 (100.0)
97.2
96.7
96.7
1.9
1.3
0.2
New York City§§§,¶¶¶
96,912
96,912 (100.0)
97.7
97.0
97.1
1.2
0.7
0.0
North Carolina¶¶¶,§§§§,*****
124,343
113,074 (90.9)
93.2
93.2
93.1
1.6
1.6
−0.4
North Dakota
10,382
10,315 (99.4)
93.6
93.6
93.8
NR
4.3
0.9
Ohio
139,679
132,589 (94.9)
91.6
91.9
91.2
6.7
2.9
0.3
Oklahoma*****
54,806
50,456 (92.1)
92.2
92.7
95.8
NR
2.6
0.4
Oregon§§§, §§§§
45,870
45,870 (100.0)
93.0
92.4
94.3
NR
7.7
0.1
Pennsylvania
143,560
133,945 (93.3)
96.4
96.6
95.8
2.6
2.9
0.1
Rhode Island§§§,¶¶¶,§§§§,*****
10,964
10,964 (100.0)
97.4
97.4
97.0
NR
1.3
0.2
South Carolina¶¶¶
58,442
15,797 (27.0)
94.2
94.6
93.5
0.9
2.6
0.6
South Dakota¶¶¶
12,062
12,052 (99.9)
96.2
95.8
95.5
NR
2.6
0.4
Tennessee§§§,¶¶¶,§§§§
78,630
78,630 (100.0)
96.5
96.2
96.2
1.6
1.9
0.4
Texas (including Houston)§§§§,*****
390,034
387,530 (99.4)
96.9
96.7
96.5
1.5
2.4
0.4
Houston§§§§,*****
37,897
37,675 (99.4)
96.6
96.6
95.9
1.4
1.5
0.3
Utah§§§
50,179
50,179 (100.0)
92.8
92.4
92.5
2.3
5.7
0.4
Vermont§§§,¶¶¶
6,126
6,126 (100.0)
93.0
92.9
92.3
5.1
4.7
0.9
Virginia¶¶¶,†††††
100,394
4,422 (4.4)
95.0
98.0
93.6
NR
1.7
0.2
Washington*****
87,510
84,771 (96.9)
90.8
90.8
89.7
1.7
5.0
0.3
West Virginia¶¶¶,††††,§§§§§
19,442
15,426 (79.3)
98.8
98.7
98.5
2.3
0.8
0.6
Wisconsin§§§§,*****,†††††
66,344
1,530 (2.3)
92.6
96.2
91.6
4.9
5.9
0.5
Wyoming
7,734
7,734 (100.0)
95.1
95.3
94.7
2.5
2.9
NA
Territories and associated states
American Samoa¶¶¶
NA
NA
NA
NA
NReq
NP
NA
NA
Federated States of Micronesia§§§
1,786
1,786 (100.0)
91.3
80.2
NReq
NR
0.0
0.0
Guam¶¶¶
2,563
735 (28.7)
88.4
90.7
NReq
NR
0.1
-0.3
Marshall Islands§§§,¶¶¶,††††
1,114
1,114 (100.0)
95.1
83.8
NReq
NR
0.0
0.0
Northern Mariana Islands§§§
812
812 (100.0)
97.7
79.4
98.2
NR
0.0
0.0
Palau§§§,¶¶¶¶¶
304
304 (100.0)
100.0
100.0
NReq
NR
0.0
0.0
Puerto Rico
26,353
1,545 (5.9)
94.7
91.4
94.7
NR
1.6
NA
U.S. Virgin Islands
NA
NA
NA
NA
NA
NA
NA
NA
Abbreviations: NA = not available; NP = no grace period/provisional policy; NR = not
reported to CDC; NReq = not required.
* Estimates are adjusted for nonresponse and weighted for sampling where indicated.
† Estimates based on a completed vaccine series (i.e., not vaccine-specific) use the
“≥” symbol. Coverage might include history of disease or laboratory evidence of immunity.
§ A grace period is a set number of days during which a student can be enrolled and
attend school without proof of complete vaccination or exemption. Provisional enrollment
allows a student without complete vaccination or exemption to attend school while
completing a catch-up vaccination schedule. In states with one or both of these policies,
the estimates represent the number of kindergartners within a grace period, provisionally
enrolled, or some combination of these categories.
¶ Exemptions, grace period, provisional enrollment, and vaccine coverage status might
not be mutually exclusive. Some children enrolled under a grace period or provisional
enrollment might be exempt from one or more vaccinations, while children with exemptions
might be fully vaccinated with one or more required vaccines.
** The kindergarten population is an approximation provided by each program. The national
total excludes the 8,075 kindergartners from the District of Columbia for which data
were not reported.
†† The number surveyed represents the number of kindergartners surveyed for vaccination
coverage. For Alaska, this number represents the number surveyed for exemptions because
coverage was not reported. The national total excludes the 8,702 kindergartners from
Alaska. Exemption estimates are based on 31,792 kindergartners for Kansas, 95,875
kindergartners for Virginia, and 66,652 kindergartners for Wisconsin.
§§ Most states require 2 doses of MMR; Alaska, New Jersey, and Oregon require 2 doses
of measles, 1 dose of mumps, and 1 dose of rubella vaccines. Georgia, New York, New
York City, North Carolina, and Virginia require 2 doses of measles and mumps, 1 dose
of rubella vaccines. Iowa requires 2 doses of measles and 2 doses of rubella vaccines.
¶¶ Pertussis vaccination coverage might include some diphtheria, tetanus toxoids,
and pertussis vaccine (DTP) vaccinations if administered in another country or by
a vaccination provider who continued to use DTP after 2000. Most states require 5
doses of DTaP for school entry, or 4 doses if the 4th dose was received on or after
the 4th birthday; Illinois, Maryland, Virginia, and Wisconsin require 4 doses; Nebraska
requires 3 doses. The reported coverage estimates represent the percentage of kindergartners
with the state-required number of DTaP doses, except for Kentucky, which requires
≥5 doses but reports ≥4 doses of DTaP.
*** Most states require 2 doses of varicella vaccine for school entry; Alabama, Arizona,
California, Hawaii, Maine, New Jersey, Oklahoma, and Oregon require 1 dose. Reporting
of varicella vaccination status for kindergartners with a history of varicella disease
varied within and among states; some were reported as vaccinated against varicella
and others as medically exempt.
††† National coverage estimates and medians calculated from data from 49 states (i.e.,
does not include Alaska). National grace period or provisional enrollment estimate
and median were calculated from data from 30 states that have either a grace period
or provisional enrollment policy and reported relevant data to CDC. National exemption
estimate and median were calculated from data from 50 states. Other jurisdictions
excluded were Houston, Texas, New York City, American Samoa, Guam, Marshall Islands,
Federated States of Micronesia, Northern Mariana Islands, Palau, Puerto Rico, and
U.S. Virgin Islands. Data reported from 3,634,896 kindergartners assessed for coverage,
3,643,598 for exemptions and 2,813,482 for grace period/provisional enrollment. Estimates
represent rates for populations of 3,991,088; 4,001,404; and 3,025,009 kindergartners
for coverage, exemptions and grace period/provisional enrollment, respectively.
§§§ The proportion surveyed likely was <100% but is reported as 100% based on incomplete
information about the actual current enrollment.
¶¶¶ Philosophical exemptions were not allowed.
**** Kindergarten vaccination coverage (Alaska and District of Columbia) and exemption
data (District of Columbia) were not reported because of problems with data collection.
†††† Religious exemptions were not allowed.
§§§§ Counted some or all vaccine doses received regardless of Advisory Committee on
Immunization Practices recommended age and time interval; vaccination coverage rates
reported might be higher than those for valid doses.
¶¶¶¶ Program did not report the number of children with exemptions, but instead reported
the number of exemptions for each vaccine, which could count some children more than
once. Lower bounds of the percentage of children with any exemptions were estimated
using the individual vaccines with the highest number of exemptions.
***** Did not include some types of schools, such as online schools or those located
on military bases, in correctional facilities, or on tribal lands.
††††† Kindergarten vaccination coverage data were collected from a sample, and exemption
data were collected from a census of kindergartners.
§§§§§ Reported public school data only.
¶¶¶¶¶ For Palau, estimates represent coverage among children in first grade.
The percentage of kindergartners with an exemption from one or more required vaccines
(not limited to MMR, DTaP, and varicella vaccines) was 2.5% in 2018–19 (range = 0.1%
[Mississippi] to 7.7% [Idaho and Oregon]). This is slightly higher than the 2.3% during
the 2017–18 school year and 2.1% in 2016–17. (Table) (Figure 1). Nationally, 0.3%
of kindergartners had a medical exemption, and 2.2% had a nonmedical exemption (Supplementary
Table 2, https://stacks.cdc.gov/view/cdc/81810).
FIGURE 1
Estimated national percentage exempt and range of states’ exemptions from one or more
vaccines among kindergartners — United States, 2013–14 to 2018–19 school years
The figure is a line chart showing estimated national percentage exempt and range
of states’ exemptions from one or more vaccines among kindergartners in the United
States during the 2013–14 to 2018–19 school years.
The percentage of kindergartners attending school within a grace period or provisionally
enrolled among the 30 states reporting these data was 2.0% (range = 0.2% [Georgia]
to 6.7% [Ohio]) (Table). In 10 of these states, the percentage of children provisionally
enrolled or within a grace period at the time of assessment exceeded the percentage
of children with exemptions from one or more vaccines. Forty-four states could potentially
achieve ≥95% MMR coverage if all nonexempt kindergartners, many of whom are within
a grace period or provisionally enrolled, were vaccinated (Figure 2). Follow-up could
assure all missing vaccinations are completed and all missing documentation of vaccination
is provided to schools.
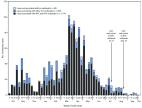
FIGURE 2
Potentially achievable coverage*
,†,§ with measles, mumps, and rubella vaccine (MMR) among kindergartners — 49 states,
2018–2019 school year
* Potentially achievable coverage is estimated as the sum of the percentage of students
with up-to-date MMR and the percentage of students without up-to-date MMR and without
a vaccine exemption.
† The exemptions used to calculate the potential increase in MMR coverage for Arizona,
Arkansas, Colorado, Idaho, Illinois, Maine, Massachusetts, Michigan, Minnesota, Missouri,
Nebraska, New York, North Carolina, North Dakota, Ohio, Oklahoma, Oregon, Rhode Island,
Texas, Utah, Vermont, and Wyoming are the number of children with exemptions specifically
for MMR vaccine. For all other states, numbers are based on an exemption to any vaccine.
§ Alaska and the District of Columbia did not report kindergarten vaccination coverage
for the 2018–19 school year and are excluded from this analysis.
The figure is a stacked bar chart showing potentially achievable coverage with measles,
mumps, and rubella vaccine among kindergartners in 49 states during the 2018–2019
school year.
Discussion
Measles outbreaks affecting school-age children across multiple states during the
2018–19 school year underscore the importance of both school vaccination requirements
for preventing disease spread and school coverage assessments to identify pockets
of undervaccination (
3
). During the 2018–19 school year, national coverage with MMR, DTaP, and varicella
vaccines remained near 95% (
2
,
4
). However, coverage and exemption rates varied by state. Recent measles outbreaks
in states with high overall MMR coverage, such as New York, highlight the need for
assessing vaccination coverage at the local level. CDC encourages programs to use
their local-level school assessment data to identify populations of undervaccinated
students and to partner with schools and providers to reduce barriers to vaccination
and improve coverage.
Although the overall percentage of children with an exemption increased slightly for
the second consecutive school year, children with exemptions still represent a small
proportion of kindergartners nationally and in most states. More importantly, in 25
states, the number of nonexempt undervaccinated kindergartners exceeded the number
of those with exemptions. In many states, nonexempt undervaccinated students are attending
school in a grace period or are provisionally enrolled. Fifteen states allow grace
periods, with 30 days the most common length, and 47 states allow provisional enrollment
for students in the process of completing the vaccination schedule (R McCord, CDC,
unpublished data, 2019). Follow-up with parents of these students to verify that vaccinations
and related documentation are complete typically falls to school nurses or other school
staff members (R Seither, CDC, unpublished data, 2019). The California Department
of Public Health’s immunization program collaborated with the state Department of
Education and with individual schools to reduce provisional enrollment substantially
over several years, which resulted in measurable increases in vaccination coverage,
through training on the correct application of the relevant rules so that only those
children who were completing a catch-up schedule were provisionally enrolled, and
audits to assess the implementation by school staff members (
5
,
6
). Almost all states could achieve ≥95% MMR coverage if undervaccinated nonexempt
children were vaccinated in accordance with local and state vaccination policies.
The findings in this report are subject to at least five limitations. First, comparability
is limited because of variation in states’ requirements, data collection methods,
and definitions of grace period and provisional enrollment. Second, representativeness
might be negatively affected because of data collection methods that miss some schools
or students, such as homeschooled students, or assess vaccination status at different
times. Third, actual vaccination coverage, exemption rates, or both might be underestimated
or overestimated because of inaccurate or absent documentation or missing schools.
Fourth, national coverage estimates include only 49 of 50 states, exemption estimates
include all states but use lower-bound estimates for four states, and grace period
or provisional enrollment estimates include only 30 states for the 2018–19 school
year. Finally, because most states do not report vaccine-specific exemptions, estimates
of potentially achievable MMR coverage are approximations. However, if reported exemptions
were for a vaccine or vaccines other than MMR, potentially achievable MMR coverage
would be higher than that presented.
Kindergarten vaccination requirements help ensure that students are fully vaccinated
with recommended vaccines upon school entry. CDC works with immunization programs
to collect and report data on school vaccination coverage, exemption rates, and grace
period and provisional enrollment each year. Immunization programs can use these data
to identify schools and communities with high concentrations of undervaccinated students
and inform strategies to increase vaccination coverage. Such strategies include education
campaigns to counteract misinformation in areas with high numbers of vaccine exemptions
and increased follow-up of undervaccinated students without exemptions to ensure these
children are vaccinated in accordance with local and state vaccination policies (
7
) to reduce the risk for transmission of vaccine-preventable diseases.
Summary
What is already known about this topic?
State immunization programs conduct annual kindergarten vaccination assessments to
monitor school-entry vaccination coverage with all state-required vaccines.
What is added by this report?
For the 2018–19 school year, coverage was 94.7% for 2 doses of measles, mumps, and
rubella vaccine (MMR) and 94.9% for the state-required number of doses of diphtheria
and tetanus toxoids and acellular pertussis vaccine, and 94.8% for varicella vaccine.
Although the exemption rate slightly increased to 2.5%, most states could achieve
the recommended ≥95% MMR coverage if undervaccinated children without an exemption
were completely vaccinated.
What are the implications for public health practice?
State and local immunization programs can use school coverage assessments to detect
pockets of undervaccination and guide strategies to increase vaccination coverage.
Related collections
Most cited references3
- Record: found
- Abstract: found
- Article: found
National Update on Measles Cases and Outbreaks — United States, January 1–October 1, 2019
Manisha M. Patel, Adria D. Lee, Nakia Clemmons … (2019)
- Record: found
- Abstract: found
- Article: not found
Associations of Statewide Legislative and Administrative Interventions With Vaccination Status Among Kindergartners in California
S. Pingali, Paul Delamater, Alison Buttenheim … (2019)
- Record: found
- Abstract: found
- Article: not found
Clinical Inquiries: Which interventions are effective in managing parental vaccine refusal?
Dan Brelsford, Elise Knutzen, Jon Neher … (2017)