- Record: found
- Abstract: found
- Article: not found
Runx3 programs CD8 + T cell residency in non-lymphoid tissues and tumors
research-article
J. Justin Milner
1 ,
Clara Toma
1 ,
Bingfei Yu
1 ,
Kai Zhang
2 ,
Kyla Omilusik
1 ,
Anthony T. Phan
1 ,
Dapeng Wang
3 ,
Adam J. Getzler
3 ,
Toan Nguyen
1 ,
Shane Crotty
4
,
5 ,
Wei Wang
2
,
6
,
7 ,
Matthew E. Pipkin
3 ,
Ananda W. Goldrath
1
06 December 2017
Read this article at

There is no author summary for this article yet. Authors can add summaries to their articles on ScienceOpen to make them more accessible to a non-specialist audience.
Abstract
Tissue-resident memory CD8+ T cells (Trm) are positioned at common sites of pathogen
exposure where they elicit rapid and robust protective immune responses
1,2
. However, the molecular signals controlling Trm differentiation and homeostasis are
not fully understood. Here we show that mouse Trm precursor cells represent a unique
CD8+ T cell subset that is distinct from the precursors of circulating memory populations
at the levels of gene expression and chromatin accessibility. Exploiting computational
and functional RNAi in vivo screens, we identified the transcription factor (TF) Runx3
as a key regulator of Trm differentiation and homeostasis. Runx3 was required to establish
Trm populations in diverse tissue environments and supported expression of critical
tissue-residency genes while suppressing genes associated with tissue egress and recirculation.
Analysis of the accessibility of Runx3 target genes in Trm-precursor cells revealed
a distinct regulatory role for Runx3 in controlling Trm differentiation despite relatively
widespread and uniform expression among all CD8+ T cell subsets. Further, we show
that human and murine tumor-infiltrating lymphocytes (TIL) share a core tissue-residency
gene-expression signature with Trm. In a mouse model of adoptive T cell therapy for
melanoma, Runx3-deficient CD8+ TIL failed to accumulate in tumors, resulting in greater
rates of tumor growth and mortality. Conversely, overexpression of Runx3 enhanced
TIL abundance, delayed tumor growth, and prolonged survival. In addition to establishing
Runx3 as a central regulator of Trm differentiation, these results provide novel insight
into the signals that promote T cell residency in tissues, which could be leveraged
to enhance vaccine efficacy or adoptive cell therapy treatments that target cancer.
Long-lived memory T cells provide protection from reinfection and can serve as endogenous
defenders against tumor growth
3
. Memory CD8+ T cell populations can be broadly segregated into circulating central
and effector memory cells (Tcm and Tem) and tissue-resident memory cells (Trm) that
primarily reside in non-lymphoid tissues without egress
4
. Circulating memory CD8+ T cells and Trm exhibit distinct gene-expression profiles
5–7
; however, the early transcriptional identity of differentiating Trm and the signals
controlling their fate are not yet fully appreciated. Here, we utilized an established
infection model where TCR transgenic CD8+ T cells responsive to lymphocytic choriomeningitis
virus (LCMV) GP33–41 presented by MHC-class 2Db (P14) were transferred into recipient
mice followed by infection with LCMV. In this acute infection model, P14 cells located
in non-lymphoid tissues on day 7 of infection began to upregulate molecules characteristic
of Trm8, including key tissue-retention molecules CD103 and CD69 (Extended Data Fig.
1a). Gene-expression analysis revealed that 90–96% of the genes upregulated in mature
P14 Trm in the kidney parenchyma or intraepithelial lymphocyte (IEL) compartment of
the small intestine were elevated in Trm-precursor cells relative to splenic effector
cells on day 7 of infection (Fig. 1a). Furthermore, analysis of genes differentially
expressed between splenic and non-lymphoid populations on day 7 of infection revealed
two distinct gene-expression programs that segregated circulating (PBL, spleen, Tcm,
and Tem) from non-lymphoid (kidney and IEL) P14 cells, independent of infection timepoint
(Fig. 1b). Lymph node (LN) or splenic KLRG1loCD127hi memory-precursor (MP) cells preferentially
give rise to circulating memory populations whereas shorter-lived KLRG1hiCD127lo terminal
effector (TE) cells exhibit less memory potential
3
. Day 7 IEL P14 cells comprising the precursors of Trm, were transcriptionally distinct
from splenic MP cells (Fig. 1c). This is notable as IEL Trm are predominantly KLRG1lo,9
and preferentially differentiate from lymphoid-derived KLRG1lo precursors seeding
non-lymphoid tissues from days 4.5–7 of infection
10
(Extended Data Fig. 1a–c), consistent with studies of skin Trm6. Thus, the Trm-precursor
populations in non-lymphoid tissues are transcriptionally distinct from circulating
effector cells as well as MP cells on day 7 of infection, and the majority of the
Trm transcriptional program is already established at this time point, prior to contraction
of the CD8+ T cell population.
As chromatin accessibility is a key determinant of cell identity and fate, we profiled
non-lymphoid and splenic effector populations using ATAC-seq on day 7 of infection.
Uniquely accessible chromatin regions were identified in IEL P14 cells for genes characteristic
of mature Trm (e.g. Cd69 and Nr4a1) whereas genes that promote T cell re-circulation
(e.g. Klf2 and S1pr1) exhibited loss of accessible regions (Extended Data Fig. 2a).
Principal component analysis (PCA) highlighted that, despite day 7 being an “effector”
time point, the global chromatin landscape dramatically differs between effector CD8+
T cells located in the spleen, including MP cells, and those located in non-lymphoid
tissues (Fig. 1d). The unique chromatin configuration of differentiating Trm is consistent
with the striking transcriptional differences observed (Fig. 1a–c) and foreshadows
the distinct fates of antigen-specific cells in the spleen relative to non-lymphoid
tissues. Thus, precursors of Trm cells in non-lymphoid sites are a unique and distinct
CD8+ T cell subset relative to effector cells in the lymphoid compartment, including
the MP population.
Specification of CD8+ T cell fate during infection is dependent on the integrated
activity of multiple TFs
3
, and notable regulators of Trm formation include Hobit
6
, Blimp1
6
, Nr4a1
11
, Eomes
12
, and T-bet
12,13
. To facilitate a broader understanding of the transcriptional network driving Trm
differentiation, we utilized a combined screening approach, consisting of a computational
strategy integrating ATAC-seq data, transcriptional profiling and personalized PageRank
analysis to predict regulatory TFs, and a functional in vivo RNAi screen targeting
putative Trm regulators identified through the computational approach (Fig. 1e). We
recently demonstrated that analysis of accessible TF binding motifs and TF-target
gene expression yielded insight into TFs with regulatory functions in the differentiation
of circulating memory CD8+ T cells
14
. Leveraging this approach and the personalized PageRank analysis
15
, we predicted a number of TFs with established regulatory roles in controlling Trm
differentiation (Blimp1
6
, Nr4a1
11
, Eomes
12
, T-bet
12,13
) and many with no previously described role in Trm (Fig. 1f, SI Table 1). We evaluated
both barrier (IEL) and non-barrier (kidney) Trm sites to reveal TFs important to Trm
differentiation independent of the tissue. Additionally, a key strength of this computational
screen is that influential roles of differentially expressed TFs as well as TFs with
homogenous expression can be anticipated (Extended Data Fig. 2b). To establish functional
relevance for predicted regulators of Trm formation identified through PageRank analysis,
we utilized an RNAi screening strategy
16
to test hundreds of individual shRNAmir constructs in parallel for activity in promoting
or repressing Trm differentiation in vivo (Fig. 1g, SI Table 2). Several TFs with
established roles in regulating Trm were identified (Nr4a1
13
, Blimp1
6
, Klf2
17
and T-bet
12,13
) as well as TFs with previously unknown functions in controlling CD8+ Trm formation
such as Nr4a3 and Runx3 (Fig. 1i).
Runx3 is a well-established regulator of CD8+ T cell thymocyte development
18
, supports cytotoxic activity of mature CD8+ T cells
19,20
, and controls CD4+ T cell localization within the intestinal epithelium
21
. Although little is known regarding a role for Runx3 in CD8+ Trm, both computational
and functional screens identified Runx3 as a putative regulator of Trm fate specification
(Fig. 1f,g) despite relatively uniform Runx3 expression in circulating and resident
CD8+ T cell subsets (Extended Data Fig. 2b, 3a). We validated a role for Runx3 through
a 1:1 mixed transfer of P14 cells transduced with control (Cd19 shRNAmir) or Runx3
shRNAmir-encoding retroviruses into mice that were subsequently infected with LCMV
(Fig. 2a). Runx3 shRNAmir suppressed Runx3 expression (Extended Data Fig. 3b) and
impaired the formation of IEL Trm relative to circulating cells (Fig. 2a and Extended
Data Fig. 3c,d), consistent with the RNAi screen. Further, Runx3-shRNAmir knockdown
in the context of a localized enteric Listeria monocytogenes expressing GP33–41 (LM-GP33–41)
infection similarly impaired Trm differentiation (Fig. 2b).
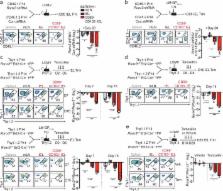
Next, utilizing a tamoxifen-inducible deletion approach, Runx3
fl/fl-Ert2-Cre+ P14 (Runx3fl/f
l) or Runx3
+/+-Ert2-Cre+ P14 (Runx3+/+
) cells were mixed 1:1 and transferred into host mice followed by LCMV or enteric
LM-GP33–41 infection (Fig. 2c). Runx3-deficiency resulted in a 2–6-fold loss of splenocytes
and minimal loss of mLN cells by day 15/16 of infection. However, Runx3-deficiency
resulted in a 50–150-fold loss of CD69+CD103+ Trm in both infection settings (Fig.
2c and Extended Data Fig. 3e). Moreover, delaying tamoxifen treatment to days 6–8
or 16–20 of infection further emphasized a distinct dependence of Trm differentiation
on Runx3 (Fig. 2d) as well as a critical role for Runx3 in maintaining Trm homeostasis,
respectively (Fig. 2e, Extended Data Fig. 3f). Furthermore, Runx3 was necessary for
optimal Trm differentiation of H-2Db GP33–41 tetramer+ cells (Extended Data Fig. 4a–d).
Taken together, these data demonstrate that Runx3 is critical for Trm differentiation
and maintenance.
Runx3 deletion also resulted in a loss of Trm in non-barrier tissues (salivary gland
and kidney, Extended Data Fig. 5a–b), and optimal Trm differentiation in the skin
and lung parenchyma required Runx3 (Extended Data Fig. 5c–h). Thus, the loss of Trm
in a range of non-lymphoid tissues indicated Runx3 drives Trm formation independently
of the tissue site. Further, Runx3 was required for maximal granzyme B expression
in Trm, although cytokine production was not affected (Extended Data Fig. 6a,b). Runx3-deficiency
resulted in a greater frequency of Annexin V+ cells (Extended Data Fig. 6c,d), most
prominently in CD69+CD103+ Trm; thus, the marked loss of Trm was at least in part
due to a greater rate of apoptosis, as proliferation and trafficking were not impacted
(Extended Data Fig. 6e,f).
We next assessed if ectopic expression of Runx3 could augment Trm differentiation.
Overexpression of Runx3 accelerated IEL P14 CD69+CD103+ Trm differentiation on day
8 of infection, but did not impact migration to the small intestine (Fig. 3a). Evidence
of enhanced Trm differentiation was further confirmed by the greater abundance of
IEL Trm on day 12/13 of infection and enhanced CD103 expression, consistent with a
reported role for Runx3 in regulating CD103 expression
21,22
(Fig. 3b). Additionally, ectopic expression of Runx3 also boosted Trm differentiation
in the lung parenchyma (Extended Data Fig. 7a–d).
Given that manipulation of Runx3 impacted Trm formation in diverse tissue microenvironments,
we constructed a core Trm transcriptional signature by computational integration of
CD8+ Trm gene-expression datasets from the IEL, kidney, lung
5
, skin
5
and brain
7
, to evaluate the hypothesis that Runx3 is a universal regulator of Trm specification
(Fig. 3c, SI Table 3). Notably, we found the majority of the core tissue-residency
signature genes were upregulated in Runx3-overexpressing cells and downregulated in
Runx3-deficient cells. Conversely, the core signature of circulating memory cells
was enriched in Runx3-deficient cells and depleted from Runx3-overexpressing cells
(Fig 3c). Therefore, Runx3 promoted expression of tissue-residency signature genes
and repressed genes characteristic of circulating cells, and this conclusion was further
corroborated by ChIP-seq analysis
23
indicating that Runx3 binding was enriched in both core tissue-residency and circulating
genes relative to background sites (Extended Data Fig. 8a).
Through evaluation of accessible Runx3 binding motifs from ATAC-seq analysis, we generated
a regulatory Runx3 binding network (Extended Data Fig. 8b) and found Runx3 putatively
regulates a distinct network of genes in differentiating IEL-Trm precursor cells relative
to splenic effector cells, including selective enrichment of genes linked to cell
adhesion and regulation of TF activity. In connection, Runx3 has been shown to cooperate
with the TF T-bet in multiple contexts
19,24
, yet T-bet is a potent suppressor of early Trm differentiation
12,13
. ChIP-seq data
23
indicated Runx3 directly binds to multiple sites of the Tbx21 locus (encoding T-bet,
Extended Data Fig. 8c), and Runx3-deficient CD8+ T cells exhibited elevated T-bet
levels (Extended Data Fig. 8d). Knockdown of Tbx21 in Runx3-deficient cells enhanced
Trm numbers in the IEL compartment and restored CD103 and CD69 expression (Extended
Data Fig. 8e,f), but did not fully rescue Trm differentiation. These findings are
consistent with Runx3 regulating multiple targets that influence Trm formation (Fig.
3c) including suppression of canonical tissue egress genes (Extended Data Fig. 8g,h).
It has been noted that CD8+ tumor infiltrating lymphocytes (TIL) can exhibit characteristics
of Trm, and a positive prognosis has been correlated with TIL that present qualities
of Trm
25,26
. As Runx3 regulates core features of tissue-residency (Fig. 3c), we assessed the
transcriptional similarities of Trm and TIL and evaluated a role for Runx3 in controlling
TIL accumulation. TIL isolated from mouse melanoma
27
or mammary tumors
27
shared ~70% of the core tissue-residency gene-expression program relative to splenic
CD8+ T cells (Fig. 4a), and this relationship was further highlighted through PCA
(Fig. 4b). Utilizing an adoptive therapy model, Runx3-knockdown or Runx3-overexpressing
P14 cells were mixed with control P14 cells at a 1:1 ratio and transferred into mice
with established melanoma tumors expressing GP33–41 (Extended Data Fig 9a). Runx3-deficiency
impaired TIL accumulation (Fig. 4c,d) without impacting migration to the tumor (Extended
Data Fig. 9b). Conversely, Runx3-overexpression enhanced TIL abundance (Fig. 4c,d),
expression of granzyme B (Extended Data Fig. 9c) and certain core tissue-residency
genes while further suppressing core circulating genes (Fig. 4e). In clinical settings,
TIL density strongly correlates with positive outcomes
28
, and we observed Runx3-deficient P14 cells were impaired in their ability to control
tumor growth, resulting in greater mortality (Fig. 4f). Conversely, Runx3-overexpressing
cells delayed tumor growth and prolonged survival (Fig. 4g). Notably, human CD8+ TIL
also exhibited enrichment of the core tissue-residency signature relative to circulating
CD8+ T cells
25
(Extended Data Fig. 9d), and analysis of single-cell RNA-seq data from mouse
29
and human melanoma TIL
30
indicated that activated CD44+CD8+ T cells expressing Runx3 exhibited enrichment of
the tissue-residency gene-expression signature relative to CD44+CD8+ TIL with low
Runx3 expression levels (Fig. 4h). These data indicate that in both human and murine
TIL, tissue-residency features are likely driven by Runx3. In connection, it was recently
demonstrated that human lung cancer TIL enriched with certain qualities of Trm also
strongly correlated with TIL abundance and a positive prognosis
26
. Taken together, manipulation of TFs promoting tissue-residency may yield more effective
TIL and anti-viral memory T cells through supplementing CD8+ T cells with a gene-expression
program that better supports features important to both Trm and TIL such as in situ
survival, tissue retention, and repression of egress, ultimately fostering accumulation
of protective T cells in tissues.
Methods
Mice
Mice were maintained in specific-pathogen-free conditions in accordance with the Institutional
Animal Care and Use Committees (IACUC) of the University of California, San Diego
(UCSD) and The Scripps Research Institute, Jupiter, FL (TSRI-FL). All mice were of
a C57BL6/J background and bred at UCSD and TSRI-FL or purchased from the Jackson Laboratory,
including: WT or P14 mice with distinct expression of the congenic molecules CD45.1,
CD45.2, Thy1.1, and Thy1.2 as well as control Thy1.1+Thy1.2+
Runx3
+/+Ert2-Cre+YFP P14 mice and Runx3 inducible deletion Thy1.1+
Runx3
fl/flErt2-Cre+YFP P14 mice. Runx3
+/+dLck-Cre+YFP and Runx3
fl/fldLck-Cre+YFP mice were used for studying polyclonal CD8+ T cell responses. The
Rosa26 stop-flox eYFP reporter mice were used for all Runx3-deletion experiments.
Cre-mediated deletion disrupts the Runx3 DNA-binding domain in exon 4, which exists
in transcripts originating from both the distal and proximal promoter. Thus, both
long and short Runx3 forms are inactivated in these alleles.
Naive T cell transfers, infection, and treatments
Naive P14 CD8+ T cells were transferred intravenously (i.v.) into congenically distinct
sex matched recipient mice, or female P14 cells were transferred into male mice. For
all microarray, RNA-seq, or ATAC-seq experiments, a total of 1×10⁵ P14 cells were
transferred. For co-transfer experiments, naive Thy1.1+Thy1.2+
Runx3
+/+ Ert2-Cre YFP+ P14 cells and naive Thy1.1+
Runx3fl
/fl Ert2-Cre YFP+ P14 cells were mixed 1:1 and a total of 3×10⁴ P14 cells were transferred
into Thy1.2+ recipient mice. Recipient mice were subsequently infected i.p. with 2×10⁵
PFU of the Armstrong strain of lymphocytic choriomeningitis virus (LCMV) or 1010 CFU
of Listeria monocytogenes expressing GP33–41 via oral gavage
9
one day after cell transfer. For induced Runx3 deletion, recipient mice were treated
with 1mg of tamoxifen diluted in sunflower oil i.p. on days 0–4, 2–5, or 6–8 of infection.
For late deletion of Runx3 (days 16–20), recipient mice were treated with 2mg of tamoxifen
via oral gavage.
For Trm precursor experiments, 1×10⁵ P14 cells were transferred, recipient mice were
infected with LCMV the next day, and KLRG1lo or KLRG1hi P14 cells from spleens and
lymph nodes were sorted on day 5 of infection. Sorted cells (1×10⁵) were transferred
into recipient mice infected 4 days prior with LCMV. The number of CD62L+ Tcm, CD62L−
Tem, or IEL Trm were evaluated on day 20–25 of infection using flow cytometry.
To distinguish vascular associated CD8+ T cells in non-lymphoid tissues, 3μg of CD8α
(53–6.7) conjugated to APC eFlour780 was injected i.v. into mice four minutes prior
to sacrifice and organ excision. CD8αneg cells were considered to be localized within
non-lymphoid tissues.
Preparation of cell suspensions
Isolation of CD8+ T cells was performed similarly as described
31
. For isolation of CD8+ T cells from the small intestine intraepithelial lymphocyte
(IEL) compartment, Peyer’s patches were removed and the intestine was cut longitudinally
and subsequently cut laterally into 0.5–1cm2 pieces that were then incubated with
0.154mg/mL dithioerythritol (DTE) in 10% HBSS/HEPES bicarbonate for 30min at 37°C
while stirring. Kidneys, salivary glands, and lungs were cut into pieces and digested
for 30min with 100 U/mL type I collagenase (Worthington) in RPMI 1640, 5% FBS, 2mM
MgCl2, 2mM CaCl2 at 37°C while shaking. Skin was processed similarly as described
32
in which a 2cm2 area of the right flank was excised, pre-digested for 30min at 37°C
and then enzymatically digested with 0.7 mg/mL collagenase D. After enzymatic incubations
(skin, lungs, kidneys, salivary glands), tissues were further dissociated over a 70μm
nylon cell strainer (Falcon). For isolation of lymphocytes, single-cell suspensions
were then separated using a 44/67% Percoll density gradient. Spleens and lymph nodes
were processed with the frosted ends of microscope slides. Red blood cells were lysed
with ACK buffer (140 mM NH4Cl and 17 mM Tris-base, pH 7.4).
Antibodies, intracellular staining, flow cytometry, and cell sorting
The following antibodies were obtained from eBioscience: CD8α (53–6.7), CD8β (eBio
H35–17.2), CD62L (MEL-14), CD127 (A7R34), KLRG1 (2F1), CD103 (2E7), CD69 (H1.2F3),
CD45.1 (A20–1.7), CD45.2 (104), Thy1.1 (OX-7, HIS51), Thy1.2 (53–2.1), CCR9 (Ebio
CW-1.2), CXCR3 (CXCR3–173), CD49d (R1–2), TNFα (MP6-XT22), GzB (GB11), PD-1 (J43),
Tim3 (RMT3–23), Lag3 (eBioC9B7N), KI-67 (SolA15), and IFNγ (XMG1.2) or from BioLegend:
CD62L (MEL-14), CD103 (2E7), CD69 (H1.2F3), CD45.1 (A20–1.7), Thy1.1 (OX-7), Thy1.2
(30-H12), and T-bet (4B10). For analysis of apoptosis, the Annexin V Apoptosis Detection
Kit was used per manufacturer instructions (eBioscience); propidium iodide negative
cells were analyzed for Annexin V staining. The H-2Db GP33–41 tetramer was obtained
from the NIH Tetramer Core. For intracellular staining of cytokines or TFs while preserving
ametrine or YFP reporter expression in transduced or Cre-YFP+ populations, cells were
fixed and permeabilized through a 10min incubation with BD cytofix/cytoperm (BD Biosciences).
Intracellular staining was subsequently performed using the Permeabilization Buffer
of the Foxp3-Transcription Factor Staining Buffer Set (eBioscience). To assess cytokine
production, CD8+ T cells were re-stimulated with the GP33–41 peptide in the presence
of Protein Transport Inhibitor Cocktail (eBioscience). For flow cytometry analysis,
all events were acquired on a BD LSRFortessa X-20 or a BD LSRFortessa. Cell sorting
was performed on BD FACSAria or BD FACSAria Fusion instruments.
RNAi screening approach
We have described this screening approach in detail previously
16
. The targeted shRNAmir library was generated based on key genes identified from the
computational screening approach as well as genes with known roles in regulating Trm
from literature. The library was produced by cloning shERWOOD-designed shRNAmir sequences
33
, after PCR of synthetic 97mer oligos, into our pLMPd-Amt vector
16
. Purified DNA from sequence-verified clones was used to package retroviral particles
in PLAT-E cells. For transfections, PLAT-E cells were seeded in the middle 60 wells
of a 96-well flat bottom plate at a density of 4–6×10⁴ cells/well one day prior to
transfection. Next, each well was individually transfected with 0.2μg of DNA from
each pLMPd-Amt clone and 0.2μg of pCL-Eco using TransIT-LT1 (Mirus). Retroviral supernatant
was harvested 36, 48, and 60h after transfection, and RV sup from each well was used
to individually transduce in vitro activated P14 cells in 96-well round bottom plates.
For CD8+ T cell activation in vitro, naive CD8+ T cells from spleen and lymph nodes
were negatively enriched and 2×10⁵ P14 cells were plated in the middle 60 wells of
96-well round bottom plates pre-coated with 100μg/mL goat anti-hamster IgG (H+L, Thermoscientific)
and 1μg/mL anti-CD3 (145–2C11) and 1μg/mL anti-CD28 (37.51) (both from eBioscience).
Culture media was removed 18h after activation, and replaced with retroviral supernatant
supplemented with 50μM BME and 8μg/mL polybrene (Millipore) followed by spinfection
(60min. centrifugation at 2000 rpm, 37°C). Two hours after the spinfection, the P14
cells were washed 3 times with cold PBS and 90% of each well of cells (individually
transduced with distinct retroviral constructs) was harvested, pooled and 5×10⁵ pooled
P14 cells were transferred into recipient mice which were then infected 1h later with
1.5×10⁵ PFU of LCMV clone 13 i.p. 1h later, resulting in an acute infection
16
. The remaining cells in vitro were cultured for an additional 24h and either pooled
for “input” sequencing (6×10⁵ P14 cells) or were used to test transduction efficiency
of each construct using flow cytometry to detect the percentage of ametrine+ cells
in each well.
Twelve days after infection, spleens and small intestines were harvested from 15–18
mice and splenocytes and IEL P14 cells were processed as described above. Prior to
sorting, all IEL or splenic samples were pooled. CD62L+ P14 cells (Tcm) from the spleen
as well as P14 cells from the IEL were sorted (2–6×10⁵ cells total). Genomic DNA was
then harvested from sorted cells using the FlexiGene kit (Qiagen). The integrated
proviral passenger strand shRNAmir sequences in each cell subset were amplified from
20–100ng total genomic DNA per reaction, with 23–28 cycles of PCR using Ion Proton-compatible
barcoded primers that anneal to the common 5′ mir30 and shRNAmir loop sequences. 2–3
replicate reactions were performed for each genomic DNA sample and the replicates
were pooled after amplification. The pooled reactions were purified using AMPure XP
beads, the amplicons in each sample were quantified using a Bioanalyzer, and then
pooled in a 1:1 molar ratio for sequencing. In each replicate of the screen, a minimum
of 2.5 million reads per sample were generated and retained, after filtering low-quality
reads. Reads assigned to each barcode were aligned to a reference database of all
shRNAmirs in the library using BLAST and a custom script to count the top alignment
of each read and summarize the number of reads aligned to each shRNAmir.
For analysis of shRNAmir representation in Tcm relative to IEL Trm, the total number
of reads in each of the samples was normalized, and the number of reads for each shRNAmir
was scaled proportionally. Subsequently, the normalized number of reads in the IEL
Trm cells for a given shRNAmir was divided by the normalized number of reads for the
same shRNAmir in the Tcm sample and then log2 transformed. The mean and standard deviation
of the ratios of each of the 25 negative control shRNAmir constructs (targeting Cd19,
Cd4, Cd14, Ms4a1, Cd22, Hes1, Klf12, Mafb, Plagl1, Pou2af1, and Smarca1) were used
to calculate the Z-score for each shRNAmir construct. The screen was repeated three
times and the Z-score of each construct from each individual screen was averaged and
plotted (Fig. 1i, SI Table 2). Certain constructs were added after the first screen
or were not detectable in one of the screens, but all constructs were successfully
screened 2–3 times except for 13 constructs, which are marked by an asterisk in SI
Table 2. Eighty-four percent (21/25) of all negative control shRNAmir constructs had
an average Z-score between −0.9 and 0.9.
CD8+ T cell transduction, cell transfer, and infection for individual analysis of
retroviral constructs
Activation, transfections, and transductions were carried out as described for the
RNAi screening approach except in some experiments 2×10⁶ P14 cells were activated
per well in 6-well plates. Congenically distinct P14 cells transduced with the Runx3.2
shRNAmir or Cd19.1 shRNAmir (control) retroviruses were mixed 1:1 within 24h of transduction
and a total of 1–5×10⁵ P14 cells were transferred i.v. into recipient mice. One hour
after adoptive transfer, recipient mice were infected i.p. or intratracheally (i.t.)
with 2×10⁵ PFU LCMV armstrong or intradermally (i.d.) with 2×10⁴ PFU clone 13. In
similar experiments, P14 cells were transduced with MigR1-based retroviruses
34
that were empty (GFP-RV) or that contained Runx3 cDNA (Runx3-RV), mixed 1:1 and transferred
to recipient mice for subsequent infections. For T-bet rescue experiments, Thy1.2+
Runx3
+/+ Ert2-Cre YFP+ P14 cells were transduced with Cd19.1 shRNAmir and Thy1.1+
Runx3fl
/fl Ert2-Cre YFP+ P14 cells were transduced with Tbx21.3 shRNAmir, mixed 1:1 and transferred
into recipient mice, which were infected 1h later with LCMV armstrong i.p. and treated
with 1mg tamoxifen i.p. for five consecutive days starting with the day of infection.
Adoptive therapy tumor model
For adoptive therapy experiments, 5×10⁵ B16-GP
33
cells, treated for mycoplasma contamination and authenticated in in vitro killing
assays, were transplanted subcutaneously into the right flank of wild-type mice. After
tumors became palpable, 7–8 days post-transplant, in vitro expanded P14 cells were
transferred i.v. For comparison of TIL accumulation in a mixed transfer setting, naive
P14 cells were activated, transduced, and expanded with 100U/mL of IL-2 for 2–3 days;
cells transduced with control constructs (Cd19.1 shRNAmir or GFP-RV) or experimental
constructs (Runx3.2 shRNAmir or Runx3-RV) were mixed 1:1 and 0.5–1×10⁶ P14 cells were
transferred i.v. For efficacy studies, transduced cells were expanded for 5–6 days;
transduced cells were then sorted (or not sorted with a Runx3-RV and GFP-RV transduction
efficiency >83%), and 1–2.5×10⁶ cells were transferred i.v. into mice with established
B16-GP
33
tumors. Tumors were monitored daily and mice with ulcerated tumors or tumors exceeding
1500 mm3 were euthanized, in accordance with UCSD IACUC .
qPCR, Microarray, RNA-seq, and ATAC-seq analysis
For validation of the Runx3-RV overexpression construct and Runx3.2 shRNAmir construct,
enriched CD8+ T cells were activated, transduced, and expanded for 4–6 days in 100U/mL
IL-2. Cells were sorted on ametrine (Runx3 shRNAmir or Con shRNAmir) or GFP (Runx3-RV
or GFP-RV) directly into TRIzol (Life Technologies) and RNA was extracted per manufacturer’s
specifications. Next, cDNA was synthesized using Superscript II (Life Technologies)
and qPCR was performed using the Stratagene Brilliant II Syber Green master mix (Agilent
Technologies). Runx3 expression levels were normalized to the housekeeping gene Hprt.
We have previously validated the Tbx21.3 shRNAmir
16
. The following primers were used for qPCR: Runx3 forward, 5′-CAGGTTCAACGACCTTCGATT-3′,
and Runx3 reverse, 5′-GTGGTAGGTAGCCACTTGGG-3′; Hprt forward, 5′-GGCCAGACTTTGTTGGATTT-3′,
and Hprt reverse, 5′-CAACTTGCGCTCATCTTAGG-3′.
On day 7 of infection, tissues from 2–3 mice were pooled and 2–3×10⁴ P14 cells from
the IEL, kidney, spleen, or blood were sorted into TRIzol. On day 35 of infection,
tissues from 5–10 mice were pooled and 1–2×10⁴ CD62L+ Tcm, CD62L− Tem, kidney Trm,
and IEL Trm P14 cells were sorted into TRIzol. As described previously, RNA was amplified
and labeled with biotin and hybridized to Affymetrix Mouse Gene ST 1.0 micrroarrays
(Affymetrix)
35
. Analyses were performed using GenePattern Multiplot Studio. Differentially expressed
genes in IEL Trm compared to Tcm and Tem as well as kidney Trm compared to Tcm and
Tem were identified with a fold change (FC) >1.5 and an expression value (EV) >120
(Fig. 1a). Genes with >1.5 FC and >120 EV between day 7 spleen, day 7 IEL, and day
7 kidney samples were identified (1838 probes) and evaluated in day 7 and day 35 subsets,
which were ordered with Pearson correlation using the HierarchicalClustering module
of GenePattern (Fig. 1b); data was row centered, row normalized, and visualized with
the HierarchicalClusteringViewer module within GenePattern.
The core Trm and circulating signatures were generated by integrating differential
expression (>1.5 FC) data comparing Trm from the following tissues to circulating
splenic memory cells (or splenic Tcm if both Tcm and Tem datasets were available):
D35 IEL (LCMV), D35 kidney parenchyma (LCMV), D30 skin CD103+CD8+ (herpes simplex
virus)
5
, D30 lung CD103+CD8+ (influenza virus)
5
, and D20 CD103+ brain (vesicular stomatitis virus)
7
; overlapping genes upregulated in all Trm populations comprised the core tissue-residency
signature (121 genes) and genes downregulated in all populations comprised the circulating
signature (93 genes). The mouse TIL microarray datasets were generated previously
27
.
For RNA-seq analysis of D7 IEL, D7 MP, and D7 TE, the populations were sorted on day
7 of LCMV Armstrong infection as well as naive P14 cells; spleens or IEL samples from
2–3 mice were pooled and 5×10³ cells were sorted. For RNA-seq analysis of TIL, congenically
distinct P14 cells were transduced with Runx3-RV or GFP-RV, mixed 1:1 and 1×10⁶ were
transferred to mice with day 7 established melanoma B16-GP
33
tumors. Eight days later, 1×10³ transduced TIL or splenocytes were sorted from 4 mice
for each replicate. For library preparation, isolation of polyA+ RNA was performed
as detailed online (www.immgen.com/Protocols/11cells.pdf). For RNA-seq analyses of
Runx3-manipulated cells, CD8+ T cells from naive Runx3+/+
YFP+ (WT) and Runx3
fl/fl YFP+ (Runx3fl/fl
) mice were enriched by negative isolation and transduced (as detailed above) with
a Cre cDNA expressing retrovirus (Cre-RV). Runx3-overexpressing cells were generated
similarly by transducing Runx3+/+
YFP+ CD8 T cells with a Runx3-cDNA expressing retrovirus (Runx3-RV). Forty-eight hours
after TCR activation, the CD8+ T cells were resuspended and re-cultured in fresh media
supplemented with 100U/mL rhIL-2; twenty-four hours later, YFP+ (“WT” or “Runx3fl/f
l”) or GFP+ (Runx3-RV) were FACS-purified and then recultured in 100U/mL IL-2. The
cells were expanded until day 6 by reculturing at 5×10⁵ cells/mL every 24h in fresh
100U/mL IL-2 media. On day 6 post-activation, cells were harvested and total RNA was
extracted in TRIzol. Purified RNA was depleted of ribosomal RNA and strand-specific
paired-end libraries were prepared and sequenced using an Illumina Nextseq 500. Samples
were generated from two biological replicates, and approximately 20 million paired-reads
were generated per sample. Reads were mapped using Tophat
36
and aligned reads in transcripts were counted with HTseq
37
. Gene-set-enrichment analysis (GSEA) was performed by using the GSEA module in GenePattern,
and the normalized enrichment scores and false-discovery rate q values were determined
by using the permutation test.
ATAC-seq was performed as described in detail previously
24
. Sorted cells (2.5×10⁴) were resuspended in 25μL of lysis buffer and spun down 600g
for 30min at 4°C. The nuclear pellet was resuspended in 25μL of Tn5 transposase reaction
mixture (Nextera DNA Sample Prep Kit, Illumina) and incubated for 30min at 37°C. Transposase-associated
DNA was subsequently purified (Zymo DNA clean-up kit). For library amplification,
DNA was amplified using indexing primer from Nextera kit and NEBNext High-Fidelity
2X PCR master mix. Then, the amplified DNA was size-selected to fragments less than
800 bp using SPRI beads. The library was sequenced using Hiseq 2500 for single-end
50-bp sequencing to yield at least 10 million reads. We used bowtie to map raw reads
to the Mus musculus genome (mm10) with following parameters: “–best -m 1”. We called
peaks for each individual replicate as well as the pooled data from the two replicates
using MACS2 with a relaxed threshold (P-value 0.01).
For the single cell RNA-seq analysis of human
30
and mouse melanoma TIL
29
, the preprocessed single cell TIL gene expression data was downloaded from GEO database
GSE72056 or GSE86042, respectively. Activated CD8+ TIL (CD8a expression >5 and CD44
expression>2) was used and classified into Runx3
hi TIL, which express relatively high levels of Runx3 (Runx3 expression>3) and Runx3
lo TIL with no Runx3 expression (Runx3 expression=0). For the human TIL, melanoma
#75 was used. GSEA was performed to evaluate enrichment of the core tissue-residency
gene expression signature in Runx3
hi TIL relative to Runx3
lo TIL.
Computational Screen: TF regulatory networks and personalized PageRank analysis
TF regulatory networks and PageRank analysis was performed similarly as described
24
except that gene expression and ATAC-seq data from D7 IEL, D7 kidney and D7 spleen
samples were used. To construct the TF regulatory network, TF-binding motifs were
first scanned on ATAC-seq peaks using an algorithm described previously
14
and a P-value cutoff of 1×10⁻⁵. Then, we connected a TF to a gene if the TF had any
predicted binding motif in the ATAC-seq peak of the nearest gene. We assembled all
the interactions between TFs and genes into a regulatory network. To identify important
TF regulators for Trm differentiation, we performed personalized PageRank analysis
in the TF regulatory network constructed above using the pipeline described previously
14
. The importance of a TF is based on the quantity and quality of its regulated gene
targets. A TF would receive a higher PageRank score if it regulates more important
genes where the importance is evaluated by differential expression from microarray
or RNA-seq analyses. Extended Data Fig. 2b and SI Table 1 indicate the PageRank score
and expression value of all TFs expressed (>120 EV) in the spleen, kidney or IEL cells.
Statistical analysis
Student’s t-test (two-tailed) was used for comparisons between two groups. Log-rank
(Mantel-Cox) test was used to compare survival curves. All microarray, RNAseq, and
ATACseq samples were performed independently in 2–3 replicates. All statistical tests
were performed with GraphPad Prism software and P<0.05 was considered statistically
significant.
Data Availability
RNA-seq, microarray, and ATAC-seq data are available in the GEO database: accession
codes (will be provided). Source Data are provided in the online version of the manuscript.
Additional information and materials will be made available upon request.
Extended Data
Extended Data Figure 1
KLRG1lo cells preferentially give rise to Trm
a, Representative flow cytometric gating strategy for distinguishing P14 cells located
in non-lymphoid tissues following CD8α i.v. administration in LCMV infected mice (left).
Right, in vitro activated P14 cells were transferred to recipient mice and infected
with LCMV and the frequency of CD69+ and CD103+ P14 cells among KLRG1hi and KLRG1lo
on day 7 of infection is indicated. b, Frequency of CCR9, CXCR3, and CD49d on KLRG1lo
and KLRG1hi cells in the IEL compartment on day 7 of infection. c, Schematic of experimental
design (top). KLRG1lo and KLRG1hi P14 cells were sorted from spleens and LNs on day
5 of LCMV infection and transferred into recipient mice infected 4 days prior with
LCMV. Tcm, Tem, and Trm P14 cells were enumerated on days 20 or 25 of infection using
flow cytometry (bottom). Graphs indicate mean ± s.e.m of n=5 mice (a,b) or n=3–4 mice
(c) from one representative of 2 independent experiments, *P<0.05, **P<0.01, ***P<0.005.
Symbols represent an individual mouse (c).
Extended Data Figure 2
Representative ATAC-seq peaks and putative Trm regulators identified through PageRank
analysis
a, ATAC-seq analysis of the indicated loci on day 7 of infection (left) and corresponding
gene expression (right). b, Personalized PageRank score and gene-expression of TFs
with select TFs highlighted.
Extended Data Figure 3
Runx3-deficiency impairs IEL Trm formation
a, Runx3 mRNA levels from indicated cells determined by microarray analyses. b, Relative
Runx3 mRNA expression of in vitro cultured cells transduced with Con shRNAmir or Runx3
shRNAmir-encoding retroviruses measured by qPCR. c, Congenically distinct P14 cells
were transduced with Runx3 shRNAmir or Con shRNAmir encoding retroviruses, mixed at
a 1:1 ratio, and transferred to recipient mice that were subsequently infected with
LCMV. Representative flow cytometry plots (bottom, left) and quantification of the
ratio of Runx3 shRNAmir or control shRNAmir transduced P14 cells in indicated tissues
on day 12 of infection (bottom, right). d, Representative flow cytometry plots (left)
and quantification of the frequency of CD69+ and CD103+ cells of Con shRNAmir or Runx3
shRNAmir cells (right) from experimental schematic in c. e, Representative flow cytometry
plots and quantification of the frequency of CD69+ and CD103+ cells from Fig. 2 c,d.
f, Representative flow cytometry plots and quantification of the frequency of CD69+
and CD103+ cells from Fig. 2f. Graphs indicate mean ± s.e.m and representative of
two independent experiments (b) with n=5 (c,d), n=5 (LM-GP33–41) or n=6 (LCMV) (e),
and n=5 (vehicle) or n=3 (tamoxifen) (f), *P<0.05, **P<0.01 ***P<0.005. Symbols represent
an individual mouse (c–f).
Extended Data Figure 4
Runx3-deficiency impairs IEL Trm formation in a polyclonal setting
a, Representative flow cytometry plot of H-2Db GP33–41 tetramer staining of lymphocytes
from Runx3fl/fl dLck-Cre+YFP and Runx3+/+dLck-Cre+YFP mice on day 12 of LCMV infection
(gated on total lymphocytes). b, Quantification of the proportion (left) and absolute
number (right) of tetramer+ cells. c,d, Representative flow cytometry plots and quantification
of the frequency of CD69+ and CD103+ cells. Graphs indicate mean ± s.e.m with n=4
(Runx3+/+
) or n=5 (Runx3fl/fl
) mice pooled from two independent experiments, **P<0.01, ***P<0.005. Symbols represent
an individual mouse (b,d).
Extended Data Figure 5
Runx3 is required for Trm formation in diverse non-lymphoid tissues
a, Schematic of experimental design. b, Representative flow cytometry plots (left)
and quantification (right) of the ratio Runx3fl/fl
and Runx3+/+
P14 cells (gated on YFP-Cre+ cells) in lymphoid and non-lymphoid compartments on days
15/16 of LCMV infection (same data as in Fig. 2d but including SG and kidney populations).
c, Schematic for experimental design. d, Representative flow cytometry plots (left)
and quantification (right) of the ratio of transduced cells in the skin relative to
the spleen for Con shRNAmir or Runx3 shRNAmir P14 cells on day 12 of an intradermal
(i.d.) LCMV infection. e, Frequency of CD69+ and CD103+ cells. f, Schematic for experimental
design. g, Representative flow cytometry plots (left) and quantification (right) of
the ratio of transduced cells in the lung parenchyma relative to the spleen for Con
shRNAmir or Runx3 shRNAmir P14 cells on day 12 of an intratracheal (i.t.) LCMV infection.
h, Frequency of CD69+ and CD103+ cells. Graphs indicate mean ± s.e.m and representative
of two independent experiments with n=6 (b), or data pooled from two individual experiments
with n=6 per group (c–h), *P<0.05, **P<0.01, ***P<0.005. Symbols represent an individual
mouse (b,d,e,g,h).
Extended Data Figure 6
Runx3-deficiency enhances Trm apoptosis but does impact trafficking or proliferation
a, Representative flow cytometry histogram of granzyme B (GzB) staining (left) and
quantification of frequency of GzB+ cells on day 12 or 14 of infection. b, Representative
flow cytometry plots (left) and quantification (right) of the frequency of IFNγ- and
TNFα-producing Con shRNAmir or Runx3 shRNAmir P14 cells on day 6 of LCMV infection,
restimulated with GP33–41 peptide. c,d, Representative histograms and quantification
of Annexin V+ cells from shRNAmir mixed transfers on day 14 of LCMV infection (c)
or from day 8 Runx3fl/fl
and Runx3+/+
mixed P14 transfers where tamoxifen was administered on days 2–5 of LCMV infection
(d). e, Congenically distinct P14 cells were transduced with Con shRNAmir or Runx3
shRNAmir encoding retroviruses, mixed at a 1:1 ratio, and transferred to recipient
mice that were subsequently infected with LCMV. On day 6 of infection, splenocytes
were harvested and retransferred to day 5 infected host mice and 18h later spleen,
mLN and small intestine were harvested to assess trafficking. Representative flow
cytometry plots (bottom, left) and quantification of the ratio of Con shRNAmir and
Runx3 shRNAmir transduced P14 cells (bottom, right) in indicated tissues 18h after
transfer. f, Frequency of KI-67+ Con shRNAmir or Runx3 shRNAmir transduced P14 cells
in a mixed transfer setting on days 6 and 12 or 14 of LCMV infection. Graphs indicate
mean ± s.e.m and representative of two independent experiments with n=5 (a), n=3 (b),
n=5 (c), n=6 (d), n=4 (e), and n=3 on day 6 or n=4 on day 14 (f) except d is pooled
from two independent experiments, *P<0.05, **P<0.01, ***P<0.005, n.s., not significant.
Symbols represent an individual mouse (a–f).
Extended Data Figure 7
Runx3 overexpression enhances lung Trm differentiation
a, Runx3 mRNA expression of in vitro cultured cells transduced with GFP-RV or Runx3-RV.
b, Schematic for experimental design of intratracheal (i.t.) LCMV infection. c, Representative
flow cytometry plots (left) and quantification (right) of the ratio of GFP-RV or Runx3-RV
cells in the mediastinal LN (medLN), lung parenchyma, or CD69+CD103+ lung parenchyma
population on day 12 or 13. d, Representative flow cytometry plots (left) and quantification
(right) of the frequency of CD69+ and CD103+ P14 cells in the lung parenchyma. Graphs
indicate mean ± s.e.m and data representative of one of two independent experiments
(a) and n=4 per group (c,d), *P<0.05, ***P<0.005. Symbols represent an individual
mouse (c,d).
Extended Data Figure 8
Runx3 regulates distinct gene programs in circulating cells versus tissue resident
cells and operates upstream of T-bet in programming IEL Trm differentiation
a, Percentage of genes of the core tissue-residency signature, core circulating signature,
or background sites that exhibit direct Runx3 binding by ChIP-seq analysis
23
. b, Predicted Runx3 binding network, generated from ATAC-seq analysis, in IEL P14
cells and splenic P14 cells on day 7 of infection (left). Red indicates genes putatively
regulated by Runx3 in IEL cells; grey indicates genes putatively regulated by Runx3
in splenic cells. Gene Ontology (GO) enrichment analysis (right) of gene sets in the
predicted Runx3 binding network in each tissue. c, Runx3 ChIP-seq of the Tbx21 locus
in naive and activated CD8+ T cells from Lotem et al.
23
. d, Representative flow cytometry histograms (left) and MFI quantification (right)
of T-bet expression in splenic P14 cells on day 8 of infection. e, Schematic for experimental
design (left) in which Runx3+/+l
Ert2-Cre+YFP were transduced with Con shRNAmir and Runx3+/+
Ert2-Cre+YFP P14 cells were transduced with Tbx21 shRNAmir, mixed 1:1 and transferred
into recipient mice subsequently infected with LCMV. Recipient mice were treated with
tamoxifen on days 0–4 of infection. Representative flow cytometry plots (middle panel)
and quantification of the ratio of untransduced (ametrine−) Runx3+/+
and Runx3fl/fl
P14 cells and the ratio of transduced (ametrine+) Runx3+/+
/Con shRNAmir and Runx3fl/fl
/Tbx21 shRNAmir (right) were evaluated on day 12 of LCMV infection. f, Representative
flow cytometry plots (left) and quantification (right) of the frequency of CD69+ and
CD103+ cells. g, Runx3 ChIPseq of the Klf2 locus in naive and activated CD8+ T cells
23
. h, Fold change in gene-expression of Klf2, S1pr1, and Ccr7 in Runx3fl/fl and Runx3-RV
cells relative to Runx3+/+ WT cells, from RNA-seq analysis consisting of 2 replicates
per sample. Graphs indicate mean ± s.e.m and data representative of one of two independent
experiments with n=6 (Runx3fl/fl
) or n=4 (Runx3 shRNA) (d) and n=4 per group(e,f). *P<0.05, **P<0.01 ***P<0.005. Symbols
represent an individual mouse (d–f).
Extended Data Figure 9
Runx3-deficiency does not impair trafficking to the tumor but impacts the effector
phenotype of TIL
a, Schematic of adoptive therapy experimental design. b, Congenically distinct P14
cells were transduced with Runx3 shRNAmir or Con shRNAmir encoding retroviruses, mixed
at a 1:1 ratio, and transferred into mice with established B16-GP
33
melanoma tumors. Eighteen hours after transfer, tumors were harvested to assess the
ratio of Runx3 shRNAmir or Con shRNAmir P14 cells. c, Representative flow cytometry
histograms of Con shRNAmir, Runx3 shRNAmir, GFP-RV, or Runx3-RV TIL in mixed transfer
settings. Control P14 splenocytes were included in histograms for reference. d, Gene
set enrichment analysis of the core tissue-residency and core circulating gene signatures
in human lung CD8+ TIL relative to corresponding CD8+ PBMCs
25
. Graphs indicate mean ± s.e.m and combined of two independent experiments with n=5
mice per group (b) or representative of two independent experiments with n=3–6 per
group (b). Symbols represent an individual mouse (b).
Supplementary Material
Supplemental Information Guide
Related collections
Most cited references20
- Record: found
- Abstract: found
- Article: not found
Memory T cell subsets, migration patterns, and tissue residence.
Scott N. Mueller, Thomas Gebhardt, Francis Carbone … (2013)
- Record: found
- Abstract: found
- Article: not found
Tissue-resident memory features are linked to the magnitude of cytotoxic T cell responses in human lung cancer
Anusha-Preethi Ganesan, James Clarke, Oliver S Wood … (2017)
- Record: found
- Abstract: found
- Article: not found
Differential requirements for Runx proteins in CD4 repression and epigenetic silencing during T lymphocyte development.
Ichiro Taniuchi, Motomi Osato, Takeshi Egawa … (2002)