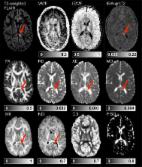
1 Introduction Neurofibromatosis type 1 (NF1) is an autosomal dominant genetic disorder, with a prevalence of approximately 1 in 2700 newborns (Evans et al., 2010). The disorder is characterized by multiple café-au-lait spots, axillary or inguinal freckling, iris Lisch nodules, distinctive osseous lesions and tumors of the nervous system, such as neurofibromas and optic pathway gliomas. In addition to these clinical features, cognitive dysfunction is the most common complication of NF1. Approximately 80% of NF1 children experience moderate to severe impairment in one or more areas of cognitive functioning (Hyman et al., 2005; Krab et al., 2008). 1.1 Unidentified bright objects NF1 is associated with a number of magnetic resonance (MR) abnormalities, including volumetric change in both white matter (WM) and gray matter (GM) (Moore, B.D. 3rd et al., 2000; Cutting et al., 2000; Steen et al., 2001; Greenwood et al., 2005). In addition to these general changes, hyperintense foci, termed “unidentified bright objects” (UBOs) or T2 hyperintensities are readily detected on T2-weighted MRI scans of children and adolescents with the disorder. Such UBOs are typically found in the cerebellum (dentate nuclei, middle cerebellar peduncles, cerebellar deep white matter), brainstem, basal ganglia and thalami (Itoh et al., 1994; Van Es et al., 1996; Griffiths et al., 1999). Fig. 1 shows some examples. UBOs have been described as hamartomas1 (Braffman et al. 1988), regions of abnormal myelination (Smirniotopoulos and Murphy 1992) or heterotopias2 (Bognanno et al. 1988). However, as NF1 is rarely lethal, to date only one histological experiment has been conducted to assess UBO microstructure (DiPaolo et al., 1995). In this study, vacuoles of between 5 and 100 µm were found in the myelin sheath, suggesting intramyelinic edema. No evidence of any inflammatory reaction or demyelination was found and axonal loss was excluded. Furthermore, the white matter expressed hypocellularity and glial cell proliferation. Although UBOs may be transient and are considered benign, some persist into adulthood and there is increasing evidence correlating their presence with cognitive dysfunction (B.D. Moore et al., 1996; Goh et al., 2004; Hyman et al., 2007; Feldmann et al., 2010; Piscitelli et al., 2012). Understanding the pathophysiological substrate of UBOs may provide a basis from which to identify which UBOs are transient, how they respond to pharmacological treatments and how they relate to the risk of cognitive complaints during childhood and adolescence. 1.2 In vivo assessment of UBO microstructure using diffusion MRI and multi-exponential T2 relaxation Diffusion magnetic resonance imaging (dMRI) (Le Bihan et al., 1986) can be used to investigate UBOs in vivo. dMRI relates the dispersion of water molecules within tissue over a short interval of time (typically in the order of 10-2 s) to microstructural features reflecting cellularity, membrane density and neurite orientation. In (over-) simplified terms, water moving most freely, such as in extra-axonal spaces, displays Gaussian diffusion, while water restricted within cells, displays non-Gaussian diffusion. A number of different dMRI models are able to quantify these two types of diffusion, namely diffusion tensor imaging (DTI) (Basser et al., 1994a; Basser, 1995), diffusion kurtosis imaging (DKI) (Jensen and Helpern, 2010) and neurite orientation dispersion and density imaging (NODDI) (Zhang et al., 2012), and are summarized in Table 1. Previous studies using simple dMRI and DTI have reported elevated apparent diffusion coefficient (ADC) in T2-hyperintense lesions compared to NAWM in patients (Alkan et al., 2005; Tognini et al., 2005) and controls (Eastwood et al., 2001; Alkan et al., 2005; Tognini et al., 2005; van Engelen et al., 2008) and significantly decreased fractional anisotropy (FA) values in UBO sites compared to NAWM (Zamboni et al., 2007; Ferraz-Filho et al., 2012a; Ferraz-Filho et al., 2012b; Filippi et al., 2012). Neither DKI nor NODDI has previously been used to investigate UBOs. Multi-exponential T2 relaxation (MacKay et al., 1994; MacKay et al., 2006) is a complementary MRI technique that distinguishes the MR signal arising from different water pools based on T2 relaxation. Typically three water peaks can be identified in the so-called T2 distribution. In normal human white matter, and in a 3 Tesla magnetic field, the water that is trapped between the myelin bilayers exhibits a short T2 relaxation time of around 20 ms, whereas intra- and extracellular water relaxes at an intermediate rate of around 80 ms (MacKay et al., 1994; Whittall et al., 1997; Webb et al., 2003). The first peak in the T2 distribution is therefore attributable to myelin water, while the second peak (around 80 ms) represents combined intra- and extracellular water. CSF has T2 values in the order of seconds. A summary of the measures that can be derived from dMRI and MET2 is provided in Table 1, and a more detailed overview is provided as Supplementary material (SM1). 1.3 Aim of present study Although findings from DTI metrics are suggestive of altered tissue microstructure in UBO regions, the lack of specificity of measures derived from these techniques means that the exact nature of the histopathological changes arising in UBOs remains elusive. The aim of the present study therefore, was to use two novel, advanced white matter imaging approaches: MET2 and DKI/NODDI, in addition to DTI, to refine our understanding of the microstructural basis of UBOs. By extension, a further aim was to demonstrate the utility of combining these techniques to advance our understanding of T2 hyperintensities arising in other pathologies and advancing age. 2 Materials & methods 2.1 Subjects Seventeen NF1 patients with UBOs (7 girls (age 13 ± 3 years), 10 boys (age 12 ± 3 years)) underwent an MRI scan. Subjects were recruited from the Leuven multidisciplinary neurofibromatosis clinic and the multidisciplinary NF1-outpatient clinic of the Erasmus MC-Sophia Children's Hospital in Rotterdam. The study was approved by the local Ethical Commission and conducted in accordance with the Declaration of Helsinki. 2.2 Data acquisition Imaging data were acquired using a 3 T MR scanner (Achieva; Philips, Best, the Netherlands) and a 32-channel phased-array head coil. Multi-slice T2-weighted FLAIR images were acquired to identify UBOs. Acquisition parameters were TR/TI = 11,000 ms/2800 ms, TE = 120 ms, 25 slices, and thickness 4 mm. A spin-echo echo-planar imaging diffusion-weighted scheme was obtained consisting of three b-values (700, 1000 and 2800 s/mm2) acquired along 25, 40 and 75 uniformly distributed directions, respectively (Poot et al., 2010). Constant scan parameters were TR/TE = 7800 ms/90 ms, 50 slices, voxel size 2.5 × 2.5 × 2.5 mm3, parallel imaging factor 2. Each diffusion-weighted acquisition was complemented with a gradient-free image (b = 0) and seven additional b = 0 images were acquired. For MET2 analysis, a 3D GraSE multi-echo sequence was used (Maedler and MacKay, 2007; Prasloski et al., 2012b). The scan included 32 echoes with a first echo time of 10 ms and a ?TE of 10 ms (TE = 10 ms, 20 ms, …, 320 ms) and EPI read-out factor of 3, TR = 800 ms, 32 mid-axial slices and voxel size 1 × 1 × 2 mm3. 2.3 Data analysis 2.3.1 T2-weighted FLAIR An experienced radiologist (FD' A) identified white matter UBOs on T2-weighted FLAIR images. We excluded regions of bilateral T2-hyperintensities from the analysis. The T2-weighted FLAIR images were then resampled to 2.5 mm slice thickness and regions of interest (ROIs) were manually delineated around sites of white matter hyperintensities and the contralateral normal-appearing white matter (cNAWM). 2.3.2 dMRI All datasets were visually inspected by looping through the DWIs in all three orthogonal views (axial, sagittal, coronal). Datasets with obvious artifacts (e.g. signal dropout, gross geometric distortion, bulk motion) were excluded. The suitable datasets were then corrected for motion-induced and eddy current induced geometric distortions with appropriate reorientation of the b-matrix using the ExploreDTI Toolbox (Leemans, 2009; Leemans and Jones, 2009). Next, the resulting DWIs were fitted to the DTI model (Basser et al., 1994b), the DKI model (Jensen and Helpern, 2010) and the NODDI model (Zhang et al., 2012). Mean diffusivity (MD), radial diffusivity (RD), axial diffusivity (AD) and fractional anisotropy (FA) were estimated from the diffusion tensor, and the kurtosis tensor yielded mean kurtosis (MK). Estimates of neurite density index (NDI), orientation dispersion index (ODI) and the isotropic fraction (FISO) were obtained with the NODDI toolbox3. The resampled T2-weighted FLAIR images were registered to the FA image using ANTS (Friston et al., 2007; Avants et al., 2008) with diffeomorphic transformations and a pure cross correlation similarity metric. The same transformation was applied to all UBO–cNAWM pairs, which were then used as masks on the dMRI parameter maps. All parameter values in the UBO and cNAWM regions of interest were averaged, respectively. 2.3.3 Multi-exponential T2 relaxation The multi-echo data was first visually checked for motion artifacts and datasets with a blurred first echo image were discarded. The resampled T2-weighted FLAIR data were then registered with the first echo image, using the same approach as described before. This transformation was then applied on all ROIs. Next, decay curves of voxels inside each ROI were averaged and T2 relaxation distributions were calculated using a regularized non-negative least squares algorithm (Whittall and Mackay, 1989), correcting for non-ideal refocusing pulse flip angles (Prasloski et al., 2012a). Inside each ROI, the myelin water fraction (MWF) was defined as the area underneath the T2 distribution between 10 and 35 ms relative to the total area. Intra- and extracellular water fraction (IEWF) was obtained as the relative area fraction between 35 and 220 ms. The geometric mean T2 time (IEW-gmT2) was calculated as described in Whittall et al. (1997) (see Supplementary material SM1 for further information about these parameters). 2.4 Statistical analysis After obtaining average parameter values in all UBOs and cNAWM ROIs, we assessed whether the data was normally distributed. For each UBO–cNAWM pair and each parameter, an estimate of the effect size was calculated as the difference of UBO and cNAWM values divided by their mean. Next the Lilliefors test was applied on the resulting effect sizes of each parameter. As normality could not be guaranteed for all parameters, a non-parametric testing was used for further statistical analysis. For each parameter, UBO and cNAWM parameter values were therefore compared using a paired Wilcoxon signed ranks test, i.e. parameter of interest in UBO 1 vs. cNAWM 1, parameter of interest in UBO 2 vs. cNAWM 2, etc. This analysis was performed in MATLAB (MathWorks, Natick, MA) using the signrank function. Resulting p-values were then corrected for multiple comparisons, adopting a 5% false discovery rate (FDR) criterion. Corrected values were deemed significant if p < 0.05. 3 Results As can be seen from Table 2, from the 17 subjects, 30 UBO–cNAWM pairs were obtained for dMRI analysis, of which 24 also yielded sufficient MET2 data quality and were located inside the FOV of the 3D GraSE sequence. An example of the evaluated parameter maps is displayed in Fig. 2. 3.1 dMRI results Fig. 3 summarizes the results from the analysis of diffusional and kurtosis estimates. Compared to regions of cNAWM, T2-hyperintensities showed both increased AD (FDR — p = 0.0061) and RD (FDR — p = 0.0066), leading to an increase of MD (FDR — p = 0.0041). There appeared to be less anisotropy in UBOs than in cNAWM as FA was significantly decreased (FDR — p = 0.021). Furthermore, a significantly decreased MK (FDR — p = 0.0012) in UBOs compared to cNAWM was found, indicating that non-Gaussian diffusion was less present in UBOs than in cNAWM. The NODDI model resulted in reduced NDI in UBOs (FDR — p = 0.014) with no significant alterations in FISO (FDR — p = 0.51) or in ODI (FDR — p = 0.88). 3.2 Multi-exponential T2 relaxation results Fig. 4 illustrates typical T2 distributions of three UBOs and their cNAWM. Distributions for the remaining UBOs can be found in the Supplementary material SM2. Both figures illustrate the water fraction of the different water pools and the mean T2 of the IEW peak. The statistical results illustrated in Fig. 3 show that the IEW peak in UBOs appears to be shifted to longer T2 relaxation values (IEW-gmT2, FDR — p = 0.0014). MWF (FDR — p = 0.35) and IEWF (FDR — p = 0.86) did not differ significantly between UBOs and cNAWM. For clarity, the above results are summarized in Table 3. 4 Discussion To our knowledge, this was the first study to investigate non-Gaussian diffusion and multi-exponential T2 relaxation parameters in children with NF1. We demonstrated a lower MK in UBOs compared to cNAWM using DKI, and a decreased neurite density (NDI) in UBOs with unchanged neurite orientation dispersion (ODI) and isotropic fraction (FISO) using NODDI. The myelin water fraction and IEWF were also unchanged. In contrast, increased T2 relaxation values of the intra- and extracellular water (IEW-gmT2) in UBOs appeared to be the main cause of T2 hyperintensities. We also confirmed previous findings of decreased fractional anisotropy (FA) and detected increased axial, radial and mean diffusivity (AD, RD and MD, respectively) in UBOs. 4.1 Which microstructural changes may be occurring in the white matter UBOs? The myelin water fraction was not altered significantly, suggesting more or less intact myelin layers. This is in line with previous histological findings (DiPaolo et al., 1995), although differences in myelin water content in living and post-mortem tissue mean that findings from our respective studies cannot be compared equivalently. Margariti et al. (2007) hypothesized that decreased magnetization transfer ratio (MTR) in UBOs represented hypomyelination in their study of NF1 patients and healthy controls. However, decreased MTR may also relate to an increase in edema or inflammation, without demyelination (Stanisz et al., 2004; Laule et al., 2007a; Vavasour et al., 2011). Given the unaltered MWF found in the present study, our results favor a hypothesis of edema formation. Further evidence comes from our observation of prolonged IEW-gmT2. This suggests that the intra- and extracellular matrix differs substantially between UBO regions and cNAWM, which would be expected in the case of edema or inflammation (Stanisz et al., 2004). Other possible mechanisms of this prolonged IEW-gmT2 could include glial cell proliferation or reduced exchange between intra- and extracellular water. 4.2 Could UBOs be caused by intramyelinic edema? Having established a plausible hypothesis for edema, is it possible to deduce in which microstructural compartment it is arising? In intramyelinic edema vacuoles are formed in between the myelin layers due to splitting at the intraperiod line. There is some evidence from previous work and our findings that supports the presence of intramyelinic edema in UBOs. For example: prolonged T2 relaxation times have been found in a biexponential T2 relaxation study of intramyelinic edema in cats (Barnes et al., 1987) and a three-pool MET2 model of intramyelinic edema in rats (Harkins et al., 2013) also yielded a distinct long-T2 reservoir. The difference between the latter and our study is mainly that we made no assumptions about the number of water peaks to be found. Water compartments with similar but distinct T2 times may therefore be expressed as a single peak having a prolonged T2 time. In the case of intramyelinic edema, this may explain why most of our UBO samples showed prolonged T2 rather than distinct long-T2 peaks. Diffuse WM lesions of phenylketonuria (PKU) patients are thought to be expressions of hypomyelination or intramyelinic edema, depending on treatment status (Anderson and Leuzzi, 2010). Sirrs et al. found that diffuse white matter lesions observed in phenylketonuria (PKU) patients also exhibit prolonged T2 values, in the form of an additional reservoir (Sirrs et al., 2007). In addition to PKU or intramyelinic edema models, prolonged T2 values have also been observed in multiple sclerosis lesions, (Armspach et al., 1991) in which the prolongation could be linked to vacuolization, increases in the amount of extracellular water or reduced exchange between intra- and extracellular water (Laule et al., 2007b; Laule et al., 2007c). These multiple pathological mechanisms underlying prolonged T2 time complicate the interpretation of the origin of the prolonged IEW-gmT2 we find in UBOs based on MET2 alone. 4.3 Can we learn more by considering the diffusion measures? In agreement with previous studies, decreased FA and increased MD were found in UBOs compared to cNAWM, suggesting altered tissue microstructure. Elevated levels of both AD and RD reveal that the increase in MD is not related to only one or selective directions of diffusion. The elevated mean diffusivity levels are in contrast with what is found in PKU, where generally MD is lower in diffuse WM lesions than in NAWM of healthy controls (Dezortova et al., 2001; Phillips et al., 2001; Leuzzi et al., 2007; Vermathen et al., 2007). However, some authors have argued that lower MD in PKU lesions is more probably due to cytotoxic edema (Dezortova et al., 2001; Phillips et al., 2001) or accumulation of hydrophilic metabolites (Leuzzi et al., 2007). Notably, in Maple Syrup Urine Disease (MSUD) brainstem lesions with reduced ADC are observed, which is not the case in similarly located NF1 UBOs. We might expect that intramyelinic vacuoles would lead to increased diffusivity levels as we found in this study. In any case, if intramyelinic edema were to be present in NF1, PKU and MSUD lesions, there could be differences (perhaps vacuole size or presence of debris) that may be revealed using combined MET2 and dMRI methods. The DKI model additionally indicated alterations in tissue compartments displaying non-Gaussian diffusion. However, as with DTI parameters, the interpretation of kurtosis estimates in isolation is limited. The NODDI framework therefore may allow further interpretation of DTI and DKI changes by incorporating a three-compartment biophysical tissue model. Reduced NDI and unaltered ODI in UBOs suggest that the reduced FA is mainly caused by a lower neurite density (as defined by the NODDI model) and not so much by increased dispersion of neurite orientations. This could be explained by axonal loss. However, as the MWF and IEWF from MET2 analysis did not change in the UBOs in our study, axonal loss is unlikely to be the primary determinant of reduced neurite density. Rather, the decreased NDI could arise from an increased distance between axons, for example, due to edema. These observations make it difficult to conclude that intramyelinic edema is present. However, edema arising in the extracellular space is less likely. If that were the case, and given the Gaussian diffusion profile of the extracellular space, FISO would be expected to increase, which we did not observe. Intramyelinic edema therefore remains a possible hypothesis. This combined analysis illustrates the complementary nature of dMRI and MET2 when it comes to evaluating T2 hyperintensities such as UBOs. MET2 analysis alone is not able to distinguish whether an increase in IEW-gmT2 is more related to changes in the intra- or extracellular water compartment. The NODDI analysis offers an indication of disparity between intra- and extracellular compartments, based on differences in diffusional properties. On the other hand, dMRI measures are less specific to myelination than the myelin water fraction from MET2 analysis. 4.4 Methodological considerations This study benefits from the application of two advanced, novel MR based techniques, which has allowed us to investigate UBO microstructure in vivo, to a degree not previously possible using conventional imaging techniques. However, there remain a number of limitations that should be addressed. Firstly, this is a small-scale exploratory study and the findings require confirmation in a larger sample. Secondly, as with all studies employing image registration and manually defined ROIs, errors arising from these techniques cannot be ruled out. Of particular importance in this study is the issue of partial volume, where contamination from CSF may influence the results. To minimize this, we avoided delineating ROIs near to the ventricles. We also used advanced diffeomorphic registration to limit registration errors. Another issue relates to the ROI definition itself. We used the well-defined boundary on T2-weighted FLAIR to isolate the UBOs, however, it is possible that microstructural changes extend beyond this region (Mizukoshi et al., 2009). We also used cNAWM as a control region, however, it is impossible to precisely define an equivalent contralateral region, which itself may be subject to other underlying disease-related tissue changes that are not visually appreciable using the imaging method used in this study. A related issue concerns differences in the size and location of ROIs. We used an average measure from each contributing voxel within an ROI. However, the variance of these measures will be influenced by the size of the ROI delineated. As each ROI was defined by the size of the UBO, this issue was an unavoidable feature of our analysis approach. Regarding the location of the UBOs, in our interpretation we assume that all UBOs and cNAWM have the same underlying microstructure irrespective of location. However, this does not account for known variability in WM microstructure throughout the brain or potential differences between UBOs. For example, some UBOs are transient and others remain. We addressed this in part by limiting our analysis to UBOs located in WM, however, as this is a cross-sectional study, we do not know which, if any of the UBOs included for investigation will disappear over time. Rescanning the patients included in this study in the future will therefore be highly informative. Finally, although the MRI based measures utilized in this study are directly influenced by tissue microstructure, they remain indirect metrics based on simplified mathematical models and imperfect imaging techniques. While the inclusion of non-Gaussian diffusion in the DKI and the NODDI model is a major improvement over DTI, all three models assume a single dominant orientation of diffusion per voxel, which does not hold true in the majority of voxels which include healthy brain tissue (Jeurissen et al., 2013). It is also unlikely to hold true in UBOs. Directional estimates such as AD and RD should therefore be interpreted with care, as the directions they describe may not represent directions parallel and perpendicular to axons, respectively. Furthermore, NDI and ODI are designed to quantify the property of the tissue compartment contained within each voxel while eliminating the contamination from free water. An unavoidable issue arises when a voxel is predominantly free water. In such cases, the estimates of NDI and ODI, although they can still be computed numerically, are meaningless or cannot be determined accurately. To take this into account, for the analysis of NDI and ODI we only considered voxels for which FISO < 0.8. As myelin water mapping from MRI data is a relatively recent technique, the analysis is continuously evolving and there are a number of ways to obtain MWF from MET2 or from other techniques such as mcDESPOT (Deoni et al., 2008) or from T2* decay (Hwang et al., 2010; Lenz et al., 2012). These different models, data acquisition and post-processing strategies will influence the estimated MWF. For example, acquisition parameters such as ?TE or TR may influence the results. While the ?TE used in this study allows estimation of the MWF, to obtain the exact position of the myelin peak would require shorter echo spacing. It is also known that shortening TR may increase the estimation of MWF (Kalantari et al., 2013). Our study had a shorter TR compared to other studies. Although the influence on results from within-subject comparative studies like ours may be limited, this may have contributed to overestimated MWF values in our sample. Similarly, the choice of integration window used to differentiate the myelin water peak from the intracellular water peak is somewhat arbitrary within an accepted range, and this will also affect MWF estimation. To rule out the effect of integration window choice on our results (10–35 ms for myelin water and 35–220 ms for IEW) we repeated the analysis using ranges that may be found in other studies (10–40 ms, 15–35 ms, 15–40 ms for myelin water and 40–220 ms, 35–200 ms, 40–200 ms for IEW). Although the estimated MWF did change according to integration window, this did not change the outcome of the statistical analysis. Nevertheless, it is important to note that MWF gives an indication of myelin content but not an exact quantification, and there is no consensus on the optimal acquisition or post-processing strategies to apply. For these reasons, the imaging techniques used in this study will always lack the sensitivity and specificity of ex-vivo histological analysis. Nevertheless, in vivo studies like ours, although imperfect, provide data and insight that are simply not possible with histological analysis. 5 Conclusion We have presented findings from the first multi-modal MET2, DTI, DKI and NODDI study of UBOs in NF1 patients. Results suggest that the NF1 related T2 hyperintensities (UBOs) can be attributed to intracellular water obtaining extracellular-like properties, causing increased average T2 time but stable intra- and extracellular water pool fractions. The findings in this initial exploratory study support the hypothesis of intramyelinic vacuolization, in the absence of demyelination or axonal damage. Combining advanced diffusion models with multi-exponential T2 relaxation has proven useful in characterizing UBOs and therefore may be beneficial for investigating the microstructural basis of T2 hyperintensities in other pathologies and in normal ageing. Conflicts of interest The authors declare that they have no conflict of interest.