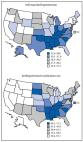
Hypertension, or high blood pressure, is a major risk factor for heart disease and stroke ( 1 ). The prevalence of hypertension is higher among men than among women, increases with age, is highest among non-Hispanic blacks (blacks) ( 2 ), and has been consistently highest in the Southeastern region of the United States ( 1 ). To update prevalence estimates for self-reported hypertension and use of antihypertensive medication, CDC analyzed data from the 2017 Behavioral Risk Factor Surveillance System (BRFSS). The overall (unadjusted) prevalence of self-reported hypertension was 32.4% (95% confidence interval [CI] = 32.1%–32.7%). The age-standardized, median state-specific prevalence of self-reported hypertension was 29.7% (range = 24.3%–38.6%). Overall age-standardized hypertension prevalence was higher among men (32.9%) than among women (27.0%), highest among blacks (40.0%), decreased with increasing levels of education and household income, and was generally highest in the Southeastern and Appalachian states.* Among persons reporting hypertension, the overall unadjusted prevalence of self-reported antihypertensive medication use was 76.0% (95% CI = 75.5%–76.4%). The age-standardized, median state-specific prevalence of antihypertensive medication use among persons with reported hypertension was 59.4% (range = 50.2%–71.2%). Prevalence was higher among women than men, highest among blacks compared with other racial/ethnic groups, and highest among states in the Southeast, Appalachia, and the Dakotas. These findings can help inform CDC’s initiatives to enhance hypertension awareness, treatment, and control across all states. BRFSS † is an annual, random-digit–dialed telephone survey (both landline and mobile phone), representative of the noninstitutionalized adult population aged ≥18 years of the 50 states, the District of Columbia (DC), and U.S. territories. In 2017, a total of 450,016 adults were interviewed. The present study includes data from the 50 states and DC; the median response rate was 45.9% (range = 30.6%–64.1%). § Respondents were classified as having hypertension if they answered “yes” to the question “Have you ever been told by a doctor, nurse, or other health professional that you have high blood pressure?” Those with borderline and pregnancy-related hypertension were categorized as “no.” Respondents reporting hypertension were classified as currently taking antihypertensive medication if they answered “yes” to the question “Are you currently taking medicine for your high blood pressure?” All analyses incorporated methods to account for the complex survey design. Application of sampling weights accounted for nonresponse, noncoverage, and mobile telephone–only households, and were derived from an iterative proportional weighting (raking) procedure. ¶ The unadjusted, age-specific, and age-standardized prevalence of self-reported hypertension and antihypertensive medication use were estimated overall, for each of the 50 states and DC, and by sociodemographic characteristics. Prevalence estimates were age-standardized to the 2000 U.S. standard population ( 3 ). Differences in prevalence across sociodemographic subgroups were tested using chi-squared tests, and differences reported were considered statistically significant for p-values <0.05. All analyses were conducted using SAS-callable SUDAAN (version 11.0.3; RTI International). During 2017, the overall unadjusted prevalence of hypertension for the 50 states and DC was 32.4% (95% CI = 32.1%–32.7%), representing an estimated 81.7 million adults (Table 1). The age-standardized median state-specific prevalence of hypertension was 29.7% (range = 24.3% [Minnesota] to 38.6% [Alabama and West Virginia]). Age-standardized hypertension prevalences were generally highest in Southeastern and Appalachian states (Figure). Age-specific hypertension prevalence increased with increasing age group (Table 2). The age-standardized prevalence of hypertension was higher among men (32.9%) than among women (27.0%), highest among blacks (40.0%), and decreased with increasing levels of education and household income. TABLE 1 Unadjusted and age-standardized* prevalence of self-reported hypertension (HTN) † and current antihypertensive medication use § among adults aged ≥18 years — Behavioral Risk Factor Surveillance System, 50 U.S. states and the District of Columbia, 2017 Area Hypertension Current antihypertensive medication use among adults with hypertension Sample with HTN Population with HTN (x 1,000)¶ % (95% CI) Sample using antihypertensive medication Population using antihypertensive medication (x 1,000)¶ % (95% CI) Unadjusted Age-standardized* Unadjusted Age-standardized* Overall 178,312 81,674 32.4 (32.1–32.7) 29.9 (29.6–30.2) 146,754 61,927 76.0 (75.5–76.4) 59.6 (58.8–60.3) State Alabama 3,435 1,582 41.9 (40.3–43.4) 38.6 (37.1–40.1) 2,954 1,281 81.1 (79.1–83.1) 70.5 (67.1–73.9) Alaska 1,245 176 31.8 (29.2–34.5) 31.8 (29.4–34.2) 875 113 64.4 (59.8–69.0) 53.0 (46.7–59.2) Arizona 6,005 1,655 30.7 (29.8–31.5) 28.0 (27.1–28.8) 4,891 1,236 74.8 (73.2–76.3) 56.0 (53.6–58.4) Arkansas 2,892 949 41.4 (39.0–43.7) 38.5 (36.1–40.8) 2,547 754 79.6 (76.5–82.8) 69.3 (64.2–74.4) California 2,854 8,647 28.4 (27.1–29.6) 27.0 (25.9–28.1) 2,060 6,141 71.1 (68.8–73.4) 53.0 (50.0–56.0) Colorado 3,189 1,130 26.0 (24.9–26.9) 24.8 (23.8–25.7) 2,395 764 69.9 (67.8–72.0) 52.7 (49.6–55.8) Connecticut 3,991 859 30.5 (29.3–31.6) 27.2 (26.1–28.3) 3,313 658 76.8 (74.8–78.9) 57.3 (54.0–60.6) Delaware 1,683 263 34.9 (32.9–36.9) 31.1 (29.2–33.0) 1,367 203 77.3 (74.2–80.4) 58.8 (53.5–64.1) District of Columbia 1,505 149 26.4 (24.8–28.1) 28.2 (26.7–29.6) 1,241 111 74.5 (71.3–77.8) 61.7 (57.3–66.0) Florida 9,360 5,810 34.6 (33.2–36.0) 29.7 (28.5–31.0) 7,568 4,496 77.5 (75.5–79.5) 58.3 (54.8–61.7) Georgia 2,520 2,624 33.1 (31.6–34.6) 31.6 (30.2–33.0) 2,153 2,042 77.9 (75.4–80.3) 62.7 (59.0–66.4) Hawaii 2,657 343 30.6 (29.2–32.0) 28.1 (26.9–29.4) 2,067 257 75.0 (72.5–77.4) 57.9 (54.3–61.5) Idaho 1,806 379 29.8 (28.1–31.5) 27.5 (26.0–29.0) 1,378 260 69.0 (65.8–72.0) 50.2 (46.2–54.2) Illinois 2,190 3,187 32.2 (30.8–33.7) 29.9 (28.5–31.3) 1,788 2,410 75.7 (73.3–78.2) 59.8 (55.4–64.1) Indiana 6,226 1,796 35.2 (34.2–36.3) 32.6 (31.7–33.6) 5,262 1,372 76.5 (74.8–78.2) 60.4 (57.8–63.0) Iowa 2,906 762 31.5 (30.3–32.6) 28.3 (27.3–29.4) 2,384 589 77.5 (75.5–79.4) 60.7 (57.4–64.0) Kansas 8,757 718 32.8 (32.0–33.5) 30.5 (29.8–31.2) 7,187 544 75.8 (74.6–77.1) 59.2 (57.3–61.2) Kentucky 4,214 1,356 39.4 (37.7–41.0) 36.1 (34.6–37.6) 3,600 1,094 80.8 (78.7–82.9) 67.5 (64.1–70.9) Louisiana 2,208 1,400 39.0 (37.3–40.7) 36.8 (35.2–38.4) 1,849 1,123 80.3 (78.0–82.5) 69.0 (65.3–72.6) Maine 3,909 376 34.8 (33.4–36.2) 29.9 (28.5–31.3) 3,117 279 74.5 (72(2–76.9) 56.5 (52.7–60.8) Maryland 5,982 1,522 32.4 (31.2–33.5) 29.8 (28.7–30.9) 5,179 1,211 79.7 (77.8–81.5) 62.6 (59.1–66.1) Massachusetts 2,475 1,564 28.6 (26.8–30.3) 25.7 (24.3–27.2) 2,053 1,220 78.1 (75.2–81.0) 59.7 (54.4–65.0) Michigan 4,397 2,697 34.7 (33.6–35.8) 31.3 (30.3–32.3) 3,625 2,067 76.7 (75.0–78.4) 59.4 (56.5–62.2) Minnesota 5,533 1,134 26.6 (25.8–27.4) 24.3 (23.5–25.0) 4,492 861 76.0 (74.3–77.6) 58.0 (55.3–60.5) Mississippi 2,621 926 40.8 (38.8–42.7) 38.2 (36.4–40.0) 2,314 750 81.0 (78.3–83.8) 71.2 (66.8–75.5) Missouri 3,133 1,513 32.0 (30.6–33.4) 29.0 (27.7–30.3) 2,671 1,204 79.7 (77.4–82.0) 64.0 (59.8–68.0) Montana 2,211 238 29.0 (27.5–30.5) 25.7 (24.2–27.1) 1,750 170 71.8 (68.8–74.7) 51.7 (47.5–56.0) Nebraska 5,895 443 30.6 (29.5–31.7) 28.2 (27.3–29.2) 4,957 348 78.6 (76.8–80.4) 61.5 (58.3–64.7) Nevada 1,471 757 32.6 (30.5–34.8) 30.0 (28.1–32.0) 1,149 548 72.5 (68.9–76.2) 55.1 (49.2–61.1) New Hampshire 2,284 324 30.0 (28.4–31.6) 25.9 (24.4–27.4) 1,915 257 79.7 (77.0–82.3) 62.2 (56.0–68.3) New Jersey 4,897 2,305 33.0 (31.6–34.4) 30.1 (28.8–31.4) 4,096 1,750 76.0 (73.7–78.4) 58.3 (54.7–62.0) New Mexico 2,496 484 30.5 (29.0–32.0) 28.0 (26.6–29.4) 1,952 353 73.2 (70.5–75.8) 57.1 (52.9–61.3) New York 4,329 4,574 29.4 (28.3–30.5) 27.1 (26.2–28.1) 3,485 3,449 75.6 (73.7–77.5) 57.4 (54.6–60.2) North Carolina 2,002 2,775 34.7 (33.0–36.5) 31.8 (30.2–33.3) 1,662 2,217 80.0 (77.6–82.5) 64.1 (59.9–68.4) North Dakota 2,813 173 29.5 (28.2–30.8) 28.2 (27.0–29.4) 2,401 135 78.2 (75.9–80.6) 63.2 (59.2–67.3) Ohio 5,394 3,130 34.7 (33.5–35.9) 31.4 (30.2–32.6) 4,618 2,433 77.9 (75.9–79.9) 61.5 (58.3–64.6) Oklahoma 3,176 1,124 37.7 (36.2–39.2) 35.4 (34.0–36.7) 2,719 874 77.8 (75.6–80.0) 64.0 (60.6–67.5) Oregon 1,835 987 30.1 (28.7–31.5) 27.2 (25.9–28.5) 1,374 699 71.0 (68.4–73.5) 53.3 (49.5–57.0) Pennsylvania 2,337 3,295 32.6 (31.1–34.1) 28.9 (27.6–30.2) 1,896 2,586 78.6 (76.4–80.9) 60.9 (56.9–64.8) Rhode Island 2,303 280 33.1 (31.4–34.8) 29.9 (28.3–31.5) 1,969 226 81.0 (78.4–83.7) 65.5 (60.3–70.6) South Carolina 5,632 1,498 38.1 (36.9–39.3) 34.4 (33.3–35.6) 4,916 1,206 80.6 (78.9–82.4) 68.5 (65.2–71.8) South Dakota 2,862 203 30.8 (28.9–32.7) 28.0 (26.2–29.7) 2,420 161 79.4 (76.3–82.5) 64.8 (59.0–70.5) Tennessee 2,638 2,012 38.7 (36.9–40.4) 35.5 (33.9–37.2) 2,210 1,580 78.6 (76.0–81.1) 65.0 (60.9–69.1) Texas 5,299 6,853 32.5 (30.8–34.2) 31.9 (30.3–33.5) 4,446 4,958 72.4 (69.4–75.3) 57.5 (53.5–61.6) Utah 3,044 534 24.5 (23.4–25.5) 25.4 (24.5–26.4) 2,224 359 67.4 (65.1–69.7) 52.3 (49.6–55.1) Vermont 2,313 153 30.4 (28.9–31.9) 26.4 (25.1–27.8) 1,804 112 73.5 (71.0–76.1) 51.7 (47.8–55.6) Virginia 3,895 2,136 32.4 (31.1–33.6) 30.3 (29.1–31.5) 3,245 1,613 75.7 (73.5–77.9) 58.3 (55.1–61.5) Washington 4,840 1,700 29.5 (28.6–30.5) 27.6 (26.6–28.5) 3,696 1,184 69.9 (68.0–71.7) 54.5 (51.9–57.2) West Virginia 2,769 631 43.5 (28.6–30.5) 38.6 (37.0–40.2) 2,380 502 79.6 (77.5–81.7) 61.7 (58.4–65.1) Wisconsin 2,143 1,387 30.8 (29.2–32.4) 27.9 (26.4–29.4) 1,743 1,041 75.4 (72.6–78.2) 57.0 (52.4–61.5) Wyoming 1,741 138 30.8 (29.2–32.4) 28.5 (27.0–30.0) 1,397 98 71.7 (68.8–74.7) 53.5 (49.4–57.6) Median — — 32.2 29.7 — — 76.7 59.4 Range — — 24.5–43.5 24.3–38.6 — — 64.4–81.1 50.2–71.2 Abbreviation: CI = confidence interval. * Age standardized to the 2000 U.S. projected population using three age groups: 18–44, 45–64, and ≥65 years. † Hypertension was defined as an affirmative response to “Have you ever been told by a doctor, nurse, or other health professional that you have high blood pressure?” Preeclampsia or borderline high or prehypertensive was categorized as “no.” § Current antihypertensive medication use was defined as affirmative response to “Are you currently taking medicine prescribed by a doctor or other health professional for your high blood pressure?” ¶ Weighted number of adults in the population with hypertension or currently using antihypertensive medication. FIGURE Age-standardized percentage of self-reported hypertension and antihypertensive medication use among adults aged ≥18 years, by state — Behavioral Risk Factor Surveillance System, United States, 2017 Abbreviation: DC = District of Columbia. The figure is two maps of the United States showing the age-standardized percentage of self-reported hypertension and antihypertensive medication use among adults aged ≥18 years, by state, using data from the Behavioral Risk Factor Surveillance System, 2017. TABLE 2 Unadjusted and age-standardized* prevalence of self-reported hypertension (HTN) † and antihypertensive medication use § among adults aged ≥18 years, by selected characteristics — Behavioral Risk Factor Surveillance System, United States, 2017 Characteristic Hypertension Antihypertensive medication use among adults with hypertension Sample with HTN Population with HTN (x 1000)¶ % (95% CI) Sample using antihypertensive medication Population using antihypertensive medication (x 1,000)¶ % (95% CI) Unadjusted Age-standardized* Unadjusted Age-standardized* Overall 178,312 81,674 32.4 (32.1–32.7) 29.9 (29.6–30.2) 146,754 61,927 76.0 (75.5–76.4) 59.6 (58.8–60.3) Age group (yrs) 18–44 18,432 16,429 14.1 (13.7–14.5) 14.1 (13.8–14.5) 7,512 6,195 37.9 (36.5–39.2) 37.9 (36.5–39.2) 45–64 66,699 34,048 40.5 (40.0–41.0) 40.5 (40.0–41.0) 53,783 27,085 79.6 (78.9–80.3) 79.6 (78.9–80.3) ≥65 93,181 31,198 60.5 (60.0–61.1) 60.5 (60.0–61.1) 85,459 28,647 92.0 (91.5–92.4) 92.0 (91.5–92.4) Sex* Men 81,648 42,260 34.5 (34.0–34.9) 32.9 (32.5–33.3) 64,010 30,136 71.5 (70.7–72.2) 56.7 (55.8–57.6) Women 96,569 39,363 30.4 (30.0–30.8) 27.0 (26.6–27.3) 82,669 31,747 80.8 (80.1–81.4) 64.0 (62.7–65.2) Race/Ethnicity* White, non-Hispanic 136,668 53,179 34.0 (33.7–34.3) 29.0 (28.7–29.3) 113,525 41,278 77.7 (77.2–78.2) 59.0 (58.1–59.9) Black, non-Hispanic 18,628 12,127 41.1 (40.1–42.1) 40.0 (39.2–40.9) 16,116 9,649 79.6 (78.3–80.9) 68.1 (66.2–70.0) Hispanic 9,081 9,510 23.9 (23.0–24.7) 28.2 (27.3–29.1) 6,359 6,133 64.8 (62.8–66.8) 54.0 (51.9–56.0) American Indian/Alaska Native, non-Hispanic 3,624 976 38.8 (36.4–41.3) 37.1 (34.7–39.5) 2,784 690 70.7 (66.7–74.7) 58.6 (53.6–63.5) Asian, non-Hispanic 2,290 2,659 19.6 (17.8–21.4) 23.8 (21.9–25.8) 1,786 1,835 69.2 (64.5–73.9) 58.0 (52.8–63.0) Native Hawaiian/Pacific Islander, non-Hispanic 316 127 26.4 (21.2–31.7) 33.0 (28.3–38.0) 200 87 68.4 (59.1–77.6) 54.9 (45.8–63.6) Multiracial, non-Hispanic 3,373 1,060 30.1 (28.3–32.0) 31.6 (29.9–33.4) 2,504 731 69.1 (65.9–72.3) 56.7 (52.8–60.6) Other, non-Hispanic 880 368 33.1 (28.8–37.3) 28.9 (25.3–32.8) 703 276 75.2 (67.9–82.5) 54.9 (45.4–64.0) Education level* Less than high school 15,316 13,232 39.1 (38.1–40.2) 35.4 (34.4–36.3) 12,605 10,020 75.9 (74.4–77.4) 58.6 (56.4–60.8) High school or equivalent 54,498 24,742 35.2 (34.6–35.7) 32.3 (31.8–32.8) 45,423 18,944 76.7 (75.9–77.6) 59.6 (58.4–60.9) More than high school 107,886 43,411 29.5 (29.2–29.9) 27.5 (27.2–27.8) 88,234 32,756 75.6 (74.9–76.2) 59.8 (58.8–60.8) Household income* <$15,000 17,836 9,145 40.7 (39.6–41.8) 37.9 (36.9–39.0) 14,384 6,889 75.5 (73.9–77.1) 61.5 (59.3–63.7) $15,000 to <$25,000 28,614 13,017 36.9 (36.1–37.7) 34.3 (33.6–35.1) 23,605 9,895 76.1 (74.9–77.4) 59.7 (57.9–61.5) $25,000 to <$35,000 17,502 7,731 35.5 (34.5–36.6) 31.9 (30.9–32.9) 14,589 5,928 76.8 (75.3–78.4) 60.4 (57.5–63.2) $35,000 to <$50,000 22,129 9,213 33.1 (32.3–34.0) 29.9 (29.1–30.7) 18,451 7,029 76.4 (75.0–77.8) 56.9 (54.9–58.8) ≥$50,000 61,667 29,012 28.2 (27.8–28.7) 26.9 (26.5–27.3) 49,890 21,529 74.3 (73.5–75.1) 59.7 (58.5–60.9) Abbreviation: CI = confidence interval. *Age standardized to the 2000 U.S. projected population using three age groups: 18–44, 45–64, and ≥65 years. † Hypertension was defined as an affirmative response to “Have you ever been told by a doctor, nurse, or other health professional that you have high blood pressure?” Preeclampsia or borderline high or pre-hypertensive was categorized as “no.” § Current antihypertensive medication use was defined as affirmative response to “Are you currently taking medicine prescribed by a doctor or other health professional for your high blood pressure?” ¶ Weighted number of adults in the population with hypertension or currently using antihypertensive medication. Among those reporting hypertension, the overall, unadjusted prevalence of antihypertensive medication use was 76.0% (95% CI = 75.5%–76.4%), representing an estimated 61.9 million adults (Table 1). The age-standardized, median, state-specific prevalence of antihypertensive medication use was 59.4% (range = 50.2% [Idaho] to 71.2% [Mississippi]). Age-standardized prevalence of antihypertensive medication use was highest in the Southeastern and Appalachian states, as well as the Dakotas (Figure). The age-specific prevalence of antihypertensive medication use also increased with increasing age (Table 2), was highest among blacks (68.1%), was higher among women (64.0%) than among men (56.7%), and did not vary by education or household income level. Discussion During 2017, approximately one third (82 million) of U.S. adults reported having hypertension, and an estimated three quarters of those with hypertension (62 million) reported using antihypertensive medication. Age-standardized prevalence of hypertension varied widely by state, remaining highest in the Southeast and among men and blacks. Age-standardized prevalence of antihypertensive medication use also increased with increasing age, was highest among blacks, and was higher among women than among men. The overall age-standardized self-reported hypertension prevalence of 29.9% was similar to that reported based on 2011–2015 BRFSS data (29.8%) ( 1 ) and measured hypertension prevalence of 29% based on data from the 2015–2016 National Health and Nutrition Examination Survey ( 2 ). Also consistent with other reports, hypertension prevalence decreased with increasing income ( 4 ) and education level ( 1 ) and was highest in Southeastern and Appalachian states ( 1 , 2 ). The overall, age-standardized prevalence of antihypertensive medication use (59.6%) was also similar to estimates from the 2011–2015 BRFSS, ranging from 63.0% in 2011 to 61.8% in 2015 ( 1 ). Like hypertension prevalence, medication use prevalence was highest in Southeastern and Appalachian states. In the present study, prevalence of medication use was also highest in the Dakotas, despite a midrange prevalence of hypertension in these states. Prevalence of antihypertensive medication use was higher in older age groups, highest among blacks, and higher among women than men. This overall gender difference has been reported previously ( 1 ), but the reasons are unclear. Data from Medicare Part D beneficiaries aged ≥65 years suggest that antihypertensive medication nonadherence is similar for men (25.8%) and women (26.7%) ( 5 ). More information is needed to examine the relationship between the prevalence of self-reported hypertension and that of antihypertensive medication use. The findings in this report are subject to at least three limitations. First, data were self-reported. The lack of documented diagnosis of hypertension based on historic blood pressure measurements does not allow for precise assessment of hypertension; however, the results were similar to data from previous reports based on both self-report ( 1 ) and measured hypertension ( 2 ). Second, low median response rates across states might limit the representativeness of the 2017 BRFSS sample and potentially result in either under- or overestimates of prevalence, although application of sampling weights is likely to reduce some nonresponse bias. Finally, findings are representative of noninstitutionalized civilian persons only and would exclude those living in nursing homes, prisons, and other institutions. This report provides the most recent state-level surveillance data on prevalence of self-reported hypertension and antihypertensive medication use among persons reporting hypertension. Hypertension prevention and control is a priority of CDC’s state and local funding for heart disease and stroke prevention** and one of the important elements of the Million Hearts initiative ( 6 ). CDC has been working closely with states to enhance hypertension management through a strategy of team-based care in which two or more health care providers work collaboratively with each patient. These teams may include doctors, nurses, pharmacists, dietitians, community health workers, and other health care providers. This approach is often multidisciplinary with a team working to educate patients, identify risk factors, provide treatments, and sustain ongoing conversations with patients. This strategy can result in multiple opportunities for intervention for better blood pressure control ( 7 ), †† with the ultimate goal of reducing disparities in hypertension awareness, treatment, and control across the United States. Summary What is already known about this topic? Prevalence of hypertension increases with increasing age and is higher among men than women and among non-Hispanic blacks than among other racial/ethnic groups; prevalence has been consistently higher in the Southeastern and Appalachian regions of the United States. What is added by this report? Analysis of 2017 Behavioral Risk Factor Surveillance System data found that approximately one third of U.S. adults reported having hypertension, and an estimated 75% of those reporting having hypertension reported using antihypertensive medication. The prevalence of these factors varied widely by state and was generally highest in the Southeastern and Appalachian states. What are the implications for public health practice? A multidisciplinary team-based strategy working to educate patients, maintain dialogue over time, and identify risk factors can provide intervention opportunities for better blood pressure control and could reduce disparities in hypertension awareness, treatment, and control across the United States.