9
views
0
recommends
+1 Recommend
1 collections
    0
    shares
      • Record: found
      • Abstract: found
      • Article: found
      Is Open Access

      Differences in the upslope of the precordial body surface ECG T wave reflect right to left dispersion of repolarization in the intact human heart

      research-article

      Read this article at

      ScienceOpenPublisherPMC
      Bookmark
          There is no author summary for this article yet. Authors can add summaries to their articles on ScienceOpen to make them more accessible to a non-specialist audience.

          Abstract

          Background

          The relationship between the surface electrocardiogram (ECG) T wave to intracardiac repolarization is poorly understood.

          Objective

          The purpose of this study was to examine the association between intracardiac ventricular repolarization and the T wave on the body surface ECG (SECG TW).

          Methods

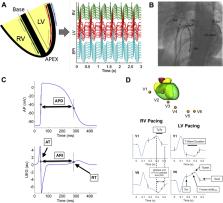
          Ten patients with a normal heart (age 35 ± 15 years; 6 men) were studied. Decapolar electrophysiological catheters were placed in the right ventricle (RV) and lateral left ventricle (LV) to record in an apicobasal orientation and in the lateral LV branch of the coronary sinus (CS) for transmural recording. Each catheter (CS, LV, RV) was sequentially paced using an S1–S2 restitution protocol. Intracardiac repolarization time and apicobasal, RV–LV, and transmural repolarization dispersion were correlated with the SECG TW, and a total of 23,946 T waves analyzed.

          Results

          RV endocardial repolarization occurred on the upslope of lead V 1, V 2, and V 3 SECG TW, with sensitivity of 0.89, 0.91, and 0.84 and specificity of 0.67, 0.68, and 0.65, respectively. LV basal endocardial, epicardial, and mid-endocardial repolarization occurred on the upslope of leads V 6 and I, with sensitivity of 0.79 and 0.8 and specificity of 0.66 and 0.67, respectively. Differences between the end of the upslope in V 1, V 2, and V 3 vs V 6 strongly correlated with right to left dispersion of repolarization (intraclass correlation coefficient 0.81, 0.83, and 0.85, respectively; P <.001). Poor association between the T wave and apicobasal and transmural dispersion of repolarization was seen.

          Conclusion

          The precordial SECG TW reflects regional repolarization differences between right and left heart. These findings have important implications for accurately identifying biomarkers of arrhythmogenic risk in disease.

          Related collections

          Most cited references14

          • Record: found
          • Abstract: found
          • Article: not found

          Prolonged Tpeak-to-tend interval on the resting ECG is associated with increased risk of sudden cardiac death.

          Early studies indicate that prolongation of the interval between the peak and the end of the T wave (Tpeak to Tend [TpTe]) on the 12-lead ECG is a marker of ventricular arrhythmogenesis. However, community-based studies have not been conducted. TpTe and other ECG predictors were evaluated in the ongoing Oregon Sudden Unexpected Death Study based in the Portland, Oregon, metropolitan area using a case-control design. Cases of sudden cardiac death (SCD) (n = 353; mean age, 66.6 years; 95% CI, 65.1 to 68.1 years; 67% men) were compared with living controls with coronary artery disease (n = 342; mean age, 64.7 years; 95% CI, 63.4 to 66.0 years; 69% men) from the same region. Analysis of TpTe and selected ECG intervals was limited to sinus rhythm 12-lead ECGs. For cases, these were obtained before and unrelated to SCD. Independent-samples t tests and multiple logistic regression were used. Mean TpTe was significantly greater in cases (89.4 ms; 95% CI, 87.7 to 91.2 ms; P < 0.0001) than in controls (76.1 ms; 95% CI, 74.8 to 77.4 ms). The other ECG intervals (corrected QT interval [QTc], QRS duration [QRSD], and TpTe/QT ratio) also were significantly prolonged among cases versus controls (P ≤ 0.01). TpTe remained a significant predictor of SCD after adjusting for age, sex, QTc, QRSD, and left ventricular function. Odds of SCD increased more with a 1-SD increase in TpTe (12 ms) among subjects with prolonged QRSD (odds ratio, 3.49; 95% CI, 2.06 to 5.91) than with a 1-SD increase in TpTe among subjects with normal QRSD (odds ratio, 1.96; 95% CI, 1.65 to 2.32). TpTe remained significantly associated with SCD in subjects with normal QTc. Prolongation of the TpTe interval measured in lead V5 was independently associated with SCD, with particular utility when the QTc was normal or not measurable because of prolonged QRSD.
            Bookmark
            • Record: found
            • Abstract: found
            • Article: not found

            Dispersion of repolarization in canine ventricle and the electrocardiographic T wave: Tp-e interval does not reflect transmural dispersion.

            The concept that the interval between the peak (T(peak)) and the end (T(end)) of the T wave (T(p-e)) is a measure of transmural dispersion of repolarization time is widely accepted but has not been tested rigorously by transmural mapping of the intact heart. The purpose of this study was to test the relationship of T(p-e) to transmural dispersion of repolarization by correlating local repolarization times at endocardial, midmural, and epicardial sites in the left and right ventricles with the T wave of the ECG. Local activation times, activation-recovery intervals, and repolarization times were measured at 98 epicardial sites and up to 120 midmural and endocardial sites in eight open-chest dogs. In four of the dogs, long-term cardiac memory was induced by 3 weeks of ventricular pacing at 130 bpm because previous data suggest that, in this setting, delayed epicardial repolarization increases transmural dispersion. The other four dogs were sham operated. In sham dogs, T(p-e) was 41 +/- 2.2 ms (X +/- SEM), whereas the transmural dispersion of repolarization time was 2.7 +/- 4.2 ms (not significant between endocardium and epicardium). Cardiac memory was associated with evolution of a transmural gradient of 14.5 +/- 1.9 ms (P <.02), with epicardium repolarizing later than endocardium. The corresponding T(p-e) was 43 +/- 2.3 ms (not different from sham). In combined sham and memory dogs, T(p-e) intervals did not correlate with transmural dispersion of repolarization times. In contrast, dispersion of repolarization of the whole heart (measured as the difference between the earliest and the latest moment of repolarization from all left and right ventricular, endocardial, intramural, and epicardial recording sites) did correlate with T(p-e) (P <.0005, r = 0.98), although the latter underestimated total repolarization time by approximately 35%. The explanation for this finding is that parts of the heart fully repolarize before the moment of T(peak). T(p-e) does not correlate with transmural dispersion of repolarization but is an index of total dispersion of repolarization.
              Bookmark
              • Record: found
              • Abstract: found
              • Article: not found

              Validation of a simple model for the morphology of the T wave in unipolar electrograms.

              Local unipolar electrograms (UEGs) permit assessment of local activation and repolarization times at multiple sites simultaneously. However, UEG-based indexes of local repolarization are still debated, in particular for positive T waves. Previous experimental and computer modeling studies have not been able to terminate the debate. In this study we validate a simple theoretical model of the UEG and use it to explain how repolarization statistics in the UEG relate to those in the action potential. The model reconstructs the UEG by taking the difference between an inverted local action potential and a position-independent remote signal. In normal tissue, this extremely simple model predicts T-wave morphology with surprising accuracy while explaining in a readily understandable way why the instant of repolarization is always related to the steepest upstroke of the UEG, both in positive and negative T waves, and why positive T waves are related to early repolarizing sites, whereas negative T waves are related to late repolarizing sites.
                Bookmark

                Author and article information

                Contributors
                Journal
                Heart Rhythm
                Heart Rhythm
                Heart Rhythm
                Elsevier
                1547-5271
                1556-3871
                1 June 2019
                June 2019
                : 16
                : 6
                : 943-951
                Affiliations
                []Department of Cardiac Electrophysiology, The Barts Heart Center, St Bartholomew’s Hospital, London, United Kingdom
                []Institute of Cardiovascular Science, University College London, London, United Kingdom
                []Department of Mechanical Engineering, University College London, London, United Kingdom
                Author notes
                [] Address reprint requests and correspondence: Dr Pier D. Lambiase, Department of Cardiac Electrophysiology, Barts Heart Centre, St Bartholomew’s Hospital, West Smithfield, London EC1A 7BE, United Kingdom. p.lambiase@ 123456ucl.ac.uk
                Article
                S1547-5271(18)31261-X
                10.1016/j.hrthm.2018.12.006
                6546969
                30550836
                9dce3e1d-5639-4704-908a-109b76afcb2c
                © 2018 The Authors

                This is an open access article under the CC BY license (http://creativecommons.org/licenses/by/4.0/).

                History
                Categories
                Article

                Cardiovascular Medicine
                body surface electrocardiogram,dispersion of repolarization,surface electrocardiogram,tpeak-tend,t wave,t-wave genesis,ventricular repolarization

                Comments

                Comment on this article