- Record: found
- Abstract: found
- Article: found
Driving pressure: a marker of severity, a safety limit, or a goal for mechanical ventilation?
research-article
Read this article at
There is no author summary for this article yet. Authors can add summaries to their articles on ScienceOpen to make them more accessible to a non-specialist audience.
Abstract
Current guidelines for lung-protective ventilation in patients with acute respiratory
distress syndrome (ARDS) suggest the use of low tidal volumes (Vt), set according
to ideal body weight (IBW) of the patient [1], and higher levels of positive end-expiratory
pressure (PEEP) to limit ventilator-induced lung injury (VILI) [2, 3]. However, recent
studies have shown that ARDS patients who are ventilated according to these guidelines
may still be exposed to forces that can induce or aggravate lung injury [4–6].
Airway driving pressure has received considerable attention after a publication by
Amato et al. [7] of a complex and innovative statistical analysis of key randomized
clinical trials that tested ventilatory settings in patients with ARDS. The analysis
showed that driving pressure, as opposed to Vt and PEEP, was the variable that best
correlated with survival in patients with ARDS [7]. Since this article, several authors
have replicated this hypothesis in different clinical scenarios, to the point of suggesting
that driving pressure may be a goal in itself [8].
In this Viewpoint, we review the physiological meaning of driving pressure, look at
the current clinical evidence, and discuss the role of driving pressure when setting
the ventilator, considering it more as a safety limit than an objective by itself.
This discussion is restricted to patients undergoing controlled mechanical ventilation
and without spontaneous breathing efforts. During spontaneous ventilation measurements
of driving pressure will underestimate the real distending pressure of the respiratory
system and it can, therefore, be misleading [9].
Back to basics: what does driving pressure represent?
After the description of the baby lung concept [10], which revealed a physiologically
small lungs in patients with ARDS, several studies in the 1990s tested the hypothesis
that limiting Vt or airway pressures during mechanical ventilation might improve the
outcome of these patients. In a pioneering single center study, Amato et al. were
the first to show a reduction in mortality in this setting using a strategy based
on maintaining low inspiratory driving pressures (lower than 20 cmH2O) along low Vt
and high PEEP levels [11]. Shortly after, the large multicenter ARDSnet trial showed
a decrease in mortality by nearly 25% in more than 800 patients with ARDS when using
6, instead of 12 mL/kg, IBW, confirming that Vt limitation is a fundamental strategy
to improve survival of patients with ARDS [1].
However, some controversy was generated about the best way to titrate Vt: IBW, body
surface area, lung size, airway pressures, etc. Going further back, the rationale
of limiting Vt emerged from the description of the concept of baby lung, which tells
us that in ARDS we are facing physiologically small lungs, and not rigid lungs as
previously thought [10]. In Gattinoni et al.’s original study, while oxygenation and
shunt were correlated with non-aerated tissue, static lung compliance was strongly
correlated with the residual aerated lung volume [12], the volume of the baby lung.
With that being said, driving pressure (DP) is the difference between the airway pressure
at the end of inspiration (plateau pressure, Ppl) and PEEP [7, 13]. In turn, static
compliance of the respiratory system (CRS) is the quotient between Vt and driving
pressure. Ergo, by simple arithmetic, driving pressure is the quotient between the
Vt and CRS of the patient:
\documentclass[12pt]{minimal}
\usepackage{amsmath}
\usepackage{wasysym}
\usepackage{amsfonts}
\usepackage{amssymb}
\usepackage{amsbsy}
\usepackage{mathrsfs}
\usepackage{upgreek}
\setlength{\oddsidemargin}{-69pt}
\begin{document}$$ \begin{array}{l}\mathrm{DP}={\mathrm{P}}_{\mathrm{pl}}-\mathrm{PEEP}\\
{}{\mathrm{C}}_{\mathrm{RS}}=\frac{\mathrm{Vt}}{{\mathrm{P}}_{\mathrm{pl}}-\mathrm{PEEP}}=\frac{\mathrm{Vt}}{\mathrm{DP}}\\
{}\mathrm{DP}=\frac{\mathrm{Vt}}{{\mathrm{C}}_{\mathrm{RS}}}\end{array} $$\end{document}
D
P
=
P
pl
−
PEEP
C
R
S
=
V
t
P
pl
−
PEEP
=
V
t
D
P
D
P
=
V
t
C
R
S
Thus, driving pressure represents the Vt corrected for the patient’s CRS, and using
driving pressure as a safety limit may be a better way to adjust Vt in order to decrease
cyclic or dynamic strain during mechanical ventilation.
Despite the fact that no study has prospectively tested the relationship between driving
pressure and Vt, some scattered physiological data indicate it exists. In nine patients
with ARDS, we applied both ventilatory strategies from the original ARDSnet study,
6 and 12 mL/kg IBW, at a constant PEEP (9 cm H2O), and minute ventilation. The use
of lower Vt decreased airway driving pressure (11.6 ± 2.2 versus 22.7 ± 5.4, p < 0.01)
and driving transpulmonary pressure (8.1 ± 2.2 versus 16.8 ± 6.0, p < 0.01) (Fig. 1),
as well as cyclic recruitment-derecruitment and tidal hyperinflation [14]. Needless
to say, Vt limitation decreased all the physical mechanisms involved in the genesis
of VILI.
Fig. 1
Airway (P
ao
) and esophageal (P
eso
) pressures in a patient with pneumonia and ARDS under volume-controlled ventilation
with Vt 6 (left) and Vt 12 (right) mL/kg IBW and similar PEEP. Transpulmonary driving
pressure (shown as gray bars) is the difference between airway driving pressure (DP,
solid arrows) and esophageal driving pressure (DP
eso
, dotted arrows). Both airway DP and transpulmonary DP increased when using a higher
Vt. Modified from [11]
Transpulmonary driving pressure (the difference between airway plateau minus PEEP
pressure and esophageal plateau minus end-expiratory esophageal pressure), when taking
into account the chest wall elastance, could better reflect lung stress and be the
safest way to titrate mechanical ventilation (Fig. 2) [13, 15, 16]. In this context,
Chiumello et al. [13] conducted a retrospective analysis of 150 deeply sedated, paralyzed
patients with ARDS enrolled in previous studies, in which a PEEP trial of 5 and 15
cm H2O was performed at constant Vt and respiratory rate. At both PEEP levels, the
higher airway driving pressure group had a significantly higher lung stress, respiratory
system, and lung elastance compared to the lower airway driving pressure group. More
importantly, airway driving pressure was significantly related to lung stress (transpulmonary
pressure), and driving pressure higher than 15 cm H2O and transpulmonary driving pressure
higher than 11.7 cm H2O, both measured at PEEP 15 cm H2O, were associated with dangerous
levels of stress.
Fig. 2
Airway (black line) and esophageal (gray line) pressure in an experimental model of
abdominal hypertension secondary to pneumoperitoneum in pigs (data not published).
During volume-controlled ventilation (Vt 10 mL/kg and PEEP 5 cm H2O), increases in
intra abdominal pressure (IAP) from 5 (left) to 15 (middle) and 25 cm H2O (right)
induced an increase in plateau pressure and driving pressure. However, driving transpulmonary
pressure (arrows) remained constant
Differences between transpulmonary driving pressure and airway driving pressure are
mainly due to increases in chest wall elastance [15, 17]. Airway driving pressure
may vary from minimal differences (skinny patient, pneumonia) to a large overestimation
(morbid obesity, abdominal hypertension) of transpulmonary driving pressure. However,
in the patient without spontaneous ventilatory activity, transpulmonary driving pressure
will always be lower than airway driving pressure [13].
In summary, driving pressure during mechanical ventilation is directly related to
stress forces in the lung. Sizing Vt in proportion to the size of the baby lung by
targeting driving pressure, rather than to IBW, might better protect the lungs in
patients with more severe lung injury and low end-expiratory lung volumes [8, 13].
What is the current clinical evidence?
Evidence relating driving pressure to outcomes
The association between driving pressure and outcomes was first described in 2002
[18]. In a prospective observational cohort of 235 patients with ARDS, Estenssoro
et al. showed that driving pressure during the first week consistently discriminated
between survivors and non-survivors, along with other variables, such as PaO2:FiO2
ratio and SOFA scores.
More than a decade later, the best evidence came from Amato et al. with the meta-analysis
of nine prospective trials involving more than 3500 patients that showed that driving
pressure was the physical variable that best correlated with survival in patients
with ARDS [7]. More importantly, this association existed even though all the ventilator
settings were lung-protective (plateau pressures ≤30 cm H2O and Vt ≤7 mL/kg IBW).
After the report by Amato, several authors confirmed the association of driving pressure
with survival in patients with ARDS. In 56 ARDS patients from the EPVent trial [16],
which tested the use of esophageal manometry in patients with ARDS, Baedorf Kassis
et al. [19] found that utilizing PEEP titration to target positive transpulmonary
pressures results in both improved elastance and driving pressures. The authors suggest
that ventilation strategies leading to decreased driving pressure and elastance could
be associated with improved survival.
In another secondary analysis of patients enrolled in two randomized controlled trials
in ARDS patients, Acurasys [20] and Proseva [21], driving pressure was a risk factor
for death, along with plateau pressure and CRS [22]. More recently, in nearly 800
patients with moderate to severe ARDS managed with lung-protective ventilation, plateau
pressure was slightly better than driving pressure in predicting hospital death [23].
The authors identified plateau and driving pressure cut-off values of 29 and 19 cm
H2O, respectively, above which the risk of death increased.
Ultra-protective ventilation with extracorporeal lung support may help protect the
lungs by decreasing Vt along driving pressure [24]. In a recent meta-analysis from
nine studies, including more than 500 patients receiving extracorporeal membrane oxygenation
(ECMO) for refractory hypoxemia, Serpa Neto et al. [25] showed that driving pressure
during the first 3 days in ECMO had an independent association with in-hospital mortality.
Although ECMO support allowed decreasing Vt to 4 mL/kg IBW and driving pressure in
nearly 4 cm H2O, non-survivors still showed a higher driving pressure during ECMO
(14.5 ± 6.2 versus 13.3 ± 4.8 cm H2O in survivors, p = 0.048).
In the largest observational study in nearly 2400 patients with ARDS, driving pressure
of more than 14 cm H2O (and not Vt) was associated with an increased risk of hospital
mortality in patients with moderate and severe ARDS [26]. The interesting data from
this study indicates that there is still a significant potential for improvement by
correcting modifiable factors associated with increased mortality, including driving
pressure [27].
Evidence relating driving pressure to pathophysiologic alterations
One of the problems when setting ventilation in ARDS patients is right ventricle (RV)
overload, which relates to lung derecruitment and overdistension and has also been
reported to be independently associated with a poor prognosis [28]. In a prospective
observational study in 226 patients with moderate to severe ARDS ventilated with plateau
pressures limited to 30 cmH2O and assessed with transesophageal echocardiography,
cor pulmonale was detected in 49 patients (22%); higher driving pressures were an
independent factor associated with cor pulmonale [29]. More recently, a driving pressure
≥18 cm H2O, a PaO2:FiO2 ratio <150 mmHg, and a PaCO2 ≥ 48 mmHg have been reported
to promote RV failure in patients with ARDScaused by pneumonia [30].
There are also reports that describe the association of driving pressure with diaphragmatic
function. In 107 patients on mechanical ventilation, Goligher et al. found an association
between higher driving pressure and the decrease in thickness and contractile activity
measured by ultrasound [8].
Evidence relating modifications in driving pressure with outcome
Despite all the above evidence associating driving pressure with clinical and physiologic
outcomes, no study to date has evaluated driving pressure as a primary goal during
ventilatory setting in patients with ARDS. However, a few studies have analyzed the
individual impact of specific interventions on driving pressure, and have related
these changes to outcome.
In a recent prospective study in 200 patients with ARDS, Kacmarek et al. [3] showed
that an open lung approach strategy (recruitment maneuver followed by a downward titration
of PEEP), versus a more conservative PEEP strategy, improved oxygenation and decreased
driving pressure, but without significant differences in survival.
In the surgical setting, a recent meta-analysis involving 17 clinical studies and
2250 patients showed that changes in the level of PEEP that resulted in an increase
in driving pressure were associated with more postoperative pulmonary complications
[31].
In the metanalysis of Amato et al. [7], when analyzing modifications to driving pressure
which occurred as a result of specific changes in tidal volume or PEEP applied after
randomization, those changes that led to a decrease in driving pressure were associated
with a greater survival.
Although this evidence is rather weak to support a firm recommendation to target driving
pressure as a primary goal in mechanically ventilated patients, we believe they constitute
a promising basis for a future trial. In addition, they provide a clue for clinicians
about how they might apply this new concept into clinical practice, while we await
further evidence.
Clinical use of driving pressure
Let’s compare theoretically two patients of similar age and phenotype with community
acquired pneumonia and severe hypoxemia who are ventilated with the same level of
Vt (6 mL/kg IBW) and PEEP (10 cm H2O). After an end-inspiratory occlusion maneuver,
one patient has a plateau pressure of 22 cm H2O (driving pressure 12 cm H2O), while
the other patient has 30 cm H2O (driving pressure 20 cm H2O). Clearly, the second
patient has a lower CRS, and probably a worse prognosis. In this patient, after decreasing
the Vt to 5 mL/kg and a PEEP titration to 14 cm H2O, plateau pressure drops down to
26 cm H2O. Will these two patients now, after achieving the same driving pressure
of 12 cm H2O, have the same prognosis? Logic tends to suggest that this is not the
case, as the patient with a higher severity of disease will require more adjunctive
therapies, such as prone and neuromuscular blockade, but may still have a worse outcome.
As discussed, a high driving pressure is strongly associated with higher mortality.
However, safe limits of driving pressure have not been identified and the suggested
cutoffs vary from 14 to 18 cm H2O [26, 30]. In clinical studies comparing high versus
low Vt ventilation in patients with ARDS, conventional non-protective strategies resulted
in driving pressure greater than 20 cm HO, while protective ones were usually below
15–16 cm H2O. In contrast, in studies comparing high versus low PEEP, in which all
groups limit Vt, mean driving pressures were well below 15 cm H2O (Table 1).
Table 1
Ventilatory parameters at 24 h and mortality in clinical studies comparing a protective
strategy (Vt limitation) versus a control group (top panel), and a strategy of high
PEEP versus low PEEP or minimal distension (lower panel) in patients with ARDS
Author
Year
N
Vt
Ppl
PEEP
DP
Mort
Vt
Ppl
PEEP
DP
Mort
Dif DP
p
b
Protective strategy
Control group
Brochard
1998
108
7.1
25.7
10.7
15
46.6%
10.3
31.7
10.7
21
37.9%
6
NS
Stewart
1998
120
7.2
22.3
8.6
13.7
48.0%
10.8
26.8
7.2
19.6
46.0%
5.9
NS
Ranieria
1999
44
7.6
24.6
14.8a
9.8
38.0%
11.1
31
6.5
24.5
58.0%
14.7
0.19
Brower
1999
52
7.3
27
9.3
17.7
50.0%
10.2
30
8.2
21.8
46.0%
4.1
NS
Amatoa
1998
53
6
31.8
16.3a
15.5
38.0%
12
34.4
6.9
27.5
71.0%
12
<0.001
ARDSnet
2000
861
6.1
25
9.4
15.6
31.0%
11.9
33
8.6
24.4
39.8%
8.8
0.007
High PEEP
Low PEEP
ALVEOLI
2004
549
6.1
27
14.7
12.3
27.5%
6.0
24
9.1
14.9
24.9%
2.6
NS
Mercat
2008
767
6.1
27.5
15.8
11.7
35.4%
6.1
21.1
8.4
12.7
39.0%
1.0
NS
Meade
2008
983
6.8
30.2
15.6
14.6
36.4%
6.8
24.9
10.1
14.8
40.4%
0.2
NS
Talmorc
2008
61
7.1
28
17
11
17%
6.8
25
10
15
39%
4.0
0.055
Kacmarek
2016
200
5.6
27.9
15.8
11.8
22%
6.2
25.2
11.6
13.8
27%
2.0
0.18
Driving pressure of the respiratory system (DP) is calculated as the difference between
the plateau pressure (P
pl
) and PEEP. Note that a larger difference in DP between groups (Dif DP) is associated
with differences in mortality
a Ranieri [37] and Amato [11] studies also use high PEEP in the protective strategy
b The p value refers to the differences in mortality (Mort) between groups
c Ventilatory parameters at 72 h
In the absence of prospective studies using driving pressure as a goal when setting
the ventilator, we suggest that driving pressure should be used as a complement to,
and not as a substitute for, Vt. Accordingly, we should maintain a Vt target of 6
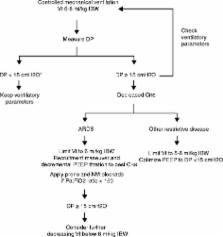
to 8 mL/kg IBW, and then control its safety according to driving pressure (Fig. 3).
Although there is insufficient evidence to suggest a specific cutoff value for driving
pressure, we propose 15 cm H2O, not as a target, but as a safety limit. Probably most
of the patients without ARDS will present a driving pressure below 10 cm H2O, reflecting
a normal or near normal CRS [31]. In contrast, in patients with moderate to severe
ARDS or other restrictive diseases (pulmonary edema, large pleural effusions, interstitial
disease, fibrosis, etc.), a driving pressure above 10 will be common, and it may reflect
either a diminished CRS or an inappropriate Vt/PEEP setting.
Fig. 3
Suggested flowchart for adjusting ventilatory parameters according to driving pressure
in patients requiring invasive mechanical ventilation. *The limit of 15 cm H2O is
only speculative as no safe limit for driving pressure has been identified (see text).
Abbreviations: Vt tidal volume, IBW ideal body weight, DP airway driving pressure,
C
RS
static compliance of the respiratory system, NM neuromuscular, PaO2:FiO2 ratio ratio
of the partial pressure of arterial oxygen to the fraction of inspired oxygen
Driving pressure may be a valuable tool to set PEEP. Independent of the strategy used
to titrate PEEP, changes in PEEP levels should consider the impact on driving pressure,
besides other variables such as gas exchange and hemodynamics [3, 32, 33]. A decrease
in driving pressure after increasing PEEP will necessarily reflect recruitment and
a decrease in cyclic strain. On the contrary, an increase in driving pressure will
suggest a non-recruitable lung, in which overdistension prevails over recruitment
[34]. If after optimizing PEEP driving pressure remains above 15 cm H2O, we suggest
further decreasing Vt below 6 mL/kg IBW (Fig. 3) [24]. In addition, an esophageal
catheter may be considered to measure transpulmonary driving pressures.
Conclusions
Airway driving pressure is the difference between plateau pressure and PEEP and represents
the cyclic strain to which the lung parenchyma is subjected during each ventilatory
cycle. It is a physiological way of adjusting Vt to the residual lung size (respiratory
system compliance) of the patient, correlates directly with transpulmonary pressure,
and is associated with survival in patients with ARDS [7]. Thus, setting ventilatory
parameters to decrease driving pressure may have a role in improving outcomes in patients
requiring mechanical ventilation.
However, driving pressure is only one of many variables involved in the mechanical
power or energy applied to the lung parenchyma. Vt, flow, and respiratory rate have
also been identified as causes of VILI [35, 36]. Further research will need to explore
how all these factors behave in a particular patient.
In the meantime, we suggest adjusting ventilatory support with traditional protective
parameters, Vt 6–8 mL/kg IBW and moderate PEEP levels, and adjusting them according
to driving pressure, which should ideally be below 15 cm H2O, although this limit
should be tested in future trials.
Related collections
Most cited references24
- Record: found
- Abstract: found
- Article: not found
Effect of a protective-ventilation strategy on mortality in the acute respiratory distress syndrome.
M. B. P. Amato, C Barbas, D M Medeiros … (1998)
- Record: found
- Abstract: found
- Article: not found
Tidal hyperinflation during low tidal volume ventilation in acute respiratory distress syndrome.
Pier Paolo Terragni, Giulio Rosboch, Andrea Tealdi … (2007)
- Record: found
- Abstract: found
- Article: not found
The concept of "baby lung".
Luciano Gattinoni, Antonio Pesenti (2005)