- Record: found
- Abstract: found
- Article: found
Provisional Mortality Data — United States, 2020
research-article
Farida B. Ahmad , MPH
1
,
,
Jodi A. Cisewski , MPH
1 ,
Arialdi Miniño , MPH
1 ,
Robert N. Anderson , PhD
1
09 April 2021
Read this article at
There is no author summary for this article yet. Authors can add summaries to their articles on ScienceOpen to make them more accessible to a non-specialist audience.
Abstract
CDC’s National Vital Statistics System (NVSS) collects and reports annual mortality
statistics using data from U.S. death certificates. Because of the time needed to
investigate certain causes of death and to process and review data, final annual mortality
data for a given year are typically released 11 months after the end of the calendar
year. Daily totals reported by CDC COVID-19 case surveillance are timely but can underestimate
numbers of deaths because of incomplete or delayed reporting. As a result of improvements
in timeliness and the pressing need for updated, quality data during the global COVID-19
pandemic, NVSS expanded provisional data releases to produce near real-time U.S. mortality
data.* This report presents an overview of provisional U.S. mortality data for 2020,
including the first ranking of leading causes of death. In 2020, approximately 3,358,814
deaths
†
occurred in the United States. From 2019 to 2020, the estimated age-adjusted death
rate increased by 15.9%, from 715.2 to 828.7 deaths per 100,000 population. COVID-19
was reported as the underlying cause of death or a contributing cause of death for
an estimated 377,883 (11.3%) of those deaths (91.5 deaths per 100,000). The highest
age-adjusted death rates by age, race/ethnicity, and sex occurred among adults aged
≥85 years, non-Hispanic Black or African American (Black) and non-Hispanic American
Indian or Alaska Native (AI/AN) persons, and males. COVID-19 death rates were highest
among adults aged ≥85 years, AI/AN and Hispanic persons, and males. COVID-19 was the
third leading cause of death in 2020, after heart disease and cancer. Provisional
death estimates provide an early indication of shifts in mortality trends and can
guide public health policies and interventions aimed at reducing numbers of deaths
that are directly or indirectly associated with the COVID-19 pandemic.
CDC analyzed provisional NVSS death certificate data for deaths occurring among U.S.
residents in the United States during January–December 2020. The numbers and rates
of overall deaths and COVID-19 deaths were assessed by age, sex, and race/ethnicity
(categorized as Hispanic, non-Hispanic White [White], Black, non-Hispanic Asian, non-Hispanic
AI/AN, non-Hispanic Native Hawaiian or other Pacific Islander [NH/PI], non-Hispanic
multiracial, and unknown). Causes of death were coded according to the International
Classification of Diseases, Tenth Revision (ICD-10), which describes disease classification
and the designation of underlying cause of death (
1
,
2
). Numbers and rates of COVID-19 deaths include deaths for which COVID-19 was listed
on the death certificate as a confirmed or presumed underlying cause of death or contributing
cause of death (ICD-10 code U07.1). COVID-19 was the underlying cause of approximately
91% (345,323) of COVID-19–associated deaths during 2020 (
3
). Leading underlying causes of death were calculated and ranked (
4
). Deaths that occurred in the United States among residents of U.S. territories and
foreign countries were excluded.
§
Age was unknown for 86 (<0.01%) decedents, and race/ethnicity was unknown for 9,135
(0.27%). There were no records with unknown sex. To describe the trend in deaths during
2020, the number of deaths from all causes and from COVID-19 were calculated for each
week. Midyear U.S. Census Bureau population estimates (July 1, 2020) were used to
calculate estimated death rates per 100,000 standard population (
5
). Age-adjusted death rates were calculated for deaths by sex and race/ethnicity,
and crude death rates were calculated by age. Age-adjusted death rates for 2020 were
also compared with those from 2019 (
6
).
In 2020, approximately 3,358,814 deaths occurred in the United States (Table). The
age-adjusted rate was 828.7 deaths per 100,000 population, an increase of 15.9% from
715.2 in 2019. The highest overall numbers of deaths occurred during the weeks ending
April 11, 2020, (78,917) and December 26, 2020 (80,656) (Figure 1). Death rates were
lowest among persons aged 5–14 years (13.6) and highest among persons aged ≥85 years
(15,007.4); age-adjusted death rates were higher among males (990.5) than among females
(689.2).
TABLE
Provisional* number and rate of total deaths and COVID-19–related deaths, by demographic
characteristics — National Vital Statistics System, United States, 2020
Characteristic
No. (rate)
†
Total deaths
COVID-19 deaths
§
Total
3,358,814 (828.7)
377,883 (91.5)
Age group, yrs
<1
19,146 (506.0)
43 (1.1)
1–4
3,469 (22.2)
24 (0.2)
5–14
5,556 (13.6)
67 (0.2)
15–24
35,470 (83.2)
587 (1.4)
25–34
72,678 (157.9)
2,527 (5.5)
35–44
103,389 (246.2)
6,617 (15.8)
45–54
189,397 (467.8)
17,905 (44.2)
55–64
436,886 (1,028.5)
44,631 (105.1)
65–74
669,316 (2,068.8)
80,617 (249.2)
75–84
816,307 (4,980.2)
104,212 (635.8)
≥85
1,007,114 (15,007.4)
120,648 (1,797.8)
Unknown
86 (—)
5 (—)
Sex
Female
1,602,366 (689.2)
172,689 (72.5)
Male
1,756,448 (990.5)
205,194 (115.0)
Race/Ethnicity
Hispanic
304,488 (724.1)
68,469 (164.3)
White, non-Hispanic
2,467,419 (827.1)
228,328 (72.5)
Black, non-Hispanic
443,116 (1,105.3)
59,871 (151.1)
Asian, non-Hispanic
90,519 (457.9)
13,334 (66.7)
American Indian or Alaska Native, non-Hispanic
24,279 (1,024.0)
4,504 (187.8)
Native Hawaiian or other Pacific Islander, non-Hispanic
4,424 (828.4)
679 (122.3)
Multiracial, non-Hispanic
15,434 (378.8)
1,125 (31.8)
Unknown
9,135 (—)
1,573 (—)
* National Vital Statistics System provisional data are incomplete. Data from December
are less complete due to reporting lags. These data exclude deaths that occurred in
the United States among residents of U.S. territories and foreign countries.
† Deaths per 100,000 standard population. Age-adjusted death rates are provided by
sex and race/ethnicity.
§ Deaths with confirmed or presumed COVID-19 as an underlying or contributing cause
of death, with International Classification of Diseases, Tenth Revision code U07.1.
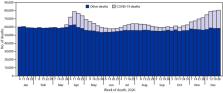
FIGURE 1
Provisional* number of COVID-19–related deaths
†
and other deaths, by week — National Vital Statistics System, United States, 2020
* National Vital Statistics System provisional data are incomplete. Data from December
are less complete due to reporting lags. Deaths that occurred in the United States
among residents of U.S. territories and foreign countries were excluded.
† Deaths with confirmed or presumed COVID-19 as an underlying or contributing cause
of death, with International Classification of Diseases, Tenth Revision code U07.1.
This figure is a bar chart showing the weekly number of COVID-19–related deaths in
the United States during 2020.
During 2020, COVID-19 was listed as the underlying or contributing cause of 377,883
deaths (91.5 per 100,000 population). COVID-19 death rates were lowest among children
aged 1–4 years (0.2) and 5–14 years (0.2) and highest among those aged ≥85 years (1,797.8).
Similar to the rate of overall deaths, the age-adjusted COVID-19–associated death
rate among males (115.0) was higher than that among females (72.5).
Age-adjusted death rates differed by race/ethnicity. Overall age-adjusted death rates
were lowest among Asian (457.9 per 100,000 population) and Hispanic persons (724.1)
and highest among Black (1,105.3) and AI/AN persons (1,024.0). COVID-19–associated
death rates were lowest among multiracial (31.8) and Asian persons (66.7) and highest
among AI/AN (187.8) and Hispanic persons (164.3). COVID-19 was listed as the underlying
cause of 345,323 deaths during 2020 and was the third leading underlying cause of
death, after heart disease (690,882 deaths) and cancer (598,932) (Figure 2).
FIGURE 2
Provisional* number of leading underlying causes of death
†
— National Vital Statistics System, United States, 2020
* National Vital Statistics System provisional data are incomplete. Data from December
are less complete due to reporting lags. Deaths that occurred in the United States
among residents of U.S. territories and foreign countries were excluded.
† Deaths for which COVID-19 was a contributing, but not the underlying, cause of death
are not included in this figure.
This figure is a bar chart showing the top 10 leading underlying causes of death in
the United States during 2020, which were as follows: 1) heart disease, 2) cancer,
3) COVID-19, 4) unintentional injury, 5) stroke, 6) chronic lower respiratory disease,
7) Alzheimer disease, 8) diabetes, 9) influenza and pneumonia, and 10) kidney disease.
Discussion
During January–December 2020, the estimated 2020 age-adjusted death rate increased
for the first time since 2017, with an increase of 15.9% compared with 2019, from
715.2 to 828.7 deaths per 100,000 population. COVID-19 was the underlying or a contributing
cause of 377,883 deaths (91.5 deaths per 100,000). COVID-19 death rates were highest
among males, older adults, and AI/AN and Hispanic persons. The highest numbers of
overall deaths and COVID-19 deaths occurred during April and December. COVID-19 was
the third leading underlying cause of death in 2020, replacing suicide as one of the
top 10 leading causes of death (
6
).
The findings in this report are subject to at least four limitations. First, data
are provisional, and numbers and rates might change as additional information is received.
Second, timeliness of death certificate submission can vary by jurisdiction. As a
result, the national distribution of deaths might be affected by the distribution
of deaths from jurisdictions reporting later, which might differ from those in the
United States overall. Third, certain categories of race (i.e., AI/AN and Asian) and
Hispanic ethnicity reported on death certificates might have been misclassified (
7
), possibly resulting in underestimates of death rates for some groups. Finally, the
cause of death for certain persons might have been misclassified. Limited availability
of testing for SARS-CoV-2, the virus that causes COVID-19, at the beginning of the
COVID-19 pandemic might have resulted in an underestimation of COVID-19–associated
deaths.
This report provides an overview of provisional U.S. mortality data for 2020. Provisional
death estimates can give researchers and policymakers an early indication of shifts
in mortality trends and provide actionable information sooner than the final mortality
data that are released approximately 11 months after the end of the data year. These
data can guide public health policies and interventions aimed at reducing numbers
of deaths that are directly or indirectly associated with the COVID-19 pandemic and
among persons most affected, including those who are older, male, or from disproportionately
affected racial/ethnic minority groups.
Summary
What is already known about this topic?
The COVID-19 pandemic caused approximately 375,000 deaths in the United States during
2020.
What is added by this report?
The age-adjusted death rate increased by 15.9% in 2020. Overall death rates were highest
among non-Hispanic Black persons and non-Hispanic American Indian or Alaska Native
persons. COVID-19 was the third leading cause of death, and the COVID-19 death rate
was highest among Hispanics.
What are the implications for public health practice?
Provisional death estimates provide an early indication of shifts in mortality trends.
Timely and actionable data can guide public health policies and interventions for
populations experiencing higher numbers of deaths that are directly or indirectly
associated with the COVID-19 pandemic.