- Record: found
- Abstract: found
- Article: found
A long non‐coding RNA signature for diagnostic prediction of sepsis upon ICU admission
letter
Xueyan Liu
1 ,
Xubin Zheng
2
,
3 ,
Jun Wang
1 ,
Ning Zhang
1 ,
Kwong‐Sak Leung
3 ,
Xiufeng Ye
2
,
,
Lixin Cheng
1
,
2
,
02 July 2020
Read this article at
There is no author summary for this article yet. Authors can add summaries to their articles on ScienceOpen to make them more accessible to a non-specialist audience.
Abstract
Dear Editor,
Sepsis, the highest mortality disease in critically ill patients, is clinically diagnosed
through the dysregulated systemic inflammatory response of patients to infection in
the presence of organ dysfunction.
1
,
2
,
3
No effective biomarkers and approved molecular therapies have been developed for sepsis
to diagnose and treat the immune response state of the patients, leading to the management
of these critically ill patients only relies on early recognition by experience and
supportive care.
4
,
5
Long noncoding RNAs (lncRNAs) are implicated in a wide variety of biological processes
and accumulative studies have demonstrated that several dysregulated lncRNAs play
important roles in tumorigenesis and tumor progression.
6
,
7
,
8
However, the lncRNA signature has not been studied for the rapid diagnosis of sepsis,
due to the limitation of data sources and lack of RNA‐seq datasets.
3
Hence, we analyzed three whole blood transcriptome cohorts of critically ill adult
patients and identified a 28‐lncRNA signature for sepsis diagnosis, which imputes
a score to assess the risk of sepsis.
The expression profiling of 3745 lncRNAs in three cohorts, GSE95233, GSE28750, and
GSE57065, were normalized and reannotated for the investigation
6
,
9
(Table S1). The largest cohort GSE95233 was set as the discovery dataset, while the
other two independent cohorts were set as the validation datasets. To select lncRNAs
for the predictive signature, we first determined 84 differentially expressed (DE)
lncRNAs between sepsis patients and healthy individuals based on the discovery dataset.
Then we took advantage of a regression algorithm least absolute shrinkage and selection
operator (LASSO) to further identify 28 predictive lncRNAs, named SepSig28, which
serves as a molecular diagnostic signature to calculate the risk score to predict
whether individuals were suffering from sepsis or not. After that, we validated the
diagnostic signature in two independent datasets and demonstrated the high performance
of the 28 lncRNAs in the risk prediction of sepsis (Figure 1A).
FIGURE 1
Model construction and internal validation. A, Workflow to identify the lncRNA signature
of sepsis. B, ROC curves for the 28‐lncRNA signature and other 28‐minus‐one lncRNA
signatures. C, AUC, accuracy, sensitivity, and specificity for the 28‐lncRNA signature
and other 28‐minus‐one lncRNA signatures. D, Distribution of AUCs for the simulated
models in which the lncRNAs were randomly picked up. ROC curve, receiver operating
characteristic curve; AUC, area under curve
Risk score = (BOLA3.AS1 × 0.254) + (LINC00354 × 0.1996) + (C5orf27 × 0.1537) + (RP1.187B23.1
× ‐0.1427) + (MBNL1.AS1 × ‐0.1419) + (LINC01420 × ‐0.1140) + (RP13.436F16.1 × 0.1060)
+ (CTB.31O20.2 × 0.1023) + (LINC01425 × 0.0949) + (C10orf25 × ‐0.0763) + (RP11.111M22.3
× 0.0743) + (LAMTOR5.AS1 × 0.0739) + (FLJ37453 × 0.0713) + (AX746755 × ‐0.0690) +
(TTTY12 × 0.0678) + (ASMTL.AS1 × ‐0.0535) + (LOC101928491 × 0.0461) + (RBM26.AS1 ×
‐0.0438) + (ANP32A.IT1 × 0.0437) + (LOC101060691 × 0.0319) + (MSH5 × ‐0.0311) + (LOC100507221
× 0.0289) + (RP11.1137G4.3 × ‐0.0245) + (LOC100506457 × 0.0237) + (MIR612 × ‐0.0189)
+ (AC114730.11 × 0.0079) + (LOC101927526 × 0.0026) + (LINC01019 × ‐0.0020). The values
following the symbols are the importance weights of the expression abundance of each
lncRNA. These lncRNAs are listed in order of decreasing importance.
When tuned in the discovery dataset using fivefold cross‐validation, the SepSig28
can perfectly classify the sepsis patient samples and healthy control samples, with
all the measures equal 1, including the area under curve (AUC), accuracy, sensitivity,
and specificity (Figure 1B,C). To test the randomness of the model, we randomly picked
up an equivalent number of lncRNAs 1000 times and evaluated their performance using
the same procedure as SepSig28. Our result shows that no random combinations can achieve
the score of AUC as high as 1 (Figure 1D). Besides, we constructed all possible 27‐lncRNA
signatures (28 minus 1) by excluding one lncRNA once a time to evaluate the predictive
capability of each lncRNA in the SepSig28 model. For the discovery dataset, two lncRNA
members are not necessary for the model, as the model can perform equally well without
either of them (Figure 1C). We added these two as supplementary features to make the
model more robust.
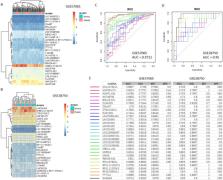
In the independent cohorts GSE28750 and GSE57065, the hierarchical clustering shows
altered expression pattern of the SepSig28 lncRNAs cannot well distinguish sepsis
patient samples from the normal ones (Figure 2A,B). Using the computed risk scores
by weighted sum, however, SepSig28 can achieve the AUC scores as high as 0.9712 for
GSE57065 and 0.95 for GSE28750, respectively (Figure 2C,D), which outperforms almost
all the other combinations of 27 (28 minus 1) lncRNAs. Overall, SepSig28 has the best
classification performance for all three cohorts according to the measures of AUC,
accuracy, sensitivity, and specificity (Figure 2E).
FIGURE 2
External validation of SepSig28. Hierarchical clustering of the expression samples
based on the 28‐lncRNA signature in dataset GSE57065 (A) and 28750 (B), respectively.
ROC curves for the 28‐lncRNA signature and other 28‐minus‐one lncRNA signatures in
dataset GSE57065 (C) and 28750 (D). E, AUC, accuracy, sensitivity, and specificity
for the 28‐lncRNA signature and other 28‐minus‐one lncRNA signatures in the two validation
cohorts
To investigate the biological functions the SepSig28 involved, we associated them
with their co‐expressed genes across the sepsis samples of each cohort. Genes co‐expressed
with the lncRNAs in all the cohorts (Pearson correlation coefficient > 0.7) were considered
to be co‐expressed. Gene Ontology (GO) and KEGG pathway enrichment analysis were separately
performed for the set of co‐expressed genes.
10
GO enrichment analysis showed that the lncRNAs of SepSig28 are mainly involved in
three biological processes, including hormone mediated signaling pathway, RNA splicing,
and histone modification (Figure S1A). KEGG analysis showed the SepSig28 associated
genes are significantly implicated in pathways that are known to be related to sepsis
pathogenesis, including Wnt signaling pathway, Th17 cell differentiation, Notch signaling
pathway, etc. (Figure S1B). Interestingly, both GO and KEGG enrichment revealed that
lncRNAs in SepSig28 tend to participate in hormone signaling related pathways, indicating
an underlying association between hormone signaling and sepsis.
In conclusion, we identified and validated the first non‐coding signature consisting
of 28 lncRNAs that can well distinguish sepsis patients from healthy controls for
adults. Despite limitations such as the limited number of lncRNA features and the
small sample size, we provided evidence that lncRNAs could be adopted as markers for
the diagnosis of critical diseases. The proposed model could be used as an alternative
or complementary diagnostic metric for sepsis.
AUTHOR CONTRIBUTIONS
LC conceived the idea and drafted the manuscript. LC performed data analysis. XL,
XZ, JW, NZ, and RW performed data management and analysis. XL, KL, and XY helped interpret
the results and give suggestions. All authors read and approved the final manuscript.
CONFLICT OF INTEREST
The authors declare no conflict of interest.
Supporting information
Figure S1. Functional analysis of the protein‐coding genes co‐expressed with the 28
lncRNAs in SepSig28. (A) Functional network of the enriched GO terms. Nodes represent
enriched GO terms while edges represent Kappa scores among the nodes. Only the edges
with Kappa scores over 0.5 are shown. Node size represents the number of coexpressed
genes in GO terms, while color indicates the statistical significance of term enrichment.
(B) The enriched KEGG pathways. Node size represents the number of coexpressed genes
in the pathways, while the color represents the enrichment significance.
Click here for additional data file.
Table S1. Discovery and validation cohorts used in this study.
Click here for additional data file.
Related collections
Most cited references6

- Record: found
- Abstract: found
- Article: found
Development and validation of a novel molecular biomarker diagnostic test for the early detection of sepsis
Allison Sutherland, Mervyn Thomas, Roslyn A Brandon … (2011)
- Record: found
- Abstract: found
- Article: not found
Analysis of long noncoding RNAs highlights region-specific altered expression patterns and diagnostic roles in Alzheimer’s disease
Meng Zhou, Xinyu Wang, Jie Sun … (2018)

- Record: found
- Abstract: found
- Article: found
CrossNorm: a novel normalization strategy for microarray data in cancers
Lixin Cheng, Leung-Yau Lo, Nelson L S Tang … (2016)